|
USENIX '05 Paper
[USENIX '05 Technical Program]
Interactive Performance Measurement with VNCplay
Nickolai Zeldovich Ramesh Chandra
Computer Science Department
Stanford University
{nickolai, rameshch}@cs.stanford.edu
Abstract
Today many system benchmarks use throughput as a measure of
performance. While throughput is appropriate for benchmarking server
environments, response time is a better metric for evaluating desktop
performance. Currently, there is a lack of good tools to measure
interactive performance; although several commercial GUI testing
tools exist, they are not designed for performance measurement.
This paper presents VNCplay, a cross-platform tool for measuring
interactive performance of GUI-based systems.
VNCplay records a user's interactive session with a system and replays
it multiple times under different system configurations;
interactive response time is evaluated by comparing the times at
which similar screen updates occur in each of the replayed sessions.
Using VNCplay we studied the effect of processor speed and disk load
on interactive performance of Microsoft Windows and Linux.
These experiments show that the same user session can have widely
varying interactive response times in different environments
while maintaining the same total running time,
illustrating that response time is a better measure
of interactive performance than throughput.
The experimental results make a case for a response time
measurement tool like VNCplay.
1 Introduction
Most performance evaluation studies today use throughput benchmarks to
quantify system performance. However, throughput is not an
appropriate performance metric for user desktops. User interface
studies [12] have shown that response time,
rather than throughput, is the right measure of interactive
performance. We believe that the lack of research studies
on interactive performance is due to the lack of tools that
measure response time.
In designing VNCplay, we came up with the following characteristics
that a good tool for benchmarking interactive performance should have.
First, it should be able to record an interactive session and replay it
multiple times under different environments, so that the same repeatable
workload can be used to meaningfully compare interactive performance.
Second, the tool should be able to extract a measurement of response time from
replayed sessions to quantify the observed performance.
Finally, it is desirable that the tool not be tied to a specific platform
or GUI toolkit, so that researchers can compare the performance of various
systems.
We developed a tool, called VNCplay, that satisfies the above criteria.
This tool was developed out of a need to evaluate the interactive
performance of the Collective system [10,2]. There
are several commercial GUI testing tools that provide some
amount of recording and replay capability [15,17,14].
However, they are mainly intended for testing and do not replay
reliably when the system is slow.
Furthermore, they only support specific toolkits and do not have
a facility for extracting measurements from the replays.
VNCplay uses the VNC remote display protocol [9] for
recording and replaying sessions.
Since VNC servers are available for many platforms, VNCplay supports a
wide variety of systems.
In addition, we developed an analysis
technique to extract useful response time measurements from the replay
sessions. We used VNCplay to evaluate the effect of processor speed and
disk I/O on response times of interactive applications. This
evaluation shows that throughput benchmarks are not sufficient in
measuring interactivity and validates the need for a tool such as
VNCplay.
The rest of the paper describes VNCplay in more
detail.
A short user's view of VNCplay is presented in Section 2.
Section 3 explains the design and implementation of VNCplay.
In Section 4 we demonstrate the use of VNCplay in evaluating the interactive
performance of Microsoft PowerPoint and OpenOffice Impress over a range of CPU speeds
and I/O loads, as well as evaluating the interactive performance of
different Linux disk I/O schedulers.
Section 5 describes some ideas for future work.
Related work is discussed in Section 6 and we
conclude in Section 7.
2 User's View of VNCplay
Using VNCplay to record and replay interactive sessions is as easy as using
a VNC client. To record a session, a user runs
$ vncplay record server:port trace.vnc
This command brings up a VNC client connected to the specified server.
The user performs the workload to be recorded, and closes the VNC client
at the end of the workload.
In case of the command shown, the user's workload is saved into the file
trace.vnc.
To replay a recorded workload, the user runs
$ vncplay play server:port trace.vnc out.rfb
The workload from trace.vnc will be replayed against the specified
VNC server, and the entire session output will be saved into a log file
out.rfb for later review or analysis.
A view-only VNC client (one that will not accept keyboard and mouse input
from the user) will be displayed while the replay is taking place, to
provide the user with visual feedback.
To allow for unattended session replay, the password for the VNC server
can be saved to a file and passed to vncplay by specifying the
-pwfile option on the command line.
To obtain interactive performance metrics from replayed sessions, the user
first runs an analysis stage on the session log files, which takes some
time to run (on our computer it takes approximately as long as replaying
each of the sessions):
$ vncplay analyze out1.rfb ... > analyze.out
The command shown above produces intermediate analysis results in analyze.out,
which can be then used to generate graphs like the ones presented later in this
paper. For example, a cumulative distribution function of response times can
be generated by
$ vncanalyze cdf analyze.out > cdf.out
The resulting cdf.out can be plotted by a tool
like gnuplot [5].
3 Design and Implementation
VNCplay consists of three components: a recorder, a replayer, and an analyzer.
The recorder and replayer provide reliable replay of interactive sessions.
The analyzer takes replayed sessions and extracts interactive
performance metrics from them.
All of the components are based on a modified version of the
TightVNC [13] Java client.
The following sections describe some details of the design and
implementation of VNCplay.
3.1 Recording and Playback
Based on our past experience with interactive session replay tools,
such as [15,7,19,1],
we observed that one of the biggest problems that all of the tools have
in common is correctly replaying mouse clicks.
Most tools replay each input event, such as a mouse click, at exactly
the same time that it occurred during recording.
When replaying a session on a slower system, such an approach is not
appropriate, as it can easily lead to mouse clicks being delivered to
the wrong application.
For example, suppose that during recording, the user brings up a window
and clicks on a button in that window.
During replay on a slower system, the window might take a few more seconds
to appear.
A purely time-based replay tool would click on the background image,
where the button should have been, without waiting for the window and
button to appear, resulting in different behavior in the replay than
in the recorded session.
This is not acceptable; therefore VNCplay's recorder and replayer focus
largely on reliable delivery of mouse events.
Section 5 discusses reliable replay of sessions with
both keyboard and mouse input.
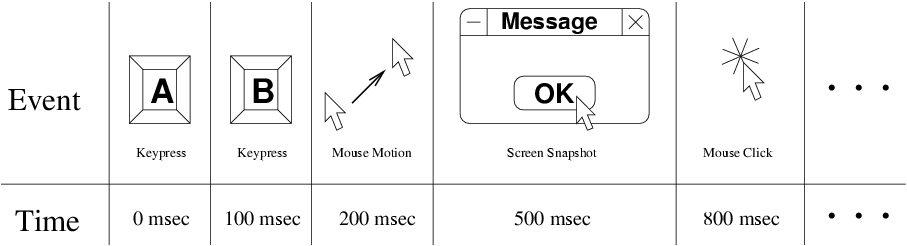
Figure 1: Example of a replay log used to record and play back
VNC sessions.
Keys "A" and "B" were pressed at 0 and 100 msec respectively,
the mouse cursor was moved at 200 msec, a screen snapshot was
taken at 500 msec, and a mouse click happened at 800 msec.
The VNC recorder acts like a normal VNC client, except that it records
the user's activity into a VNC replay log, such as the one shown in
Figure 1.
The log contains input events (mouse clicks and movements, and key presses)
along with timestamps of when these events occurred.
For each mouse click event, a snapshot of the screen is taken by the
recorder and written to the replay log.
These screen snapshots will enable the VNC replayer to reliably deliver
the associated mouse click events.
During playback, the replayer connects to a VNC server as a client,
and reads events from the VNC replay log.
Events from the replay log are processed according to their timestamps;
input events such as key presses and mouse movements are sent to the
VNC server directly.
For mouse clicks, the VNC replayer waits for the screen image to
match the corresponding screen snapshot in the replay log before
sending the mouse click event.
The screen snapshot captures the visual state of the system when the
user clicked the mouse during recording.
By waiting for the screen image to match the snapshot, we ensure that
the system has reached the same state during replay as during recording,
at which time the mouse click can be safely delivered.
The replayer records all of the screen updates received from the server
during replay into a log file [8] for later analysis or
debugging.
This allows the analysis of the replayed session to be performed at a
later time offline, as it can be computationally intensive.
3.2 Reliable Playback
To reliably replay the same session multiple times, the system must
behave repeatably - that is, at each replay, it should start
from the same state, and given the same input, it should provide
the same output.
In working with VNCplay, we have found that complex desktop environments,
such as Windows or Linux, are not fully deterministic from the point of
view of VNC. This section describes some of the problems we encountered
in achieving reliable session playback, and workarounds we have
implemented to address them.
We found that a snapshot of the entire screen is often difficult to match
during replay; non-deterministic elements like the system clock or tooltips
are usually different between recording and replay, and get in the way
of perfect reproducibility.
VNCplay uses screen snapshots to ensure that mouse clicks are delivered to
the same UI element during replay as during recording.
For this purpose, we have found that it suffices to take a snapshot of
just the screen area around the mouse cursor.
For example, if during recording the user clicks on an "OK" button, we
only need to take a snapshot of the button to ensure that we click on it
correctly during replay.
In our current implementation, we use a square area of about 10 pixels
by 10 pixels around the cursor for screen snapshots.
This significantly improves VNCplay's ability to reliably
replay sessions, by avoiding non-deterministic tooltips
and other changing screen elements.
VNCplay attempts to deliver mouse click events reliably during playback,
but other events, such as mouse motion, are simply replayed at the
pace at which they were recorded.
This resulted in some surprising behavior in a situation where
mouse motion does matter.
Some GUI elements, such as menus, change appearance when the mouse
is located over them - for example, the menu item that the mouse
is pointing to might be highlighted.
When a menu is slow to open, VNCplay will move the mouse cursor to
where it expects the menu item to appear, before the menu item
actually appears on the screen.
As it turns out, in Windows, menu items "notice" that the
mouse is pointing to them and highlight themselves only when
the mouse moves.
Thus, if the mouse is already pointing to a menu item by the
time the menu item is drawn, the menu item will fail to notice
that it should be highlighted.
In turn, VNCplay will be unable to match the screen snapshot taken
during recording, which shows a highlighted menu item, and replay
will stall.
To fix this problem, the replayer wiggles the mouse cursor by one
pixel while waiting for a screen snapshot to match.
This triggers "on-mouse-motion" callbacks in such GUI
elements, allowing VNCplay to proceed with playback.
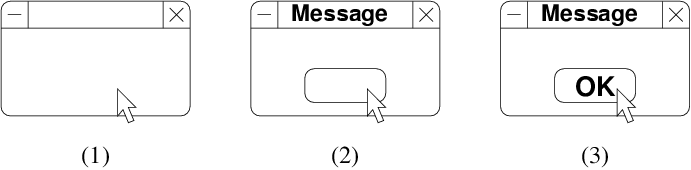
Figure 2: Three consecutive screen updates, as a dialog box is
being rendered, that could be combined by the VNC server.
VNC quiescing ensures that only the last screen update in
such a sequence is used for a screen snapshot.
VNC is a very simple remote frame buffer protocol, in which
the server provides periodic screen updates to the client at
arbitrary intervals; it is up to the server to decide when a
screen update should be sent to the client.
The VNC protocol provides a kind of "eventual consistency"
guarantee: when an image appears on the server's screen and
stays there, a screen update containing that image will
eventually be sent to the client.
In particular, consider the effect of this remote frame buffer
model on the updates seen by a VNC client during the rendering
of a complex user interface.
A VNC client might receive a screen update for every intermediate
step of rendering the screen image, such as the steps shown in
Figure 2, or it might only see one screen
update representing the final state - such as step 3 in the
figure.
This behavior of VNC screen updates complicates the process of
taking a screen snapshot in VNCplay, because a screen snapshot is
something that we expect to see each and every time we replay
the recorded session.
If the recorder takes a snapshot using an intermediate screen
update, during replay the VNC server might not send us the same
intermediate screen update, instead choosing to send only the final
state and thereby preventing the replayer from matching the screen
snapshot.
For example, if we take a screen snapshot using step 1 or 2 in
Figure 2 during recording, the server may
choose to only send us the third screen update from the figure,
preventing the replayer from successfully matching the screen
snapshot.
This means that if replay is to be reliable, screen snapshots
taken by the VNC recorder should not be intermediate screen states.
To get around the problem of intermediate screen states, we implement
VNC protocol quiescing during recording.
When the recorder decides to take a screen snapshot, it temporarily
blocks input events from being sent to the VNC server, and waits a
short period of time for the system to process all prior user input
and come to some final state; in other words, quiesce.
After the screen has quiesced, the recorder takes a screen snapshot,
and any blocked input events are sent to the VNC server.
This technique produces screen snapshots which can be reliably
observed during playback, and allows for robust replay of sessions.
We have measured the time required for the operating system and the
VNC server to quiesce under workloads such as a user using Microsoft
PowerPoint or Word.
On a 100 Mbps local area network, the VNC screen image quiesces within
100 milliseconds; VNCplay conservatively waits for 150 milliseconds before
taking a screen snapshot.
3.3 Performance Analysis
The main metric that we wish to obtain from the interactive replay
experiments is the response time for each input event.
We implemented an analyzer that compares a set of replayed sessions
and extracts interactive response times for various input events.
The analyzer looks for similar screen updates between the replayed
sessions; for example, if the user opens a menu in the recorded session,
the analyzer would find the times at which the menu opened in the
different replays.
For each matching screen update, it finds the nearest preceeding input
event in all of the sessions, and assumes that this input event caused
the screen update.
The time difference between the screen update and the input event in
each session is taken as the interactive response time for that input
event in that session.
To make the analyzer run in acceptable space and time, we had to make
a few optimizations.
First, the resolution of all screen updates is scaled down (currently by
a factor of four in each dimension).
This reduces the size of each screen update by a factor of 16, without
impacting the accuracy of screen matching - the features we want to
match are larger than 4 pixels.
Next, screen updates that happen at the same time are coalesced,
reducing the number of screen updates that need to be scanned.
Lastly, only significant screen updates are analyzed to find
corresponding matches - currently the threshold we use is at
least 2% pixel difference from the previous analyzed update.
This optimization prevents the analyzer from analyzing periods
of little or no activity (for example, only mouse movement).
As a result of these optimizations, the analyzer can compare two
typical interactive sessions on a 2.4GHz Pentium IV computer with
1GB of memory in about the same time it takes to replay the sessions.
4 Evaluation
This section describes our experience using VNCplay to evaluate
interactive performance of Microsoft Windows and Linux.
We subject these systems to various workloads and
compare the interactive performance under these scenarios.
We performed four sets of experiments.
The first two experiments measure effect of processor speed and disk I/O on
interactive performance.
The third experiment demonstrates that VNCplay can reliably replay interactive
sessions over a wide range of system response times by running workloads on a
system with an extremely slow disk, which increases the total runtime by a
factor of 10.
Finally, the fourth experiment shows that we can measure interactive performance
of a conventional Linux machine without the use of VMware, by evaluating the
interactive performance effects of different disk I/O schedulers in Linux 2.6.
For the first three experiments, we used VMware's GSX Server [16]
to run the system to be measured.
VMware simplifies the task of making an identically-configured system for
each experimental run.
It also provides an efficient and platform-independent VNC server that is
connected to the virtual machine's console.
These experiments were done on a Thinkpad T42p laptop with a 2.0 GHz Pentium M processor,
1GB of memory and a 7200rpm 60GB hard drive.
For experiments with VMware virtual machines, we used the VNC recorder to record
a user session in a virtual machine containing Microsoft Windows XP and Microsoft
Office 2003, and another virtual machine containing Fedora Core 1 Linux and
OpenOffice.
Both sessions lasted about 6 minutes and consisted of a user creating a presentation,
either in PowerPoint or OpenOffice Impress.
These sessions was replayed in a variety of environments and the resulting session
logs analyzed for interactive performance.
4.1 Effect of Processor Speed
We used the Enhanced Speedstep capabilities of the Pentium M processor
to vary the processor speed from 300 MHz to 2.0 GHz and replayed both
the PowerPoint and OpenOffice sessions in each of these scenarios.
A point to note here is that the Pentium M processor running at a
reduced speed does not accurately simulate the performance of an
older processor that normally runs at that speed.
This is because other characteristics of the processor, such as cache
size and memory bus speed, remain unchanged.
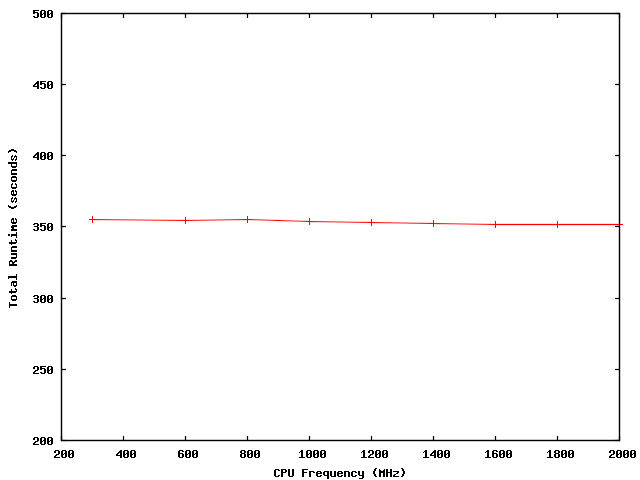
Figure 3: Total running time of a Microsoft PowerPoint session at various
processor speeds
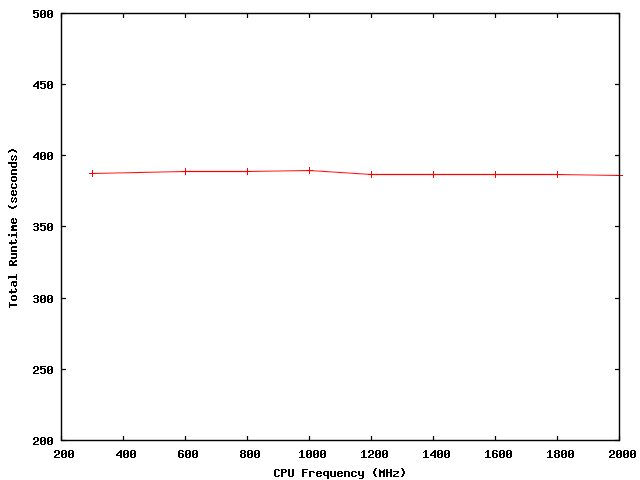
Figure 4: Total running time of a Linux OpenOffice session at
various processor speeds
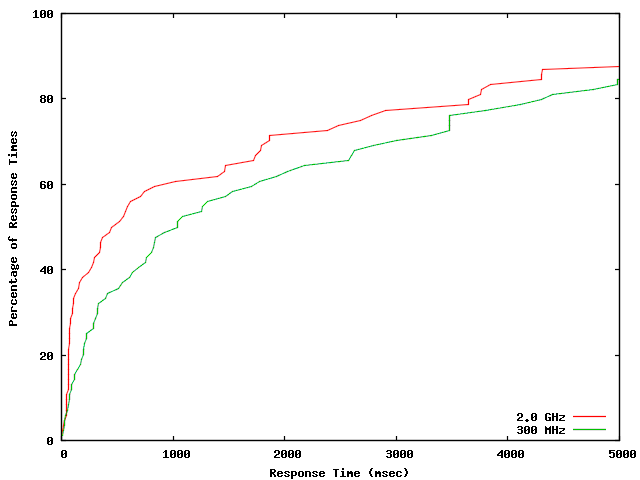
Figure 5: CDF plot of interactive response times for Microsoft PowerPoint under different
conditions: on a 2.0 GHz machine and on a simulated 300 MHz machine.
Each line shows the fraction of interactive response times (vertical axis)
that are within a certain value (horizontal axis).
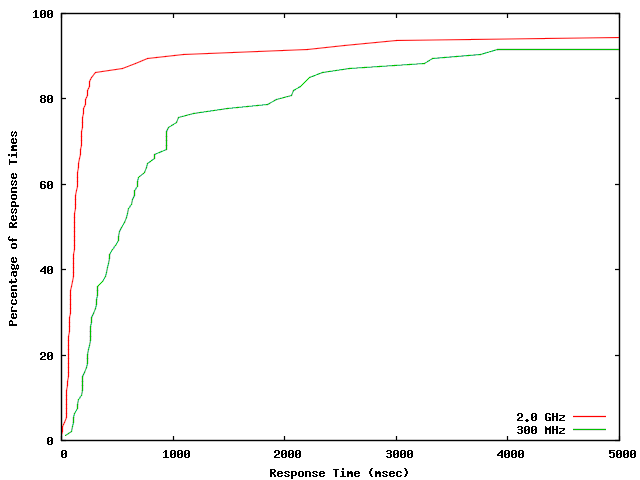
Figure 6: CDF plot of interactive response times for Linux OpenOffice under different
conditions: on a 2.0 GHz machine and on a simulated 300 MHz machine.
Each line shows the fraction of interactive response times (vertical axis)
that are within a certain value (horizontal axis).
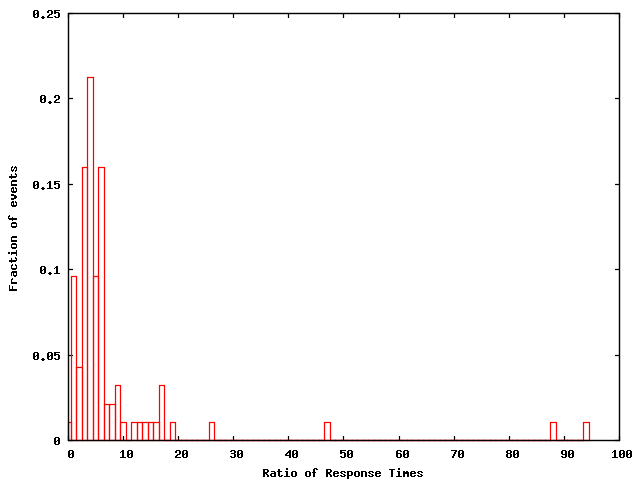
Figure 7: Histogram of the ratio of interactive response times for Linux OpenOffice
on a simulated 300 MHz machine and a 2.0 GHz machine.
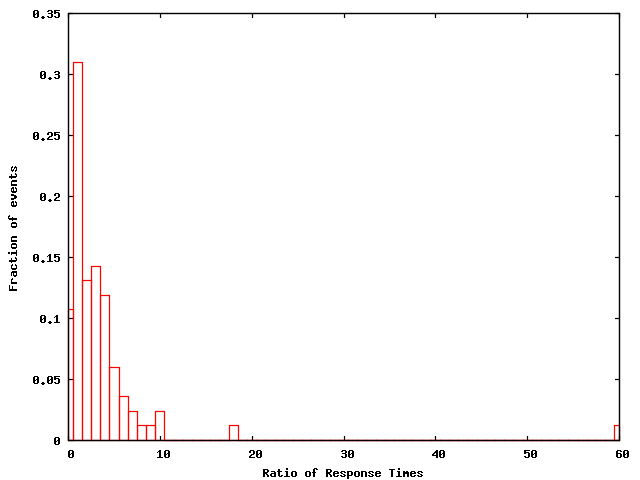
Figure 8: Histogram of the ratio of interactive response times for Microsoft PowerPoint
on a simulated 300 MHz machine and a 2.0 GHz machine.
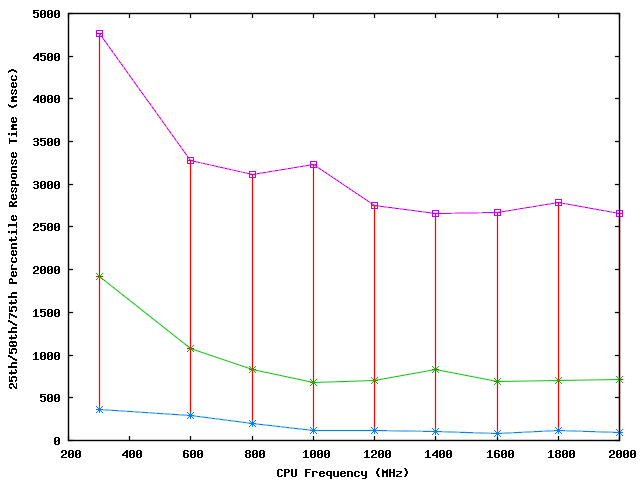
Figure 9: 25th/50th/75th percentiles of the interactive event latencies for Microsoft PowerPoint at
various processor speeds
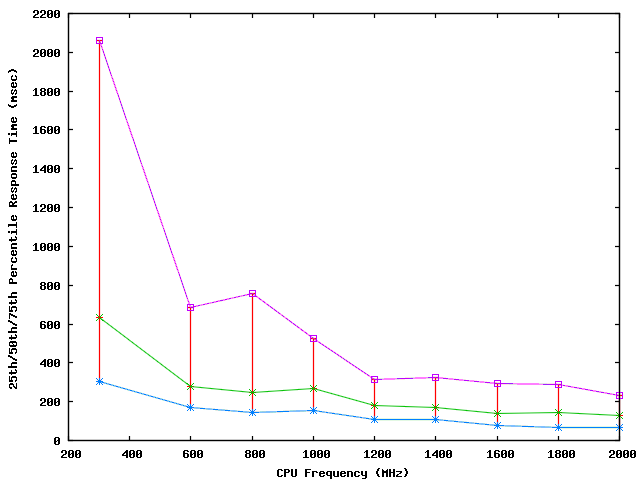
Figure 10: 25th/50th/75th percentiles of the interactive event latencies for Linux OpenOffice at
various processor speeds
Figures 3 and 4
show the total running time of the PowerPoint and OpenOffice sessions for
various processor speeds. The running time stays more or less the same,
with the difference between fastest and slowest times being less than 1%.
However, the interactive response times of individual events are very
different for different processor speeds.
Figures 5 and 6 show a
CDF plot of the response times for sessions replayed under two different
configurations: a simulated 300 MHz system and a 2.0 GHz system.
The CDF plot shows the fraction of time that the system's response to
user input was within a given value. For instance, a point with an
x-axis value of 1 second and y-axis value of 90% would indicate that
90% of the time, the interactive response time was within 1 second.
These figures clearly show that both PowerPoint and OpenOffice running at
300 MHz respond much slower than running at 2.0 GHz, and a user would find
it to be significantly sluggish.
For example, in the Linux OpenOffice environment the response time at
the 40th percentile when running at 300 MHz is about five times the response
time as when running at 2.0 GHz. The slowdown is further illustrated by
Figures 7 and 8.
These figures show the ratio of response times
of events in OpenOffice and PowerPoint running at 300 MHz, to the response
times of the same events while running at 2.0 GHz. The OpenOffice plot shows that
most of the events are slowed down by a factor of two to factor of five, while for
PowerPoint the slowdown is much more modest. This shows that OpenOffice running
under Linux requires more CPU resources than PowerPoint under Windows XP.
Note that inspite of the significant differences in response times
between the 300 MHz and the 2.0 GHz runs, the
total run time is the same in both OpenOffice and PowerPoint.
This is because the interactive sessions consist of considerable amount
of idle time between events (i.e., user think time).
The extra latency in the 300 MHz sessions is absorbed by this idle time,
leaving the total running time unchanged.
This clearly demonstrates that total run time (and hence throughput
benchmarks) are not appropriate for studying interactive responsiveness
of systems and makes a case for tools like VNCplay.
To compare across a range of processor speeeds, we plot the
25th, 50th, and 75th percentile response time latencies
at various processor speeds in Figures 9 and
10.
From these figures, we see that there is a minimum processor speed (between
300 MHz and 600 MHz) below which the interactive performance of office
workloads degrades rapidly. Increases in processor speed beyond this
point provide a gradually diminishing increase in returns, as is to be
expected.
4.2 Effect of Disk I/O
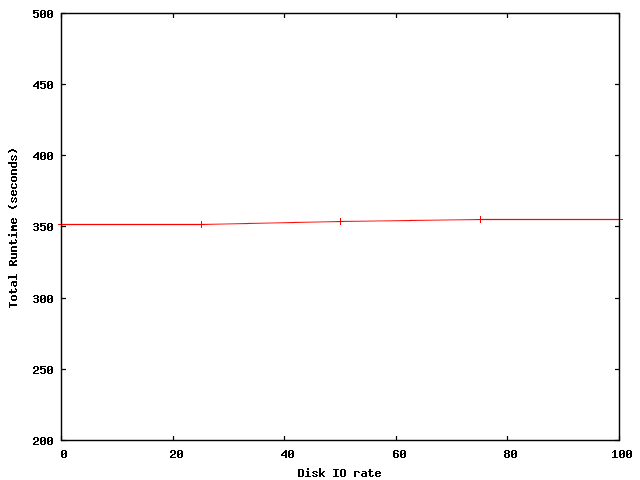
Figure 11: Total running time of the PowerPoint session at various disk I/O rates
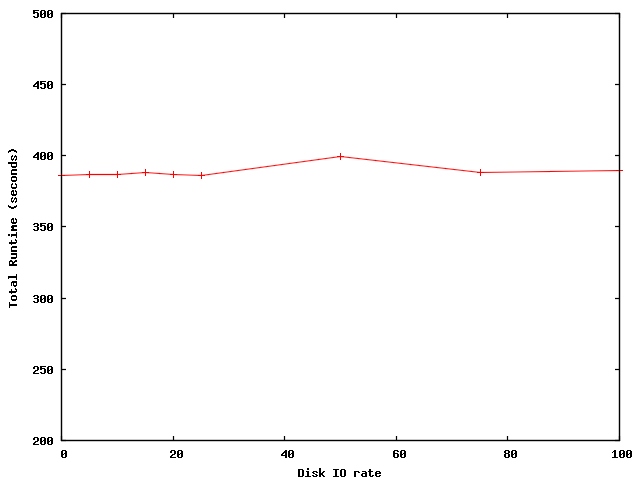
Figure 12: Total running time of the OpenOffice session at various disk I/O rates
We measure the effect of disk I/O on the interactive performance of
Microsoft Windows and Linux systems by injecting background disk activity
and replaying the PowerPoint and OpenOffice sessions.
We wrote a small utility that performs background disk I/O at a specified rate.
Each disk I/O is a 32 KB read from the disk.
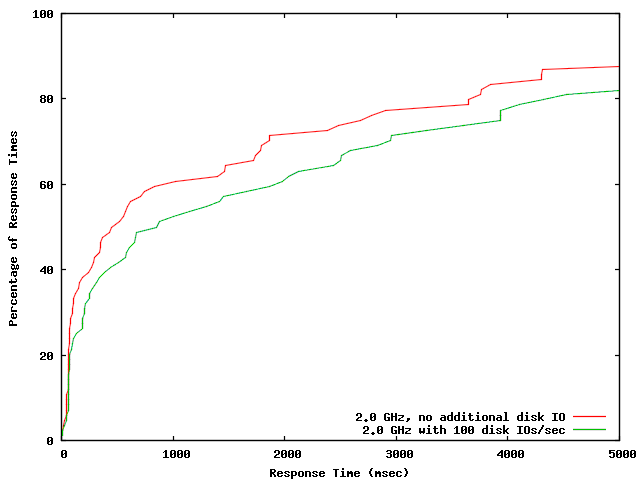
Figure 13: CDF plot of interactive response times for Microsoft PowerPoint under different
conditions: on a 2.0 GHz machine with no additional disk IO and on the same
machine experiencing 100 additional disk IOs per second.
Each line shows the fraction of interactive response times (vertical axis)
that are within a certain value (horizontal axis).
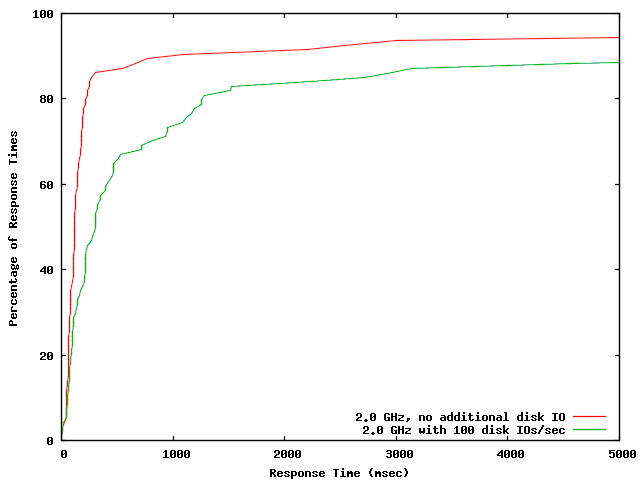
Figure 14: CDF plot of interactive response times for Linux OpenOffice under different
conditions: on a 2.0 GHz machine with no additional disk IO and on the same
machine experiencing 100 additional disk IOs per second.
Each line shows the fraction of interactive response times (vertical axis)
that are within a certain value (horizontal axis).
Figures 11 and 12
show the total run times for various disk I/O rates.
As in the previous experiment, the differences in total run times are very small.
In Figures 13 and 14 we can
see the distribution of interactive response times in two sessions: one
with no extra background disk activity and the other with a rate of
100 disk I/Os per second.
The response times for the latter session are higher than the ones
in the former session.
Although the interactive response times of the system are noticeably different
in the two cases, the total runtime remains the same, underscoring the need
for an interactive performance measurement tool like VNCplay.
4.3 Reliable Session Playback
To verify that our tools can replay interactive sessions in extreme
environments, we simulated an environment with an extremely slow disk
subsystem.
In particular, we moved the virtual disks of our experimental virtual machine onto
an NFS file server connected by a simulated 1.5 Mbps down / 384 Kbps up
DSL network link with 40ms round-trip latency.
We then replayed a PowerPoint session and a similar Word session on
this virtual machine. Although the total running time of the sessions
increased from 6 minutes to approximately an hour, the sessions
nonetheless completed successfully.
This suggests that our replay mechanism is robust against large
variations in system response time.
4.4 Replay without VMware
In the above experiments, we used VMware to run the system to be
measured. In some experiments this might not be appropriate and the
system might need to run on physical hardware. In this section, we
demonstrate the use of VNCplay in one such scenario: measurement of
the effect of different linux disk I/O schedulers on interactive
performance. This experiment needs to be performed on physical
hardware since VMware's high overhead for disk I/O can bias the
experimental results.
The test machine in this case was a 2.2GHz Xeon machine with 4GB of
memory, running Fedora Core 3.
The system was configured to run a standard graphical login session on a
VNC server for the purpose of this experiment.
For each replay session, a test user account was created from scratch and
the machine was rebooted to clear the buffer cache. This ensures that the test
machine is brought back to the same state at the beginning of each experimental
run.
For this experiment, we recorded a user session lasting about 8
minutes. This consisted of a user creating a simple presentation in OpenOffice Impress,
developing a small program in the KDevelop integrated development environment, and
changing his desktop background. The Linux system was configured with a different I/O
scheduler on each experiment run, and we injected heavy background disk activity. The session
was replayed to analyze interactive performance. We tested the anticipatory, deadline,
cfq, and noop schedulers that are present in the Linux 2.6 kernel.
| Scheduler | Total Runtime (min) |
| anticipatory | 14.1 |
| cfq | 7.7 |
| deadline | 7.5 |
| noop | 7.4 |
Figure 15: Total running time of the user session with various I/O schedulers
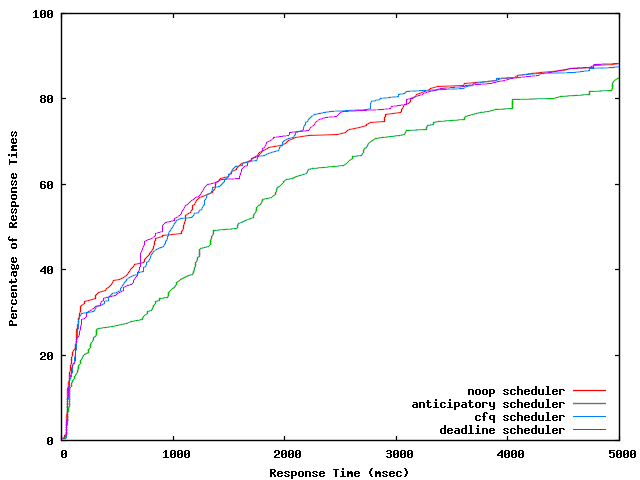
Figure 16: CDF plot of interactive response times for a desktop Linux workload
using different disk I/O schedulers and a heavy background disk I/O load.
Figure 15 shows the total runtime, and
Figure 16 shows the CDF plot of response times for
sessions replayed under the various schedulers. As these figures illustrate,
the anticipatory disk scheduler has the worst interactive performance under
heavy disk load. This can be easily explained by the anticipatory scheduling
algorithm. After having serviced a disk request from a process, the anticipatory
scheduler waits for a short period of time for subsequent requests from the same
process; any disk requests so received are given high priority. Thus this algorithm favors
disk requests from background process with heavy disk activity, and hurts
the performance of interactive processes.
From the results of our evaluation, we observe that latency measurements rather than
total runtime are an appropriate metric of interactive performance. We also see that
VNCplay can robustly measure interactive latency over a wide range of scenarios, including various
platforms such as Microsoft Windows and Linux, and wide variations in system response time.
5 Future Work
There are a few areas in which our current recorder and replayer
fall short. Our current implementation does not attempt to properly
synchronize keyboard input events. To make session replay robust
across a wide range of workloads, we have worked around the problem
by explicitly inserting screen snapshots before keyboard input.
This is done by making additional mouse clicks in the application
before any keyboard input is sent.
Time-sensitive UI elements are another shortcoming of our system we hope
to address in the future. For instance, Windows makes use of sub-menus
that automatically expand when the mouse cursor hovers over a menu item
for some period of time. The VNC replayer does not wait for the
sub-menu item to appear before proceeding with the replay, and thus
can sometimes go astray when replaying in a slow environment.
In the current system, we explicitly click on each
menu item, even if it has already expanded automatically, to ensure
that session can be replayed reliably.
We are exploring the following idea to learn dependencies between
input events (both keyboard and mouse) and output events
from many replay sessions. After recording an interactive session on a
baseline system, we replay the same workload on the baseline system
with slight timing variations in the input. Using the runs that were
successful, VNCplay learns which output events must always happen before
an input event is sent, and which ones are irrelevant for the purpose
of dependencies. We believe that this information can be used to make
replay very robust.
An alternative approach to handling keyboard input is to use a
mouse-driven keyboard input tool like the Character Map in Windows.
6 Related Work
Industry benchmarks such as Winbench and Winstone [18]
measure the time to complete a fixed workload, but do not indicate how
responsive the system is to user input.
Several tools available today for replaying interactive workloads are
toolkit-specific [15,17,19,14,1].
In contrast, VNCplay is toolkit- and platform-agnostic. Most of the
above tools are intended for GUI testing and require the user to
manually insert delay statements for correct replay on slower
systems. In addition, to the best of our knowledge, none of them
provide response time measurements for the replayed sessions. VNCplay provides
such measurements and can also be used to perform GUI testing and task
automation similar to the tools mentioned above.
Interest in the research community on quantifying interactive
performance has been relatively
recent. Endo et. al. [4,3] make a case for
using latency as a measure for interactive performance. Recent work on
measuring thin client systems [11,6] uses
response time as a measure of performance of thin client systems.
However, there is no general toolkit for measuring
interactive response times, and we developed VNCplay to fill this need.
7 Conclusions
This paper presents a tool for reliably replaying interactive user
sessions by correlating screen updates with user input while recording
and obeying this ordering during replay. The interactive performance
of the system in each of the replayed sessions is analyzed by
comparing the timestamps of matching screen updates across
sessions. Our evaluation of the tool suggests that it is
useful for measuring interactive performance of real systems.
8 Availability
The toolkit described in this paper is available for download at:
https://suif.stanford.edu/vncplay/
9 Acknowledgements
This material is based upon work supported in part by the National Science Foundation
under Grant No. 0121481.
We thank Constantine Sapuntzakis and Monica Lam for their input during the design
and implementation of the VNCplay tool.
References
- [1]
-
AutoIt version 3 home page.
https://www.autoitscript.com/autoit3/.
- [2]
-
Chandra, R., Zeldovich, N., Sapuntzakis, C., and Lam, M. S.
The Collective: A cache-based system management architecture.
In Proceedings of 2nd USENIX Symposium on Networked Systems
Design and Implementation (NSDI) (to appear).
- [3]
-
Endo, Y., and Seltzer, M.
Improving interactive performance using TIPME.
In Proceedings of the 2000 ACM SIGMETRICS international
conference on Measurement and modeling of computer systems (2000),
pp. 240-251.
- [4]
-
Endo, Y., Wang, Z., Chen, B., and Seltzer, M.
Using latency to evaluate interactive system performance.
In Proceedings of the 1996 Symposium on Operating System Design
and Implementation (October 1996).
- [5]
-
gnuplot homepage.
https://www.gnuplot.info/.
- [6]
-
Nieh, S. J. Y. J., and Novik, N.
Measuring thin-client performance using slow-motion benchmarking.
In Proceedings of the 2001 USENIX Annual Technical Conference
(June 2001).
- [7]
-
Scriptable VNC session control.
https://cyberelk.net/tim/rfbplaymacro/.
- [8]
-
RFB proxy.
https://cyberelk.net/tim/rfbproxy/.
- [9]
-
Richardson, T., Stafford-Fraser, Q., Wood, K. R., and Hopper, A.
Virtual network computing.
IEEE Internet Computing 2, 1 (January/February 1998), 33-38.
- [10]
-
Sapuntzakis, C., Chandra, R., Pfaff, B., Chow, J., Lam, M., and Rosenblum,
M.
Optimizing the migration of virtual computers.
In Proceedings of the Fifth Symposium on Operating Systems
Design and Implementation (December 2002).
- [11]
-
Schmidt, B. K., Lam, M. S., and Northcutt, J. D.
The interactive performance of SLIM: a stateless, thin-client
architecture.
In Proceedings of the 17th ACM Symposium on Operating System
Principles (December 1999).
- [12]
-
Schneiderman, B.
Designing the User Interface: Strategies for Effective
Human-Computer Interaction, third ed.
Addison Wesley Longman, 1998.
- [13]
-
TightVNC web page.
https://www.tightvnc.com/.
- [14]
-
Sun workshop visual replay.
https://www.atnf.csiro.au/computing/software/sol2docs/manuals/visual/user_guide/Replay.html.
- [15]
-
Rational VisualTest.
https://www.ibm.com/software/awdtools/tester/robot/.
- [16]
-
VMware GSX server.
https://www.vmware.com/products/server/gsx_features.html.
- [17]
-
Mercury WinRunner.
https://www.mercury.com/us/products/quality-center/functional-testing/winrunner/.
- [18]
-
Business Winstone.
https://www.veritest.com/benchmarks/bwinstone/.
- [19]
-
Xnee home page.
https://www.gnu.org/software/xnee/www.
|