| ||||||||||||||||||||||||||||||||||||||||||||||||||||
|
USENIX 2002 Annual Technical Conference Paper
[USENIX 2002 Technical Program Index]
The Performance of Remote Display Mechanisms for Thin-Client ComputingS. Jae Yang, Jason Nieh, Matt Selsky, and Nikhil Tiwari Department of Computer Science Columbia University {sy180, nieh, selsky, nst8}@cs.columbia.edu
AbstractThe growing popularity of thin-client systems makes it important to determine the factors that govern the performance of these thin-client architectures. To assess the viability of the thin-client computing model, we measured the performance of six popular thin-client platformsCitrix MetaFrame, Microsoft Terminal Services, Sun Ray, Tarantella, VNC, and Xrunning over a wide range of network access bandwidths. We find that thin-client systems can perform well on web and multimedia applications in LAN environments, but the efficiency of the thin-client protocols varies widely. We analyze the differences in the various approaches and explain the impact of the underlying remote display protocols on overall performance. Our results quantify the impact of different approaches in display encoding primitives, display update policies, and display caching and compression techniques across a broad range of thin-client systems. 1. IntroductionIn the last two decades, the centralized computing model of mainframe computing has shifted to the more distributed model of desktop computing. But as these personal desktop computers become ubiquitous in today's large corporate and academic organizations, the total cost of owning and maintaining them can become unmanageable. In response to this challenge, there is a growing movement to return to a more centralized and easier-to-manage computing strategy. The thin-client computing model is the embodiment of that movement. The goal of the thin-client model is to centralize computing resources, with all the attendant benefits of easier maintenance and cheaper upgrades, while maintaining the same quality of service for the end user that could be provided by a dedicated workstation. In a thin-client computing environment, end users move from full-featured computers to thin clients, lightweight machines primarily used for display and input and which require less maintenance and less frequent upgrades. Organizations then provide computing services to their end users' thin clients from high-powered servers over a network connection. Server resources can be shared across many users, resulting in more effective utilization of computing hardware. While thin-client computing is reminiscent of the days of mainframe computing, today's users can no longer be satisfied by dumb terminals that only input and output ASCII text. Thin clients must be able to support graphical computing environments effectively to meet the users demands. The key mechanism for achieving this is a remote display protocol that enables graphical displays to be served across a network to a client device, while all application logic is executed on the server. Using such a protocol, the client transmits user input to the server, and the server returns screen updates to the client. For some thin-client systems, no unrecoverable state is stored on the client at all. Because of the potential cost benefits of thin-client computing, a wide range of thin-client platforms have been developed. Some are designed specifically for use over high-bandwidth local area networks, while others attempt to provide quality service over slow network connections. Some application service providers (ASPs) are even offering thin-client service over wide area networks such as the Internet [3, 21]. The growing popularity of thin-client systems makes it important to analyze their performance, to assess the general feasibility of the thin-client computing model, and to compare various thin-client platforms and determine the factors that govern their performance. However, while many thin-client platforms and protocols have been developed, most of these systems and their protocols are proprietary, and few of the vendors have provided detailed performance measurements for their own products or a cross-platform analysis against other vendors products. To assess the viability of the thin-client computing model, we have measured the performance of thin-client computing platforms running over a wide range of network access bandwidths. We have characterized the design choices of underlying remote display technologies and quantified the performance impact of these choices. We considered a range of design choices as exhibited by six of the most popular thin-client platforms in use today: Citrix MetaFrame [5, 14], Microsoft Windows 2000 Terminal Services [6], AT&T Virtual Network Computing (VNC) [22, 32], Tarantella [24, 27], Sun Ray [26, 30], and X [25]. These platforms were chosen for their popularity, performance, and diverse design approaches. We report the first quantitative measurements to examine the performance of such a broad range of thin-client architectures in various network environments. Because many thin-client systems are closed-source and proprietary, we employed slow-motion benchmarking [37], a novel non-intrusive measurement technique that addresses some of the fundamental difficulties in previous studies of thin-client performance. Our results show that thin-client computing can deliver good performance for web and multimedia applications, but performance varies widely among different thin-client platform designs. Our results show that a simple pixel-based remote display approach can deliver superior performance to more complex thin-client systems that are currently popular. We analyze the differences in the underlying mechanisms of various thin-client platforms and explain their impact on overall performance. This paper is organized as follows. Section 2 details the experimental testbed and methodology we used for our study. Section 3 describes our measurements and performance results. Section 4 discusses some related work. Finally, we present some concluding remarks and directions for future work.
2. Experimental DesignThe goal of our research was to compare thin-client systems to assess their basic display performance in various network environments. In our experiments, we used the following six versions of thin-client platforms: Citrix MetaFrame 1.8 for Windows 2000, Windows 2000 Terminal Services, Tarantella Enterprise Express II for Linux, AT&T VNC v3.3.2 for Linux, Sun Ray I for Solaris, and Xfree86 3.3.6 on Linux. In this paper, we also refer to these platforms by their remote display protocols, which are Citrix ICA (Independent Computing Architecture), Microsoft RDP (Remote Desktop Protocol), Tarantella AIP (Adaptive Internet Protocol), VNC, Sun Ray, and X, respectively. As summarized in Table 1, these platforms span a range of differences in the encoding of display primitives, policies for updating the client display, algorithms for compressing screen updates, supported display color depth, and transport protocol used. To evaluate their performance, we designed an experimental testbed and various experiments to exercise each of the thin-client platforms on single-user web-based and multimedia-oriented workloads using slow-motion benchmarking as explained in Section 2.1. Section 2.2 describes the experimental testbed we used. Section 2.3 discusses the application benchmarks used in our experiments.
Table 1: Characteristics of thin-client platforms. 2.1 Measurement MethodologyTo provide a more effective method for evaluating thin-client performance, we previously developed slow-motion benchmarking [37]. We developed this benchmarking technique in order to address the inadequacies in conventional benchmarks in measuring thin-client performance. In thin-client systems, the client display is often decoupled from the server-side application execution. In some systems, the screen updates may be merged or even discarded in order to synchronize the display with the application logic. While these techniques allow the thin server to run the application without being constrained by the slow display update speed, they pose a unique challenge in benchmarking. Standard benchmarks designed for desktop systems cannot be used to provide accurate results when evaluating thin-client systems. Because the benchmark applications are executed on the thin server, independent of the client-side display updates, the benchmarks effectively only measure the servers performance and do not accurately reflect the users experience at the client-side. A video playback benchmark, for example, would measure the frame rate as rendered on the server, but if many of the frames did not reach the client, the frame rate reported by the benchmark would give an exaggerated view of the systems performance. While internal instrumentation may be an effective solution to this problem, many thin-client products are proprietary and closed-source, making it difficult to instrument them and obtain accurate results. Internal instrumentation can also add intrusive processing overhead. In slow-motion benchmarking, we use network packet traces to monitor the latency and data transferred between the client and the server, but we alter the benchmark application by inserting delays between the separate visual events, such as web pages or video frames, so that the display update for each event is fully completed on the client before the server begins processing the next one. Then we process the network packet traces and use these gaps of idle time between events to break up the results on a per-event basis. This allows us to obtain the latency and data transferred for each visual event separately. We can then obtain overall results by taking the sum of these per-event results. The amount of the delay inserted depends on the application workload and platform being tested. The necessary length of delay can be determined by monitoring the network traffic and making the delays long enough to achieve a clearly demarcated period between all the visual events where client-server communication drops to the idle level. This ensures that each visual event is discrete and generated completely. 2.2 Experimental TestbedTo verify our results in a controlled network environment and to provide a basis for comparison, we constructed an isolated network testbed. Our experimental testbed consisted of seven machines, five of which were active for any given test. The testbed consisted of a network emulator machine, a packet monitor machine, two pairs of thin client/server systems, and a web server used for the web benchmark. The network emulator machine was a Micron Client Pro PC with two 10/100BaseT NICs running The Cloud [29], a network emulator that we used to adjust the network bandwidth between the client and server. For our experiments, we considered the performance of thin-client systems over a range of network bandwidths, specifically 128 Kbps, 768 Kbps, 1.5 Mbps, 10 Mbps, and 100 Mbps, corresponding roughly to ISDN, DSL, T1, 10BaseT, and 100BaseT, respectively. The packet monitor machine was a Micron Client Pro PC running Etherpeek 4 [33], a network traffic monitor that we used to obtain the measurements for slow-motion benchmarking. To ensure a level playing field, we used the same client/server hardware for all of our tests except when testing the Sun Ray platform, which only runs on Sun machines. The features of each system are summarized in Table 2. As discussed in Section 3, the slower Sun client and server hardware did not affect the lessons derived from our experiments. Unless otherwise stated, the video resolution of the client was set to 1024x768 with 8-bit color, as this was the lowest common denominator supported by all of the platforms. However, the Sun Ray client was set to 24-bit color, since the Sun Ray display protocol is based on a 24-bit color encoding. By default, compression and memory caching were left on for those platforms that used it, and disk caching was turned off by default in those platforms that supported it. For each thin-client system, we used the server operating system that delivered the best performance for the given system; Terminal Services only runs on Windows. MetaFrame ran best on Windows. Tarantella, VNC, and X ran best on UNIX/Linux, and Sun Ray runs only on Solaris.
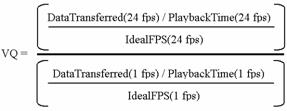
Table 2: Testbed machine configurations. 2.3 Application BenchmarksTo measure the performance of the thin-client platforms, we used two application benchmarks: a web benchmark for measuring web browsing performance, and a video benchmark for measuring video playback performance. The web and video benchmarks were used with the slow-motion benchmarking technique mentioned in Section 2.1 to measure thin-client performance effectively. We describe each of these benchmarks below. 2.3.1 Web BenchmarkThe web benchmark we used was based on the Web Text Page Load test from the Ziff-Davis i-Bench benchmark suite [10]. We first describe the original i-Bench web benchmark and then discuss how it was modified for our experiments. The original i-Bench web benchmark loads a JavaScript-controlled sequence of 54 web pages from the web benchmark server. Normally, as each page downloads, a small script contained in each page starts off the subsequent download. The pages contain both text and bitmap images, with some pages containing more text while others contain more images. Some common elements appear on each page, including a blue left column, a white background, a PC Magazine logo and other small images. The JavaScript cycles through the page loads twice, resulting in a total of 108 web pages being downloaded during this test. When the benchmark is run from a thin client, the thin server would execute the JavaScript that sequentially requests the test pages from the i-Bench server and relay the display information to the thin client. For the web benchmark used in our tests, we modified the original i-Bench benchmarks JavaScript call to introduce delays of several seconds between pages using the JavaScript, sufficient in each case to ensure that the thin client received and displayed each page completely and that there was no temporal overlap in transferring the data belonging to two consecutive pages. We used the packet monitor to record the packet traffic for each page, and then used the timestamps of the first and last packet associated with each page to determine the download time for each page. We used Netscape Navigator 4.72 as the web client for the web benchmark, as it is available on all the platforms in question. The browser's memory cache and disk cache were enabled but cleared before each test run. In all cases, the Netscape browser window was 1024x768 in size, so the region being updated was the same on each system. 2.3.2 Video BenchmarkThe video benchmark program processes and displays an MPEG1 video file containing a mix of news and entertainment programming. We measured video performance by monitoring resulting packet traffic at two playback rates, 1 frames/second (fps) and 24 fps. Although no user would want to play video at 1 fps, we took the measurement at that frame rate in order to establish the reference data size transferred from the thin server to the client that corresponds to a "perfect" playback. To measure the normal 24 fps playback performance and video quality, we monitored the packet traffic delivered to the thin client at this playback rate and compared the total data transferred to the reference data size. The video quality can then be quantified by the ratio of data transfer rate at the full frame rate of 24 fps to the transfer rate at the slow-motion playback rate of 1 fps expressed in percent [37]. The ratio was computed as follows:
For the video benchmark, we used two different MPEG1 players. We used Microsoft Windows Media Player version 6.4.09.1109 for the Windows-based thin clients and MpegTV version 1.1 for the Linux/Solaris-based platforms. Both players were used with non-video portions of the interfaces minimized so that the appearance of the playback application was similar across all platforms. In the minimized mode, accessory components like progress bars, frame counters, or clocks were not displayed. The test video clip was 34.75 seconds long and consisted of 834 352x240 pixel frames with an ideal frame rate of 24 fps. The total video file size was 5.11 MB. The thin server executed the video playback program to decode the MPEG1 video then relayed the resulting display to the client.
3. Experimental ResultsWe ran the web and video benchmarks on each of the six thin-client platforms and measured their resulting performance under five network bandwidths. The web benchmark results are shown both in terms of latencies and the respective amounts of data transferred from server to client to illustrate both the overall user-perceived performance and the bandwidth efficiency of the thin-client systems. The data transferred from client to server was not significant in any of our experiments. Section 3.1 discusses the results obtained for running the thin-client systems with their default configuration options as discussed in Section 2.2. Section 3.2 analyzes the impact of the underlying baseline remote display encodings. Section 3.3 considers the impact of caching and compression mechanisms on thin-client performance. 3.1 Default ConfigurationsThe results of running the web benchmark on each of the thin-client systems with the default settings are shown in Figure 1 through Figure 4. The results of running the video benchmark on each of the thin-client systems are shown in Figure 5 through Figure 8. For comparison purposes, we also show results for using the PC client connected directly through the network emulator to the web and video server to demonstrate the performance of a traditional "fat" client system for web browsing and streaming video, respectively. 3.1.1 Web PerformanceFigure 1 shows the average download latency per page. Usability studies have shown that web pages should take less than one second to download for the user to enjoy an uninterrupted browsing experience [16, 17]. Using this metric, all of the thin-client systems delivered good performance over the 10 Mbps and 100 Mbps LAN bandwidths with average web page latencies well under a second. Using the 100 Mbps bandwidth, X and AIP are the fastest with average web page latencies of less than 300 ms while the other thin-client systems have average latencies of about 500 ms. Figure 1 shows that reducing the bandwidth had the biggest negative impact on X and Sun Ray. In contrast, Citrix ICA, Microsoft RDP, Tarantella AIP, and VNC were able to deliver sub-second average web page latencies over bandwidths as low as 768 Kbps, corresponding to DSL environments. However, none of the thin-client systems were able to deliver sub-second performance at 128 Kbps. Only the PC fat-client achieved sub-second performance across all bandwidths tested. The results indicate that thin-client systems can provide good web browsing performance in broadband or higher bandwidth network environments, but are not yet able to perform well in lower-bandwidth dialup modem and ISDN environments. The web performance of the systems at various bandwidths can be better understood by examining the average amount of data sent per web page shown in Figure 2. Since the visual quality is constant across all bandwidths as a result of slow-motion benchmarking, the amount of data transferred for each platform is also essentially constant across all bandwidths, except for AIP. For AIP, the different data transfer amounts across various bandwidths is caused by adaptive compression mechanisms which we discuss further in Section 3.3.
At higher bandwidths, there is little correlation between the amount of data transferred and the average web page latency. The best performing thin-client systems at the LAN bandwidths were X and AIP, which sent far more data than the lesser performing ICA and VNC. X sent more data than any other thin-client system except Sun Ray at 100 Mbps, yet it achieved the best performance at this bandwidth. At lower bandwidths, however, there is direct correlation between the amount of data transferred and the average web page latency. ICA sends the least amount of data and has the best performance of all the thin-client systems when using the 128 Kbps network environment. As shown in Figure 2, ICA sends on average about 30 KB of data per page, only twice as much data for its display updates compared to using HTTP with a PC fat-client. Figure 3 and Figure 4 show the network bandwidth and client and server CPU utilizations for the web benchmark. The utilization measurements shown do not include the idle time between web pages. Figure 3 shows that the stronger correlation between latency and data transfer efficiency at lower bandwidths is due to the network becoming the main bottleneck. When the average bandwidth utilization exceeds 85 percent, the latency incurred for the thin-client systems generally increases beyond the one-second web page latency threshold. Figure 4 shows the client and server load when using the 100 Mbps network environment. The measurements show that, except for VNC, the clients were not heavily loaded during the web benchmark, indicating that the client CPU was not the primary bottleneck even at high bandwidths. In the case of VNC, the client does not rest much as it is constantly pulling from the server. The CPU utilization for the Sun Ray hardware client is not shown because there were no tools available to measure it. In general, the server CPU was more heavily loaded than the client CPU. AIP, which requires running a web server on the server, had the highest server CPU utilization and appears limited by server speed in a 100 Mbps network environment.
3.1.2 Video PerformanceFigure 5 shows the resulting video quality on each system for various network bandwidth environments. The video quality was quantified using the VQ formula discussed in Section 2.3.2. Unlike the web benchmark performance, several of the thin-client platforms, ICA, RDP, and VNC, deliver poor video quality even in the 100 Mbps network environment. Only X, AIP, and Sun Ray deliver good video quality at the highest bandwidth. None of the platforms deliver reasonable video quality at lower network bandwidths. Figure 5 shows that X, AIP, and Sun Ray all deliver over 90 percent video quality at 100 Mbps, but that even the best of them degrades to only about 50 percent video quality at 10 Mbps. Sun Ray has a special color space convert display primitive that can be used to improve the video playback performance if the application is written to exploit the feature. The MpegTV application we used, however, was not written to do so. No video benchmark data is shown for Sun Ray at 128 Kbps, because Sun Ray could not play the entire clip without interruption due to the limited bandwidth. The PC fat-client provides good video quality even at 1.5 Mbps, but the video quality rapidly deteriorates at lower bandwidths. For all platforms, the video playback time was relatively constant across all bandwidths, taking about 35 seconds to play the entire video clip. The video performance of the various systems at different bandwidths can be better understood by examining the total data transferred. Figure 6 shows the amount of data transferred by each system at the normal playback rate of 24 fps and at the slow-motion playback rate of 1 fps. The 1 fps data transfer measurements show how efficiently each system encoded the display updates when all of the video frames were fully delivered and displayed on the client. Comparing the 24 fps and 1 fps measurements, we see that all of the systems discard data at lower bandwidths to maintain a constant playback rate, resulting in lower video quality. ICA, RDP, and VNC even discard large amounts of data at 100 Mbps. Figure 6 also shows that the thin-client systems that performed the best on the video benchmark were also the least data efficient at encoding the display. AIP and X transferred roughly 70 MB to play back the video clip in 8-bit color and Sun Ray transferred roughly three times that amount to display in 24-bit color. These data transfer rates are comparable to sending raw pixels over the network for each 352x240 pixel frame and more than ten times the transfer rate of MPEG streaming the 5.11 MB clip.
Comparing Figure 7 and Figure 3 shows that the average bandwidth consumption of the thin-client systems when running the video benchmark was much higher than when running the web benchmark. None of the platforms was bandwidth limited at 100 Mbps, even though half of the systems (ICA, RDP, and VNC) delivered poor video quality at that bandwidth. However, all of the three systems (X, AIP, and Sun Ray) that delivered good video quality at 100 Mbps consumed well over 10 Mbps of network bandwidth. As a result, bandwidth limitations were the primary bottleneck for these three systems at lower network bandwidths. For the other systems that failed to perform well even at 100 Mbps, Figure 8 indicates that none of the client or server systems had high CPU load except for VNC. We note that while none of the client and server average utilization measurements reached 100 percent, there was high variability in the system loads with frequent peaks at 100 percent for VNC on the client-side, suggesting that VNC video performance appears to be limited by the clients CPU speed.
Our measurements of thin-client performance on the web and video benchmarks indicate that AIP, X, and Sun Ray are more able to support a broader range of applications, particularly multimedia applications. The results also suggest that thin-client systems such as ICA, RDP, and VNC can be quite bandwidth efficient for web applications, but that these same mechanisms which lead to bandwidth efficiency may degrade the performance in multimedia video applications. 3.2 Baseline Display Encoding PrimitivesTo understand how the underlying design choices in thin-client systems impact their performance, we isolated the effects that can be attributed to the basic display encoding primitives used. Four types of display encoding primitives are high-level graphics, low-level graphics, 2D draw primitives, and raw pixels. Higher-level display encodings are generally considered to be more bandwidth efficient, but may require more computational complexity on the client and may be less platform-independent. For instance, graphics primitives such as fonts require the thin-client system to separate fonts from images while using pixel primitives enable the system to view all updates as just regions of pixels without any semantic knowledge of the display content. X takes a high-level graphics encoding approach and supports a rich set of graphics primitives in its protocol. ICA, RDP, and AIP are based on lower-level graphics primitives that include support for fonts, icons, drawing commands as well as images. Sun Ray and VNC employ 2D draw primitives such as fills for filling a screen region with a single color or a two-color bitmap for common text-based windows. VNC can also be configured to use raw pixel encoding only, but none of the systems we considered used raw pixels by default. To examine the basic display encoding performance, we disabled all configurable caching and compression mechanisms and ran the benchmarks. For AIP, there was no option to disable caching. For VNC, the display compression could not be disabled because it is built into the default hextile display encoding used. For X and Sun Ray, the baseline and default configurations were the same as there were no caching and compression options. For comparison purposes, we also show measurements using the VNC raw pixel encoding (RAW), which essentially encodes display updates as just raw pixels. The caching and compression options for each platform are discussed in further detail in Section 3.3. Due to space constraints, and since performance at lower network bandwidths is strongly correlated with bandwidth efficiency, we simply present latency and data transfer measurements for experiments at 100 Mbps to illustrate the baseline display encoding performance for the various approaches. 3.2.1 Web PerformanceFigure 9 and Figure 10 show the latency and data transfer
measurements for the baseline performance of the thin-client systems running the
web benchmark. In particular, we show results for running two versions of the
web benchmark: one with all of the images displayed normally, and one with just
text in which all of the images were removed and replaced with blank spaces of
equal size. We employed both versions to compare how different thin-client
mechanisms perform on graphics versus text-oriented media. The more interesting measurements are in Figure 10, which shows the average data transferred per web page at the baseline settings. Comparing with RAW, the results show that all of the other display encodings used are substantially more bandwidth efficient than sending raw pixels, in some cases by more than an order of magnitude. ICA, RDP, and AIP all send about the same amount of data, which is consistent with the fact that they all employ low-level graphics display encoding primitives. X, which employs the higher-level graphics primitives, surprisingly sends the most data among all the 8-bit color thin-client systems. Although both VNC and Sun Ray use 2D draw primitives, the amount of data sent in each case is quite different. While the VNC display encoding appears the most data efficient, it includes built-in compression so comparing its efficiency with the other systems without compression is not a fair comparison. On the other hand, Sun Ray uses 24-bit color, so comparing its efficiency with other 8-bit systems is not entirely fair either.
To account for the impact of different color depths on display encoding efficiency, we also measured the performance of X and VNC using 24-bit color, as these were the only platforms we used that could operate using either 8-bit or 24-bit color depth. As shown in Figure 10, both X and VNC send roughly three times as much data using 24-bit color as opposed to using 8-bit color. This suggests that to fairly compare Sun Ray with the other 8-bit color results, we should normalize the amount of data transferred by the pixel color depth, which would effectively reduce the amount of data Sun Ray transferred by a factor of three. The normalized Sun Ray data transfer measurements would then be better than X and only about 20 percent worse than ICA. Surprisingly, the use of simple 2D draw primitives results in data transfer requirements better than the high-level graphics X approach and not much different from the low-level graphics approach used by ICA, RDP, and AIP. Furthermore, Figure 9 shows that Sun Ray performs somewhat better than the 8-bit color ICA and RDP platforms despite providing a higher quality 24-bit color display. Figure 9 and Figure 10 also show the latency and data transfer measurements for the performance of the thin-client systems running the text-only version of the web benchmark. These results suggest that the higher-level display encodings are more optimized to reduce the data transfer requirements of text content as opposed to image content. Figure 10 shows that the higher-level encodings used by ICA, RDP, AIP, and X were much more bandwidth efficient for text than the lower-level encodings used by Sun Ray and VNC. In particular, RDP reduced the amount of data sent for text to less than five percent of that for both images and text. Despite the large bandwidth savings for text content, the higher-level encoding systems do not provide the same degree of reduction in latency, as shown in Figure 9. Instead, Sun Ray demonstrates the largest percentage reduction in web page download latency despite having the smallest percentage reduction in the amount of data transferred when comparing image and text content to text-only content. This again demonstrates that at a high enough bandwidth, the encoding overhead rather than the amount of data generated is the primary factor in determining the performance. 3.2.2 Video PerformanceFigure 11 and Figure 12 show the video quality and data transfer measurements for the baseline performance of the thin-client systems. The video quality results shown in Figure 11 for the baseline display encoding configuration are quite similar to the results for the default configuration discussed in Section 3.1.2. All of the systems performed much better than RAW, which yielded poor video quality of less than 15 percent. X, AIP, and Sun Ray still deliver good video quality while ICA, RDP, and VNC deliver noticeably worse video quality. Although the video quality for ICA and RDP are similar to their respective performance with the default configurations, Figure 12 shows that they send roughly twice as much data when just using the basic display encoding. To account for the impact of different color depths on display encoding efficiency, we again measured the performance of X and VNC using 24-bit color as well. As expected, both platforms send substantially more data using 24-bit color versus using 8-bit color. In addition, Figure 11 shows that when using 24-bit color, the video quality of VNC remains poor and the video quality of X decreases down to about 65 percent. When comparing among the 24-bit color platforms, Sun Ray clearly delivers the best video quality.
An important lesson derived from the default and baseline video benchmark results is that the timing of display update can be just as important as how a display update is encoded. X, AIP, and Sun Ray employing an eager server-push display update model excelled in the video benchmark at 100 Mbps. AIP also uses a lazy model to adapt to lower bandwidths. When a rendering command is generated by the application, these thin-client systems immediately convert that command to the underlying display encoding primitives and send the display update to the client. The eager updates enable the server to keep up with the video applications rendering commands and allow the server to take advantage of any semantic information that can be used from the rendering command. In contrast, ICA, RDP, and VNC employ a lazy display update model, in which multiple rendering commands are first buffered and then later merged before lazily sending the merged display updates to the client. For ICA and RDP, the updates are lazily sent at a server-defined rate. The problem is that the updates are not sent frequently enough for real-time video display, resulting in multiple video frames being merged and overwritten at the server and never displayed at the client. For VNC, the updates are lazily sent when the client requests them. Since the client running VNC is already heavily loaded, the client becomes a bottleneck in requesting the display updates, resulting in lost video frames that are merged and overwritten at the server before the client is able to generate the next display request. 3.3 Caching and CompressionFour of the six thin-client platforms tested employ some form of configurable caching or compression to improve system performance. ICA and RDP both employ run-length encoding compression and cache fonts and bitmaps in memory and on disk at the client. AIP also employs local client caching of display objects and uses an adaptive mechanism to progressively enable higher-degrees of compression as the availability of network bandwidth becomes limited. VNC has RLE compression built-in with its display encoding format and employs a very simple form of on-screen caching whereby the client can simply copy display data from one portion of the screen to another rather than requesting it from the server if the display data is already displayed on another portion of the framebuffer. To examine the performance impact of caching and compression techniques, we measured the performance of the thin-client systems on the web and video benchmarks with various caching and compression configuration settings. We show results for ICA, RDP, AIP, and VNC. In Section 3.3.1 and 3.3.2, we compare four configurations: (1) the baseline results from Section 3.2 with all caching and compression options disabled, (2) all compression only options enabled, (3) all caching only options enabled, and (4) all caching and compression options enabled. In particular, for ICA and RDP which support both memory and disk caching, we enabled or disabled both caches together. In Section 3.3.3, we explore the disk and memory caching options of ICA separately in further detail. For AIP, there was no option to disable caching as mentioned in Section 3.2, so the AIP cache only and baseline and cases are the same and there was no compression only configuration tested. For VNC, the compression cannot be separately configured as it is part of the default hextile encoding used, so the VNC baseline and compression only cases are the same and there was no cache only configuration tested. Figure 13 through Figure 16 show the latency and data transfer measurements for running the web benchmark relative to the baseline performance of each system as reported in Section 3.2.1. We again show results for running the normal web benchmark with both images and text and the text-only version of the web benchmark. Figure 17 and Figure 18 show the video quality and slow-motion 1 fps data transfer measurements for running the video benchmark relative to the baseline performance of each system as reported in Section 3.2.2. 3.3.1 Web PerformanceFigure 13 shows that using 100 Mbps bandwidth, there is no significant performance benefit due to caching and compression options in most of the thin-client systems. The most notable difference occurs for ICA with caching enabled. Surprisingly, enabling ICAs cache increases the average web page latency by almost 40 percent over the baseline performance. Figure 14 shows that there was a substantial difference in the amount of data transferred for almost all platforms for different caching and compression options. For all three platforms, ICA, RDP, and AIP, for which compression could be enabled or disabled, enabling compression resulted in a substantial reduction in the amount of data transferred, at least a factor of two in all cases. It must be noted that the effect of AIPs compression could not be isolated and directly compared with those of RDP and ICA, because its cache could not be disabled. But AIP seems to have a large reduction in data transfer when its compression is engaged, which is most likely due to its use of both RLE and LZW compression as opposed to using only RLE compression for ICA and RDP. AIP, however, was adversely affected by the added processing overhead of using cache and compression at 100 Mbps. When compression was enabled, the latency increased by 13%. At higher bandwidths, where the network is not the bottleneck, it may be advantageous to reduce the processing overhead by holding back on compression even if it results in a larger amount of data. Since performance at lower bandwidths is directly related to the amount of data transferred, compression is beneficial for improving performance at lower bandwidths.
Caching is also not always beneficial. Among the systems that provided the option to enable or disable caching, Figure 14 shows that enabling caching results in the largest reduction in data transferred for ICA. ICA shows almost a factor of three reduction in data transfer for just using caching, and yet results in a significant increase in the average web page latency. In other words, the overhead of ICA caching outweighs its benefits in high bandwidth network environments. On the other hand, using caching with RDP and VNC resulted in very little difference in either latency or data transferred versus not using caching. For VNC, the on-screen cache contains only the current display data which does not provide sufficient history to be beneficial in reducing the amount of data that the server needs to send. However, the ineffectiveness of the cache for RDP is more surprising as its caching architecture is similar to ICA on the surface. Our results indicate that RDPs caching mechanism may not be operating correctly at best or poorly designed at worst. Figure 14 and Figure 16 show that there was no reduction in data size due to RDPs disk cache. Figure 15 and Figure 16 show the latency and data transfer measurements for various combinations of caching and compression for the thin-client systems running the text-only web benchmark. The results for running the text-only benchmark were generally similar to those for the normal web benchmark with both text and images. These results suggest that the caching and compression mechanisms have similar advantages and disadvantages for both the image and text content of the web benchmark. The one exception was for using caching with ICA. With the text-only content, the performance did not degrade when ICAs caching was engaged as we saw with both text and images.
3.3.2 Video PerformanceFigure 17 shows the video quality measurements for various combinations of caching and compression for the thin-client systems running the video benchmark at 100 Mbps. For RDP and VNC, there was little difference in the video quality for the various options. For ICA, the biggest difference again appeared with the use of caching, which resulted in a substantial decrease in video quality from roughly 50 percent to less than 5 percent. For AIP, the use of compression reduced the VQ from over 90 percent to less than 30 percent. Figure 18 shows the 1 fps data transfer measurements for various combinations of caching and compression for the thin-client systems running the video benchmark. These measurements provide a quantitative comparison of the amount of data each system transferred when sending all of the video content to the client without discarding data. Just as for the web benchmark, for all three platforms, ICA, RDP, and AIP, for which compression could be enabled or disabled, enabling compression resulted in a substantial reduction in the amount of data. The data reduction was generally not as large for the video benchmark as for the web benchmark, reflecting the fact that the video content was not as compressible as the web content. More importantly, enabling compression can have a detrimental impact on video performance at LAN bandwidths, as in the case of AIP. Compression, however, could yield some benefit at lower bandwidths due to its ability to reduce the amount of data transferred. Unlike the other thin-client systems, AIP employs an adaptive mechanism for enabling compression that turns compression off at high bandwidths and on at low bandwidths. Our results suggest that an adaptive mechanism for enabling compression at lower bandwidths is useful in trading off compression overhead versus bandwidth savings at different bandwidths.
As in the case of the web benchmark, caching did not consistently reduce the amount of data transferred for the video benchmark. Among the systems that provided the option to enable or disable caching, Figure 18 shows that enabling caching reduced the amount of data transferred for ICA, but had no impact on the amount of data transferred for RDP or VNC. Just as with the web benchmark, the video benchmark results indicate that the overhead of ICA caching outweighs its benefits in high bandwidth network environments. 3.3.3 Memory versus Disk CachingThin-client systems may implement a hierarchical caching architecture with multiple levels of cache. In ICA, two forms of client caching are applied to improve the performance: caching in client memory and caching in client disk. These two forms of caching may have very different characteristics. Memory caching can provide much faster access times to smaller caches while disk caching can provide larger amounts of local cache with relatively slower access times. ICA provides both memory and disk caching as well as the ability to enable and disable each cache independently. We investigated the impact of memory and disk caching techniques by running the web and video benchmarks using ICA with various cache configurations. We considered all possible combinations of memory and disk caching, both with and without compression enabled. For the ICA disk cache, the maximum cache space and the minimum cacheable bitmap size are user-configurable. For our tests, the disk cache size was set to 39 MB, and the minimum cacheable bitmap size to 8KB. The memory cache size was 8 MB. These disk and memory cache settings were default in the ICA client.
Figure 19 through Figure 22 show the performance of ICA with various cache and compression combinations available for ICA. As discussed in Section 2.3.1, the web benchmark cycles through 54 web pages twice. We call the first iteration Run1 and the second Run 2. In order to highlight the effects of caching and compression, we present the performance relative to the baseline configuration as well as the performance ratio of Run 2 to Run 1. If enough elements are cached while displaying the content from Run 1, we would expect the Run 2 to produce less data transferred from server to client and potentially yield a better performance. Also, if some elements are displayed repeatedly within the 54-page iteration, then we would expect the transferred data amount to decrease in Run 1 as well as Run2. While there is no tool available to us to directly measure the cache hit/miss rate reliably for ICA, it would be reasonable to assume the ratio of data transferred from the server to the client with cache turned on to that with cache off provides a rough measure of the cache miss rate. As shown in Figure 20, Run 1 of the benchmark run at 100 Mbps with disk cache on produced 77% of the data generated by Run 1 with the baseline configuration. That is, the client was forced to fetch 77% of the total display data from the server even with the disk cache on, presumably because the data wasnt found in the local cache. In Run 2, however, the data ratio drops to 48%. As expected, more data was found in the local cache in Run 2. Inferring from Figure 2, the first iteration of 54 pages would yield only 1.6 MB of data, which would fit well within the cache. However, not all of the elements were cached even though the 39 MB disk cache had enough capacity to store all objects encountered in Run 1. In particular, the bitmap objects smaller than 8 KB were not cacheable per the disk cache setting we used. Comparing the relative data size and latency between Run 1 and Run 2, it is evident that the memory cache serves to handle small elements, while the disk cache is used for caching large bitmaps. Figure 19 shows that there is less significant improvement in latency in Run 2 compared to Run 1 with memory cache engaged. Figure 20 shows that there is almost no difference in data size between Run 1 and Run 2. While small graphical elements appear repeatedly throughout each cycle of 54 web pages, the large bitmaps seen in Run 1 only reappear when the same web page reappears in Run 2. If the memory cache cached larger objects, then we would expect to see a significant change in Run 2 compared to Run 1. With disk caching, however, we do observe such a change. The difference in the types of objects cached caused the two methods of cache to yield very different performance characteristics in our tests. A notable finding was that, at 100 Mbps, ICA performed worse whenever the disk cache was engaged even though the cache significantly reduced the amount of transferred data. As shown in the web benchmark results in Figure 19, the increase in latency with disk caching, relative to the baseline setting, was almost by a factor of two in Run 1. In Run 2, there was a slight improvement in performance with the disk cache engaged, but when accounting for both Run 1 and Run 2, there was 44% higher latency overall. These data suggest there is a heavy cache-miss penalty associated with ICAs disk caching. At a high bandwidth like 100 Mbps, the amount of time required to look up the cache becomes significant relative to the network access time. Figure 21 shows that the performance degradation due to disk caching does not occur in displaying text-only content, except when disk caching is used in combination with compression. The disk cache is primarily utilized for storing large bitmap objects. In the text-only test, no bitmap image is displayed during the benchmark run; therefore, we would expect the disk cache to have little to no effect. As seen in Figure 22, the disk cache does not contribute to any decrease in data size. We note that, in general, the data size increases slightly in Run 2 of the text-only tests compared to Run 1, because Netscape for Windows, with its own cache engaged, behaves slightly differently in Run 2 compared to Run 1 in terms of the way the page is drawn. Memory caching, on the other hand, introduced no performance degradation. As shown in Figure 19, in both Run 1 and Run 2, the latency with memory cache engaged was less than the baseline latency. Figure 20 shows the transferred data size was roughly reduced to half relative to baseline. Although each of the 54 web pages is displayed for the first time in Run 1, there are fonts, text, and small graphical elements (like the PC Magazine logo) that are repeated many times. With disk caching, any benefit in caching the repeated graphical elements was overwhelmed by the penalty in looking up the cache on the hard drive. The cache-miss penalty associated with the memory cache is much less severe. The lower thin-client performance with disk caching is due to the relative speed of the network compared with the disk and the penalty associated with cache misses. In a 100 Mbps LAN environment, the network speed is almost comparable in speed and bandwidth to the sustained performance of the local disk of our client machine. Consequently, obtaining display data from the disk cache is not necessarily faster than obtaining the data from the server across the 100 Mbps network. In addition, with disk caching enabled, each disk cache miss requires the client to access the local disk as well as obtain the display data across the network. If local disk and network speeds were comparable, a cache miss would result in roughly twice as much latency as when the data were simply sent from the server without any disk caching. Figure 23 compares the performance of ICA at various network bandwidths with the default configuration settings versus the same settings except with the disk cache enabled. The results show that while disk caching adversely affects ICA performance at higher network bandwidths, it improves ICA performance at bandwidths below 768 Kbps. At low enough network bandwidths, the disk access time becomes insignificant relative to the network access time such that it is much faster to fetch data from the client disk cache than going across the network to the server. For lower bandwidth networks, assuming reasonable cache hit rates, the benefit of smaller disk cache latencies on cache hits outweigh the penalty of extra disk cache latencies incurred on cache misses.
4. Related WorkSeveral studies have been conducted to evaluate thin-client computing architectures. Danskin conducted an early study of the X protocol [7] by gathering traces of X requests. Citrix and Microsoft have conducted internal performance testing of their products. Microsoft has examined thin-client scalability issues in Terminal Services performance for the purposes of capacity planning [15]. Schmidt, Lam, and Northcutt examined the performance of the Sun Ray platform in comparison to the X protocol [26]. Wong and Seltzer have studied the performance of Windows NT Terminal Server and LBX [34, 35]. Tolly Research has conducted similar studies for Citrix MetaFrame [31]. Howard has measured the performance of various hardware thin clients using the i-Bench benchmark suite [9], but his results suffer from methodology problems due to only measuring server-side application performance instead of user-perceived client-side performance. We have also conducted earlier studies of thin-client performance [18, 19, 36, 37], including previously developing the slow-motion benchmarking [37] used in this paper. Some of these studies have examined selected thin-client systems in detail via internal instrumentation. However, no study considered the performance of remote display mechanisms across the broad range of systems, system configurations, and network bandwidths discussed here. We have also further considered the performance of thin-client systems in wide-area network environments [12]. In addition to the thin-client systems discussed in this paper, a number of other systems for remote display have been developed. These include extensions to the systems considered such as low-bandwidth X (LBX) [1] and Kaplinsk's recent VNC tight encoding [11] as well as remote access solutions such as Laplink [13] and PC Anywhere [20]. Because of space constraints and previous work [18, 19] showing that LBX, Laplink, and PC Anywhere perform very poorly, we did not include them in this study. While thin-client systems have primarily been employed in LAN environments, a growing number of ASPs are employing thin-client technology to host desktop computing sessions that are remotely delivered over WAN environments. Examples include services from Charon Systems [3], Runaware [23], and Expertcity [8].
5. Conclusions and Future WorkOur results show that thin-client systems can provide good performance for web and multimedia applications in LAN environments. Unlike traditional PC software environments, our results show that different thin-client system designs exhibit widely varying performance that can differ by orders of magnitude in some cases. Through our experiments, we have analyzed various design choices underlying current thin-client systems. Specifically, our measurements show three important conclusions regarding thin-client system design. First, higher-level graphics display primitives are not always more bandwidth efficient than lower-level display encoding primitives. X, which uses high-level graphics encoding consumed the most bandwidth in rendering the display at 8-bit color. Furthermore, higher-level primitives are often more optimized for text-oriented content, which will likely become a smaller and smaller percentage of display content as multimedia applications become increasingly popular. Second, the timing in sending display updates from the server to the client can be as important as how display updates are encoded. Our results indicate that an eager server-push model as used in X and Sun Ray provides better overall performance than lazy update models like ICA, RDP, and VNC, especially for multimedia video applications. While lazy update models may lead to some bandwidth savings by discarding or merging display updates, our results show that these techniques for optimizing bandwidth efficiency degrade the performance of multimedia applications even in high bandwidth environments. Third, display caching and compression are techniques which should be used with care as they can help or hurt thin-client performance. At higher bandwidths, ICA displayed significant performance degradation when caching was engaged, and AIP slowed down when its compression was forced on. Our results with current thin-client systems suggest that existing compression techniques provide a greater performance benefit than current caching mechanisms. Furthermore, adaptive use of these mechanisms based on the availability of network bandwidth as shown by AIP produces a good balance between the computational overhead of these encoding mechanisms and the potential bandwidth savings that they provide. In general, cutting down the processing time is desirable when there is enough network bandwidth, while reducing the amount of transferred data is beneficial at lower network speeds. Our results quantify the effectiveness of a number of thin-client design and implementation choices across a broad range of thin-client platforms and network environments. In doing so, we provide the first comparative analysis of the performance of these systems. These measurements provide a basis for future research in developing more effective thin-client systems.
6. AcknowledgmentsThis work was supported in part by an NSF CAREER Award, NSF grant EIA-0071954, and National Semiconductor. We thank Naomi Novik for developing the scripts for processing the raw benchmark data and Brian Schmidt for helpful comments on earlier drafts of this paper.
7. References1. "Broadway / X Web FAQ", http://www.broadwayinfo.com/bwfaq.htm. 2. M. Chapman, http://www.rdesktop.org. 3. Charon Systems, http://www.charon.com. 5. "Citrix ICA Technology Brief", Technical White Paper, Boca Research, Boca Raton, FL, 1999. 7. J. Danskin and P. Hanrahan, "Profiling the X Protocol", Proceedings of the SIGMETRICS Conference on Measurement and Modeling of Computer Systems, Nashville, TN, May 1994. 8. "DesktopStreaming Technology and Security", Expertcity White Paper, Expertcity.com, Santa Barbara, CA, 2000. 9. B. Howard, "Thin Is Back", PC Magazine, 19(7), Ziff-Davis Media, New York, NY, July 2000. 10. i-Bench version 1.5, Ziff-Davis, Inc., http://www.etestinglabs.com/benchmarks/i-bench/i-bench.asp. 11. C. Kaplinsk, "Tight encoding", http://www.tightvnc.com/compare.html. 12. A. Lai and J. Nieh. "Limits of Wide-Area Thin-Client Computing", Proceedings of the SIGMETRICS Conference on Measurement and Modeling of Computer Systems, Marina del Rey, CA, June 2002. 13. "LapLink 2000 User's Guide", LapLink.com, Inc., Bothell, WA, 1999. 14. T. W. Mathers and S. P. Genoway, Windows NT Thin Client Solutions: Implementing Terminal Server and Citrix MetaFrame, Macmillan Technical Publishing, Indianapolis, IN, Nov. 1998. 15. "Windows 2000 Terminal Services Capacity Planning", Technical White Paper, Microsoft Corporation, Redmond, WA, 2000. 16. J. Nielsen, Multimedia and Hypertext: The Internet and Beyond, Morgan Kaufmann, San Francisco, CA, Jan. 1995. 17. J. Nielsen, Designing Web Usability, New Riders Publishing, Indanapolis, IN, 2000. 18. J. Nieh and S. J. Yang, "Measuring the Multimedia Performance of Server-Based Computing", Proceedings of the 10th International Workshop on Network and Operating System Support for Digital Audio and Video, Chapel Hill, NC, June 2000. 19. J. Nieh, S. J. Yang, and N. Novik, "A Comparison of Thin-Client Computing Architectures", Technical Report CUCS-022-00, Department of Computer Science, Columbia University, November 2000. 20. PC Anywhere, http://www.symantec.com/pcanywhere. 21. Personable.com, http://www.personable.com. 23. Runaware.com, http://www.runaware.com. 24. "Tarantella Web-Enabling Software: The Adaptive Internet Protocol", SCO Technical White Paper, Santa Cruz Operation, Dec. 1998. 27. A. Shaw, K. R. Burgess, J. M. Pullan, and P. C. Cartwright, "Method of Displaying an Application on a Variety of Client Devices in a Client/Server Network", US Patent US6104392, Aug. 2000. 28. B. Shneiderman, Designing the User Interface: Strategies for Effective Human-Computer Interaction, 2nd edition, Addison-Wesley, Reading, MA, 1992. 29. "The Cloud", Shunra Software, http://www.shunra.com. 30. "Sun Ray 1 Enterprise Appliance", Sun Microsystems, http://www.sun.com/products/sunray1. 32. Virtual Network Computing, http://www.uk.research.att.com/vnc. 33. WildPackets, Inc., Etherpeek 4, http://www.wildpackets.com. 34. A. Y. Wong and M. Seltzer, "Evaluating Windows NT Terminal Server Performance", Proceedings of the 3rd USENIX Windows NT Symposium, Seattle, WA, July 1999, pp. 145-154. 36. S. J. Yang and J. Nieh, "Thin Is In", PC Magazine, 19(13), Ziff-Davis Media, New York, NY, July 2000.
| |||||||||||||||||||||||||||||||||||||||||||||||||||||||||||||||||||||||||||||||||||||||||||||||||||||||||||||||||||||||||||||||||||||||||||||||||||
|
This paper was originally published in the
Proceedings of the 2002 USENIX Annual Technical Conference, June 10-15, 2002, Monterey Conference Center, Monterey, California, USA.
Last changed: 16 May 2002 ml |
|