| access | chown | fchdir | getaudit | login | mmap | pipe | setaudit | setpgrp | su |
| audit | close | fchown | getmsg | logout | munmap | putmsg | setegid | setrlimit | sysinfo |
| audition | creat | fcntl | ioctl | lstat | nice | readlink | seteuid | setuid | unlink |
| chdir | execve | fork | kill | memcntl | open | rename | setgid | stat | utime |
| chmod | exit | fork1 | link | mkdir | pathdonf | rmdir | setgroups | statvfs | vfork |
First we implemented intrusion detection solely based on normal program behavior. In order to ensure that all possible normal program behaviors are included, a large training data set is preferred for anomaly detection. On the other hand, a large training data set means large overhead in using a learning algorithm to model program behavior. There are 5 simulation days that were free of attacks during the seven-week training period. We arbitrarily picked 4 of them for training, and used the fifth one for testing. Our training normal data set consists of 606 distinct processes running on the victim Solaris machine during these 4 simulation days. There are 50 distinct system calls observed from the training data set, which means each process is transformed into a vector of size 50. Table 2 lists all the 50 system calls.
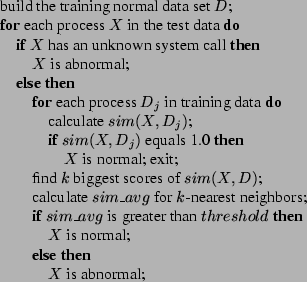
Once we have the training data set for normal behavior, the kNN text categorization method can be easily adapted for anomaly detection. We scan the test audit data and extract the system call sequence for each new process. The new process is also transformed to a vector with the same weighting method. Then the similarity between the new process and each process in the training normal process data set is calculated using Equation (3). If the similarity score of one training normal process is equal to 1, which means the system call frequencies of the new process and the training process match perfectly, then the new process would be classified as a normal process immediately. Otherwise, the similarity scores are sorted and the k nearest neighbors are chosen to determine whether the new program execution is normal or not. We calculate the average similarity value of the k nearest neighbors (with highest similarity scores) and set a threshold. Only when the average similarity value is above the threshold, is the new process considered normal. The pseudo code for the adapted kNN algorithm is presented in Figure 1.
|
In intrusion detection, the Receiver Operating Characteristic (ROC) curve is usually used to measure the performance of the method. The ROC curve is a plot of intrusion detection accuracy against the false positive probability. It can be obtained by varying the detection threshold. We formed a test data set to evaluate the performance of the kNN classifier algorithm. The BSM data of the third day of the seventh training week was chosen as part of the test data set (none of the training processes was from this day). There was no attack launched on this day. It contains 412 sessions and 5285 normal processes. The rest of the test data set consists of 55 intrusive sessions chosen from the seven-week DARPA training data. There are 35 clear or stealthy attack instances included in these intrusive sessions (some attacks involve multiple sessions), representing all types of attacks and intrusion scenarios in the seven-week training data. Stealthy attacks attempt to hide perpetrator's actions from someone who is monitoring the system, or the intrusion detection system. Some duplicate attack sessions of the types eject and warezclient were skipped and not included in the test data set. When a process is categorized as abnormal, the session that the process is associated with is classified as an attack session. The intrusion detection accuracy is calculated as the rate of detected attacks. Each attack counts as one detection, even with multiple sessions. Unlike the groups who participated in the 1998 DARPA Intrusion Detection Evaluation program [20], we define our false positive probability as the rate of mis-classified processes, instead of mis-classified sessions.
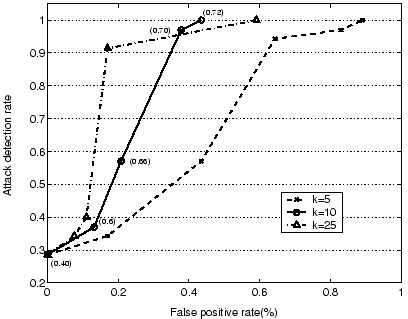
The performance of the kNN classifier algorithm also depends on the value of k, the number of nearest neighbors of the test process. Usually the optimal value of k is empirically determined. We varied k's value from 5 to 25. Figure 2 shows the ROC curves for different k values. For this particular data set, k=10 is a better choice than other values in that the attack detection rate reaches 100% faster. For k=10, the kNN classifier algorithm can detect 10 of the 35 attacks with zero false positive rate. The detection rate reaches 100% rapidly when the threshold is raised to 0.72 and the false positive rate remains as low as 0.44% (23 false alarms out of 5285 normal processes) for the whole simulation day.
The RSTCORP group gave good performance during the evaluation of the 1998 DARPA BSM data [20]. By learning normal sequences of system calls for more than 150 programs, their Elman neural networks [8] were able to detect 77.3% of all intrusions with no false positives, and 100% of all attacks with about 10% miss-classified normal sessions, which means 40 to 50 false positive alarms for a typical simulation day with 500 sessions. Their test data consisted of 139 normal sessions and 22 intrusive sessions. Since different test data sets were used, it is difficult to compare the performance of our kNN classifier with that of the Elman networks. Although the kNN classifier has lower attack detection rate at zero false positive rate, the attack detection rate reaches 100% quickly, and hence a low false alarm frequency can be achieved.