|
OSDI '04 Paper
[OSDI '04 Technical Program]
Configuration Debugging as Search: Finding the
Needle in the Haystack
Andrew Whitaker, Richard S. Cox, and Steven D. Gribble
University of Washington
{andrew,rick,gribble}@cs.washington.edu
Abstract
This work addresses the problem of diagnosing configuration errors
that cause a system to function incorrectly. For example, a change to
the local firewall policy could cause a network-based application to
malfunction. Our approach is based on searching across time for the
instant the system transitioned into a failed state. Based on this
information, a troubleshooter or administrator can deduce the cause of
failure by comparing system state before and after the failure.
We present the Chronus tool, which automates the task of searching for
a failure-inducing state change. Chronus takes as input a
user-provided software probe, which differentiates between working and
non-working states. Chronus performs ``time travel'' by booting a
virtual machine off the system's disk state as it existed at some
point in the past. By using binary search, Chronus can find the fault
point with effort that grows logarithmically with log size. We
demonstrate that Chronus can diagnose a range of common configuration
errors for both client-side and server-side applications, and that the
performance overhead of the tool is not prohibitive.
1 Introduction
Continual change is a fact of life for software systems. For desktop
machines, users can install new applications, apply software upgrades,
change security policies, and alter system configuration options.
Servers and other infrastructure services are also subject to frequent
changes in functionality and administrative settings.
The ability to change is what gives software its vibrancy and
relevance. At the same time, change has the potential to disrupt
existing functionality. For example, software patches can
break existing applications [5]. Seemingly
unrelated applications can conflict - for example, by corrupting
Windows registry keys or shared configuration options. Changes to
security policies, while often necessary to respond to emerging
threats, can disrupt functionality. For server-side applications,
administrator actions and other "operator
errors" [17] are a substantial contributor to overall
downtime.
In most cases, these change-induced failures are diagnosed by human
experts such as system administrators. This approach suffers on a
variety of fronts: trained experts are expensive, they are in short
supply, and they are faced with escalating system complexity and
change. In consequence, system administrative costs are approaching
60-80% of the total cost of ownership of information
technology [12].
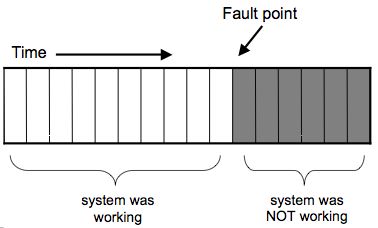 Figure 1: Searching through time for a configuration
error: Chronus reveals configuration errors by pinpointing the
instant in time the system transitioned to a failed state.
The goal of this work is to reduce the burden on human experts by
partially automating problem diagnosis. In particular, we
analyze the applicability of search techniques for diagnosing
configuration errors. Our insight is that although computers cannot
compete with human intuition, they are very effective at exploring a
large configuration space. Our diagnosis tool, which we call Chronus,
uses search to identify the specific time in the past when a system
transitioned from a working to a non-working state, as shown in
Figure 1. Using this information, an administrator can
more easily diagnose why the system stopped working, for example, by
comparing the file system state immediately before and after the fault
point to determine the configuration change that "broke" the system.
Figure 1: Searching through time for a configuration
error: Chronus reveals configuration errors by pinpointing the
instant in time the system transitioned to a failed state.
The goal of this work is to reduce the burden on human experts by
partially automating problem diagnosis. In particular, we
analyze the applicability of search techniques for diagnosing
configuration errors. Our insight is that although computers cannot
compete with human intuition, they are very effective at exploring a
large configuration space. Our diagnosis tool, which we call Chronus,
uses search to identify the specific time in the past when a system
transitioned from a working to a non-working state, as shown in
Figure 1. Using this information, an administrator can
more easily diagnose why the system stopped working, for example, by
comparing the file system state immediately before and after the fault
point to determine the configuration change that "broke" the system.
1.1 Existing Approaches
In this work, we focus on automated problem diagnosis. For the sake
of completeness, we briefly survey other approaches, arguing that the
approach embodied by Chronus represents an advance for a significant
class of configuration errors.
The best approach to dealing with configuration errors is
prevention. Unfortunately, the complexity of today's systems
makes it difficult to reason a priori about all possible side
effects of a configuration change. One problem is that modern systems
are built from components from many vendors, and there are few
global mechanisms that are capable of understanding the effects of
configuration changes in the large. The situation is further
exacerbated by the inadequacy of analysis tools. For example,
determining whether a software patch results in "equivalent"
system behavior is intractable.
Recovery tools such as Windows XP
Restore [24] create occasional state checkpoints,
allowing users to "undo" [8] the effects of bad
configuration changes. While effective in some situations, this
approach faces several limitations. First, it requires the user to
choose an appropriate state snapshot, which assumes that some form of
problem diagnosis has already occurred. Second, recovery itself can
corrupt system state, either by undoing "good" changes or restoring
"bad" changes. Problem diagnosis in Chronus does not modify system
state, and can therefore be safely employed in more situations.
Expert system diagnosis tools have a similar goal as Chronus,
in that they attempt to map from symptoms to a root cause. A widely
used (though rudimentary) example is the Windows "Help and Support
Center." Expert systems typically rely on a static rule database, and
are therefore only effective for known configuration errors.
Arguably, known configuration errors would be better handled by
improvements in software design or user interface. In addition, as
systems grow more complex, static rule databases grow increasingly
incomplete.
When all else fails, the last recourse is manual diagnosis by an
expert. People have intuition and experience, letting them reason
about unexpected situations. Unfortunately, human resources are
scarce and costly, and mastering the complexity of today's software
systems represents a significant hurdle to effective diagnosis.
1.2 The Chronus Approach
Chronus is a troubleshooting tool whose goals are to simplify the task
of diagnosing a configuration error and to reduce the need for costly
human expertise. Rather than requiring troubleshooters to answer the
difficult question "why is the system not working," our tool instead
requires them to supply a software probe (i.e., a
script or program) that answers the simpler question "is the
system currently working?" Given a probe, Chronus searches through
time for the instant that the system transitioned from a working to a
non-working state. As we will demonstrate, many common configuration
errors can be diagnosed with simple shell scripts.
Chronus relies on several components. A time-travel
disk [25] captures the progression of the system's
durable state over time by logging disk block writes. Chronus uses
the mDenali virtual machine monitor [35] to
instantiate, boot, and test historical snapshots of the system,
including the complete operating system and application state.
Chronus executes the user-supplied software probe to test whether a
given historical state works correctly. Finally, Chronus relies on a
search strategy to efficiently educe the failure-inducing state
change from a large sequence of historical states. In many cases,
Chronus can use binary search, allowing for diagnosis time that scales
logarithmically with log length.
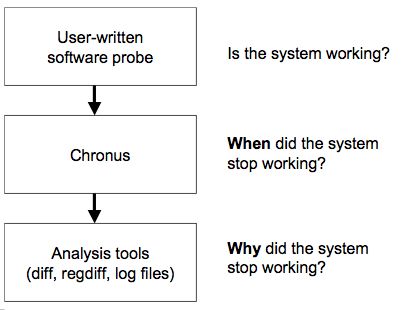 Figure 2: A Chronus debugging session:
Given a user-supplied software probe, Chronus reveals when the system
began failing. Based on this information, it is possible to
understand the cause of failure using higher-level analysis tools.
The output from Chronus is the time of the fault point. Based on this
timing information (the "when"), the troubleshooter can then use OS-
or application-specific tools to diagnose the cause of the failure
(the "why"). One simple but useful technique is to compare the
complete file system state immediately before and after the failure
using an invocation of the UNIX diff command.
Figure 2 depicts the stages of a typical Chronus session.
Figure 2: A Chronus debugging session:
Given a user-supplied software probe, Chronus reveals when the system
began failing. Based on this information, it is possible to
understand the cause of failure using higher-level analysis tools.
The output from Chronus is the time of the fault point. Based on this
timing information (the "when"), the troubleshooter can then use OS-
or application-specific tools to diagnose the cause of the failure
(the "why"). One simple but useful technique is to compare the
complete file system state immediately before and after the failure
using an invocation of the UNIX diff command.
Figure 2 depicts the stages of a typical Chronus session.
1.3 Outline
In the remainder of this paper, we describe the design and
implementation of Chronus, and we demonstrate its ability to help a
troubleshooter diagnose significant configuration errors. The
remainder of this paper is organized as follows. In
Section 2, we describe some of the challenges we faced
and design decisions that we made. Section 3
discusses the Chronus implementation. We evaluate Chronus in
Section 4. After discussing related work in
Section 6, we describe open problems and future work
in Section 7, and we conclude in
Section 8.
2 Challenges and Design Tradeoffs
In this section, we drill down into the major components of Chronus.
In each case, we identify the major challenges and describe the design
tradeoffs we faced.
2.1 Time travel
Chronus relies on a time travel mechanism to instantiate previous
system states. Traditional checkpointing systems capture the complete
state of a system, including both persistent (e.g., disk contents) and
transient state (e.g., memory and CPU state). This approach recreates
previous states with high fidelity, but imposes a heavy overhead to
continually flush memory state to disk. Approaches based on
incremental logging (e.g., Revirt [15]), reduce overhead
during normal operation, but require more time to recreate a previous
system state.
Instead of taking full checkpoints, Chronus only records updates to
persistent storage. This allows for reasonable performance during
both normal operation and problem diagnosis. As we demonstrate in
Section 5.1, the overhead of our versioning storage
system is primarily limited to disk space (which is plentiful) rather
than degraded performance.
A drawback of disk-only state capture is that we sacrifice
completeness: only errors that persist across system restarts are
recorded by the time travel layer. Note, however, that some
configuration changes require system restarts to take effect - for
example, changes to shared libraries or the OS kernel typically
require system reboots. For this type of "delayed release"
configuration change, the on-disk state is more meaningful than the
instantaneous characteristics of the running system.
2.1.1 Time-travel disks
Time-travel or versioning storage systems have been extensively
studied. Proposed systems include versioning file
systems [30,31], source code repositories [14],
time-travel databases [32], and the Peabody time-travel
disk [25]. Taken as a whole, these systems demonstrate a
tradeoff between completeness and high-level semantics
(Figure 3). At one extreme, the time-travel disk offers
the most completeness, in that it captures all state changes without
requiring support from operating systems or applications. At the
other extreme, relational databases offers strong data consistency
semantics, but require applications to utilize a particular API.
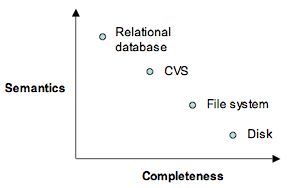 Figure 3: Time travel storage layer tradeoff:
Chronus uses a time travel disk, which achieves completeness while
forfeiting high-level semantics.
For Chronus, we chose a storage system based on a time-travel disk.
One of our goals ws to avoid making assumptions about how and where
configuration errors arise. Because of its low-level interface, a
time-travel disk captures all local configuration changes,
without regard to application or OS functionality. Chronus is to some
degree "future-proof," in that it can diagnose configuration errors
for systems that have yet to be written.
A drawback of a time-travel disk is that it offers poor data
consistency semantics. In some cases, the on-disk state may be
corrupt, causing Chronus to discover a spurious error unrelated to the
true cause of failure. More commonly, Chronus may discover the
correct error, but the granularity of a block change is too fine to
make a useful diagnosis. For example, configuration files can
temporarily disappear while the text editor's "save" operation is in
progress. Because such inconsistencies are short-lived, it often
suffices to "zoom out" by computing state changes over a slightly
longer interval.
Figure 3: Time travel storage layer tradeoff:
Chronus uses a time travel disk, which achieves completeness while
forfeiting high-level semantics.
For Chronus, we chose a storage system based on a time-travel disk.
One of our goals ws to avoid making assumptions about how and where
configuration errors arise. Because of its low-level interface, a
time-travel disk captures all local configuration changes,
without regard to application or OS functionality. Chronus is to some
degree "future-proof," in that it can diagnose configuration errors
for systems that have yet to be written.
A drawback of a time-travel disk is that it offers poor data
consistency semantics. In some cases, the on-disk state may be
corrupt, causing Chronus to discover a spurious error unrelated to the
true cause of failure. More commonly, Chronus may discover the
correct error, but the granularity of a block change is too fine to
make a useful diagnosis. For example, configuration files can
temporarily disappear while the text editor's "save" operation is in
progress. Because such inconsistencies are short-lived, it often
suffices to "zoom out" by computing state changes over a slightly
longer interval.
2.2 Instantiating a historical state
Another key design decision is the technique used to instantiate
previous system configurations. A simple strategy would be to use
application-layer restarts, in which the user-mode processes of
interest are restarted after each configuration change.
Unfortunately, many relevant configuration changes require
whole-system reboots, including changes to system software (the
kernel, shared libraries) or configuration options (TCP/IP parameters,
firewall policy).
In this work, we use a virtual machine monitor
(VMM) [13,33,35] to perform "virtual reboots"
in software. Because VMMs emulate the hardware layer, they provide a
more complete representation of whole-system behavior. As well, VM
restarts offer a series of advantage compared to physical machine
restarts. VMs can be rebooted faster, because they avoid
re-initializing physical I/O devices. For Chronus, this translates
into faster problem diagnosis. VMMs provide robust mechanisms for
terminating failed tests and reclaiming state changes, and they enable
debugger-like functionality, allowing the user to inspect or modify VM
state.
There are disadvantages to using VMMs. Virtualization imposes
performance overhead; this can be minimized [4], but may
still be significant in some settings. VMMs tend to reduce virtual
device interfaces to the lowest common denominator, and thus may mask
or perturb some configuration errors. A VMM might not expose a
bleeding-edge graphics card, for example. Finally, a VMM-based
implementation of Chronus cannot diagnose configuration errors within
the virtualization layer itself, such as updates to physical device
drivers.
2.3 Testing a historical state
Chronus's automated diagnosis capability relies on a user-supplied
software probe to test whether the system is functioning
correctly. Testing a system is often easier than performing a full
failure diagnosis. Nevertheless, testing itself can be a non-trivial
task, and probe authorship represents a hurdle to utilizing Chronus.
In our current prototype, probes are written on the fly in response to
specific failure conditions. We assume that troubleshooters have
knowledge of shell scripts and basic command line tools. With this,
many configuration errors are testable, including application crashes,
a Web browser that fails to load pages, or a remote execution service
that refuses access to valid clients.
For errors that are beyond the scope of shell scripts, Chronus
supports a manual testing mode, in which the human
troubleshooter performs some or all of the testing process by hand.
We have found manual testing particularly useful to evaluate errors
that involve sequences of GUI actions or that require the user to
interpret a visual image. Manual testing can be used with more
configuration errors than probes, but it imposes a heavier burden.
In the future, we plan to explore techniques to simplify probe
creation. One option is to create static libraries of probes, which
could be used to test generic forms of application behavior. For
example, a generic web server probe might attempt to download the
system home page. For graphical applications, Chronus could leverage
point-and-click tools for capturing and replaying sequences of GUI
actions [20].
Regardless of testing strategy, there are some configuration errors
that Chronus cannot diagnose. Non-deterministic
errors (or Heisenbugs [17]) that cannot be
reliably reproduced are beyond the scope of our tool.
2.4 Searching over time
Given a probe, a naïve approach to finding a fault point is to
sequentially examine every historical state of the system. Of course,
this is impractical, as it would require instantiating, booting, and
testing a virtual machine for each disk block write that occurred in
the past.
A more intelligent approach is to use a binary search through time.
If the troubleshooter can identify a past instance in time at which
the system worked, and assuming there is a single transition from that
working state to the current non-working state (as in
Figure 1), then binary search will find the fault point
in logarithmic time.
However, in some cases, a system may make multiple transitions
from a working to a non-working state, as shown in
Figure 4. Most of these additional state transitions
are spurious, in that they are not related to the true source
of the current configuration error. For example, because software is
typically unavailable during a software upgrade, Chronus may mistakenly
implicate a past upgrade that is unrelated to the current configuration
error. Other sources of spurious errors include configuration changes
that have already been fixed, and short-term inconsistencies due to
corrupt file system state.
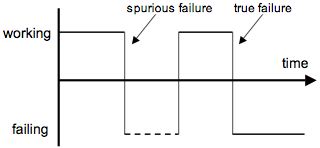 Figure 4: A spurious search result:
Chronus may detect an error that is unrelated to the current cause of failure.
A simple strategy for dealing with multiple failures is simply to run
Chronus multiple times. By choosing
different time ranges for each search, Chronus can be made to explore
different regions of the system time-line. This is philosophically
similar to simulated annealing search, which uses random choices to
escape local minimums [29]. The troubleshooter can then analyze
all returned state transitions to determine which one is the likely
source of failure.
An alternate strategy is to construct probes that are less likely to
exhibit spurious errors. One useful strategy is to construct
error-directed probes, which search for changes in the system's
observable symptoms, regardless of whether the behavior is
"correct." The key insight is that different failure causes often
produce different failure modes. For example, one error might cause
an application to hang, whereas another produces an identifiable error
messages. Therefore, probes that search for a particular
symptom are less likely to reveal spurious errors unrelated to the
true cause of failure. We explore such a complex error scenario in
Section 4.3.
Figure 4: A spurious search result:
Chronus may detect an error that is unrelated to the current cause of failure.
A simple strategy for dealing with multiple failures is simply to run
Chronus multiple times. By choosing
different time ranges for each search, Chronus can be made to explore
different regions of the system time-line. This is philosophically
similar to simulated annealing search, which uses random choices to
escape local minimums [29]. The troubleshooter can then analyze
all returned state transitions to determine which one is the likely
source of failure.
An alternate strategy is to construct probes that are less likely to
exhibit spurious errors. One useful strategy is to construct
error-directed probes, which search for changes in the system's
observable symptoms, regardless of whether the behavior is
"correct." The key insight is that different failure causes often
produce different failure modes. For example, one error might cause
an application to hang, whereas another produces an identifiable error
messages. Therefore, probes that search for a particular
symptom are less likely to reveal spurious errors unrelated to the
true cause of failure. We explore such a complex error scenario in
Section 4.3.
2.5 Going from "when" to "why"
The output from Chronus is the instant in time the transition to a
failing state occurred. Using this, the troubleshooter can determine
the state change that induced the failure. In many cases, this
information alone is sufficient to diagnose the configuration error.
In other cases, however, the individual state change revealed by
Chronus may be insufficient to diagnose the error. For binary
configuration data, there is no
universal differencing mechanism that reveals the "meaning" of a
state change. Another limitation is that Chronus cannot uncover the
broader context in which a state change was carried out. For example,
Chronus cannot associate a modification to a dynamic library with the
act of installing a particular application. In these cases, reversing
the single state change revealed by Chronus may be insufficient to
remedy the problem.
The solution to this "semantic gap" [11] between
hardware-level events and higher-level semantics lies in combining
Chronus with other debugging tools. The UNIX diff, which
reveals changes to ASCII files, is one such tool, but others may be
more appropriate in certain contexts. For example, the Windows
regdiff tool reveals changes between two snapshots of the Windows
Registry. The Backtracker tool [22] performs root-cause
analysis by mapping from a low-level state event to high-level user
action. Another approach is to leverage existing system logs.
Currently, the sheer volume of this logging makes it difficult to use,
but the timing information provided by Chronus can be used to quickly
zoom-in on a small cross-section of system log entries.
2.6 Summary
The Chronus tool maps from a user-provided software probe to the
instant the system transitioned to a failing state. This information,
in conjunction with higher-level analysis tools like diff,
allows a troubleshooter to diagnose the cause of failure.
The design of Chronus was guided by a few basic goals. Unlike
programming language debuggers, Chronus strives for low overhead
during normal operation. To achieve this, our snapshot mechanism only
captures storage updates rather than complete memory checkpoints.
Chronus also strives to capture the most possible configuration
errors. We achieve this by using a time-travel disk (which captures
all persistent state changes) and virtual machine monitors
(which reproduce the entire system boot sequence). Finally, Chronus
strives for fast problem diagnosis. Binary search provides for
diagnosis time that scales logarithmically with log size. Also, our
use of virtual machines enables individual tests to execute
significantly faster than would be possible on physical hardware.
3 Implementation
In this section, we describe our prototype implementation of Chronus.
Our prototype consists of roughly 2600 commented lines of C code,
approximately half of which is dedicated to the time-travel disk. The
other half comprises the search, testing, and diagnosis functionality.
Figure 5 shows a high-level view of Chronus.
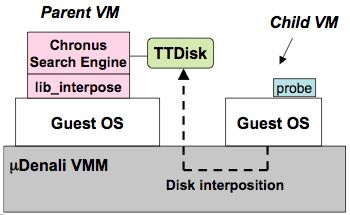 Figure 5: Chronus software architecture:
During normal operation, the parent VM records the child's disk writes
to a time-travel disk (TTDisk). During debugging, a software probe is
used to determine the correctness of a given state. Chronus uses the
probe to implement a search strategy (such as binary search) across
the system time-line.
Chronus makes heavy use of the mDenali VMM [35].
Presently, mDenali (and hence Chronus) only supports the NetBSD
guest OS. mDenali VMM allows a "parent" virtual machine to
exert control over its "child" virtual machines. In addition to
being able to create, destroy, and boot child VMs, the parent can
interpose on and respond to its children's virtual hardware device
events. For example, if a child issues a virtual disk write, that
event is passed to the parent via the "lib_interpose" interposition
library. In Chronus, the child executes normal user programs, while
the parent implements the Chronus debugging functionality. Chronus
itself runs as a normal user process with permission to access the
interposition and control APIs described by Whitaker et
al. [35]
Chronus exposes a command-line interface to the troubleshooter. The
search command initiates a diagnosis session. The command's
arguments include the name of a time-travel disk, the beginning and
end of a search range (expressed as log indexes), and a probe
configuration file, which defines the executable probe routine and
other probe meta-data. If the search range limits are omitted,
Chronus defaults to the beginning and end of the log. After Chronus
has identified the instant of failure, the attach command is
used to mount the child disk into the parent's local file system
before and after the failure. The troubleshooter can then use
commands such as diff to extract meaningful state changes.
In addition to the search and attach commands,
Chronus provides a set of command line utilities for interacting with
time-travel disks. See Table 1 for details.
Figure 5: Chronus software architecture:
During normal operation, the parent VM records the child's disk writes
to a time-travel disk (TTDisk). During debugging, a software probe is
used to determine the correctness of a given state. Chronus uses the
probe to implement a search strategy (such as binary search) across
the system time-line.
Chronus makes heavy use of the mDenali VMM [35].
Presently, mDenali (and hence Chronus) only supports the NetBSD
guest OS. mDenali VMM allows a "parent" virtual machine to
exert control over its "child" virtual machines. In addition to
being able to create, destroy, and boot child VMs, the parent can
interpose on and respond to its children's virtual hardware device
events. For example, if a child issues a virtual disk write, that
event is passed to the parent via the "lib_interpose" interposition
library. In Chronus, the child executes normal user programs, while
the parent implements the Chronus debugging functionality. Chronus
itself runs as a normal user process with permission to access the
interposition and control APIs described by Whitaker et
al. [35]
Chronus exposes a command-line interface to the troubleshooter. The
search command initiates a diagnosis session. The command's
arguments include the name of a time-travel disk, the beginning and
end of a search range (expressed as log indexes), and a probe
configuration file, which defines the executable probe routine and
other probe meta-data. If the search range limits are omitted,
Chronus defaults to the beginning and end of the log. After Chronus
has identified the instant of failure, the attach command is
used to mount the child disk into the parent's local file system
before and after the failure. The troubleshooter can then use
commands such as diff to extract meaningful state changes.
In addition to the search and attach commands,
Chronus provides a set of command line utilities for interacting with
time-travel disks. See Table 1 for details.
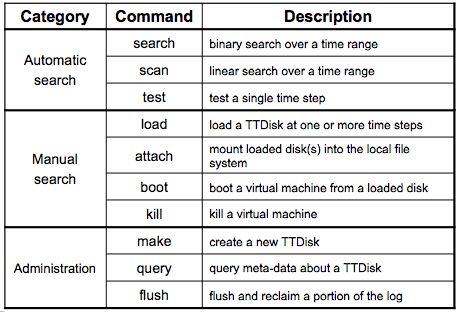 Table 1: Chronus command-line utilities:
Automatic commands perform time-travel searches given a search probe.
Manual commands allow the troubleshooter to instantiate a
time-travel disk at some point in the past. Administrative commands
perform TTDisk creation and maintenance.
Beyond the mDenali VMM, the major components of Chronus's
implementation are a time-travel disk for recreating previous states,
testing infrastructure for evaluating individual states, and binary
search for efficiently localizing the failure across many previous
states.
Table 1: Chronus command-line utilities:
Automatic commands perform time-travel searches given a search probe.
Manual commands allow the troubleshooter to instantiate a
time-travel disk at some point in the past. Administrative commands
perform TTDisk creation and maintenance.
Beyond the mDenali VMM, the major components of Chronus's
implementation are a time-travel disk for recreating previous states,
testing infrastructure for evaluating individual states, and binary
search for efficiently localizing the failure across many previous
states.
3.1 Time-travel Disk
The Chronus time-travel disk (or TTDisk) maintains a log of
the child VM's disk writes. The TTDisk implements the
mDenali disk interface [35], a C API that allows the
programmer to implement custom functionality for disk reads and
writes. The TTDisk functionality is hidden behind the
hardware disk interface, so the child's guest OS requires no
modifications.
The TTDisk uses two helper disks to maintain state. A
checkpoint disk contains the initial disk contents. All disk
writes are recorded to a log disk. The implementation of both
disks is abstracted away behind the mDenali disk interface. In
our current implementation, checkpoint/log disks can be backed by
either physical disk partitions or by files in the parent's local file
system. We disable write caching to ensure that disk writes are
synchronously flushed to disk. Periodically, the log can be trimmed
by flushing old entries back to the checkpoint.
In addition to the data disks, the TTDisk requires a
meta-data region to map a given disk block to a location in
either the checkpoint or the log. The TTDisk meta-data is
similar to the checkpoint region of the log-structured file
system [28], except
that it preserves all previous disk writes, not merely
those that are still active. For each TTDisk block, the
meta-data region maintains a sorted list of the log writes that
modified the given block. The meta-data region is backed by a file
in the parent's local file system. As with the log-structured file
system, we alternate between two meta-data regions (files) to ensure
consistency in the face of failure [28].
3.1.1 Design details
The TTDisk uses a block size larger than the disk sector
size to reduce the amount of meta-data. For NetBSD, the correct
choice for this parameter is not the file system block size, but
rather the file system fragment size. BSD systems typically
use a large block size and rely on smaller
fragments to efficiently store small
files [23]. By choosing the
TTDisk block size to match the file system fragment
size, we avoid degrading performance for small writes.
A general problem for log-structured storage systems is maintaining
consistency without synchronously writing log meta-data. The design
of the TTDisk avoids synchronous meta-data writes by
appending a recovery sector to each block written to the log.
The recovery sector contains two fields: the virtual block index that
the log write corresponds to, and a 64-bit counter, which is used to
indicate the last log entry. During recovery, we roll forward the log
starting from the last meta-data checkpoint until we reach a recovery
sector that does not contain a valid counter.
The implementation of TTDisk crash recovery is not complete
in our current prototype. We have implemented a version of
TTDisk that writes recovery sectors, but this version
exhibits poor performance because the mDenali disk interface
currently supports only 4 KB block operations (as opposed to 512 byte
sector operations).
3.2 Testing infrastructure
Chronus relies on user-supplied software probes to indicate whether a
given time step corresponds to a "correct" system state. Given such
a probe, the testing infrastructure automates the task of
instantiating and evaluating a previous system state. After the test
has completed, any state changes made during the test are discarded.
Chronus supports two styles of software probes. Internal
probes run inside the child virtual machine being tested.
External probes run on the parent virtual machine conducting
the test. Generally, external probes are used for diagnosing
server failures. Running a probe internally on the server could yield
incorrect results, since the local loopback network device is
configured separately from the external interface. Internal probes
are used for all other types of applications, including network
clients and non-networked applications.
The steps for executing a probe differ for internal versus external
probes. In both cases, the first step is to wrap the time-travel disk
with a copy-on-write (COW) disk. This provides a convenient mechanism
for discarding state changes made during probe execution. For
internal probes, the parent virtual machine then executes a
pre-processing routine, which mounts the COW disk into the
parent's file system, and configures the child's file system to
execute the probe routine on boot. By convention, the probe output is
stored in a particular file for later extraction. Once the probe has
executed, the child VM performs a halt operation, causing the parent
VM to terminate it. Alternately, a timeout mechanism is used for
tests that hang or stall. After termination, the parent VM once again
mounts the COW disk, and executes a post-processing routine to
extract the probe result.
The steps for executing external probes are similar, but simpler. The
pre-processing and post-processing phases are omitted. The probe runs
in the parent virtual machine while the child virtual machine
is running. Once the probe terminates or times out, the child VM is
garbage collected.
3.3 Binary search
Chronus uses binary search to quickly find the fault point along the
system time-line. We assume the system exhibits a transition from a
working to a non-working state, as shown in Figure 1.
Chronus begins by running the probe at the limits of the user-provided
search range. Assuming the limits exhibit different probe results,
Chronus then tests the midpoint; if the midpoint's output is the same
as the endpoint's, Chronus recursively tests the earlier half of time
line. If the probe's output differs from the endpoint's, Chronus
recursively tests the later half of the time line. In some cases, a
probe may fail to execute or may produce non-binary results. To
handle this, Chronus considers all results that differ from the
endpoint to be the same. This tends to work because probe failures
often coincide with a non-working system, and we are generally
interested in the last transition from a working to a non-working
state.
Chronus requires the troubleshooter to specify a search range whose
limits exhibit different probe results. Because the troubleshooter
might not know an appropriate range a priori, Chronus provides a
test command, which allows the troubleshooter to
guess-and-check individual time steps. In our experience, this
mechanism has proven sufficient to quickly discover a valid search
range for most failure cases.
4 Debugging Experience
In this section, we describe our experience using the Chronus tool.
For each experiment, we used binary search to locate the failure in
time and the UNIX diff utility to extract the state change.
In some cases, it was necessary to compute the state difference over a
time range larger than a single block. As a result, diff
sometimes detects spurious changes such as changes to emacs backup
files or modifications to the system lost+found directory. In some
cases, we have sanitized the results for brevity, but we never removed
more than eight lines of output. All probes are written as UNIX shell
scripts.
#!/bin/sh

TEMPFILE=./QXB50.tmp
rm -f ${TEMPFILE}

ssh root@10.19.13.17 'date' > ${TEMPFILE}

if (test -s ${TEMPFILE})
    then echo "SSHD UP"
else echo "SSHD DOWN"
fi

exit 0
Figure 6: sshd probe:
This is the complete version of a shell script that diagnosed a
configuration fault in the ssh daemon.
>>> search netbsd andrew.time
0000: SSHD UP  5267: SSHD DOWN  2633: SSHD UP
3950: SSHD UP  4608: SSHD UP    4937: SSHD DOWN
4772: SSHD UP  4854: SSHD UP    4895: SSHD UP
4916: SSHD UP  4926: SSHD DOWN  4921: SSHD DOWN
4918: SSHD UP  4919: SSHD UP    4920: SSHD DOWN

# attach ttdisk before and after fault
>>> attach andrew.time 4919 4920

# use recursive diff to find what changed
>>> diff -r /child1 /child2
Binary file /etc/ssh/ssh_host_key differs
Figure 7: Diagnosing the sshd failure: This
terminal log shows Chronus's output for a binary search using the
sshd probe. We have added comments to the raw output, preceded by
'#'. After pinpointing the failure instant, we attach the
time-travel disk before and after the fault, and use recursive
diff to elicit the failure cause.
# Probe
#!/bin/sh

rm -f /TTOUTPUT
echo 'SUCCESS' > /TTOUTPUT

# Console output

% search netbsd andrew2.time

0000: SUCCESS  1607: FAILURE  0803: SUCCESS
1205: SUCCESS  1406: SUCCESS  1506: FAILURE
1456: FAILURE  1431: FAILURE  1418: FAILURE
1412: FAILURE  1409: FAILURE  1407: SUCCESS
1408: FAILURE

% attach andrew2.time 1407 1408
% diff -r --exclude '*dev*' /child1 /child2

file: /child1/etc/rc.d/bootconf.sh differs
<       conf=${_DUMMY}
>       conf=${$DUMMY}
Figure 8: Boot failure probe and console output:
The probe writes a string to a file, but only if the boot process
completes successfully. Using this probe, Chronus diagnosed the
failure as resulting from a change to the file bootconf.sh.
4.1 Randomly injected failures
We wrote a fault-injection tool called etc-smasher that creates
typos in key system configuration files. Such errors can be difficult
to diagnose because they often do not take effect until after the
machine is rebooted. Once per second, etc-smasher chooses a
random file from the /etc directory (which contains system
and application configuration files). 90% of the time,
etc-smasher writes back the file without modifying it; this
creates "background noise" in the system. For the remaining 10%,
the program changes the file in a small way, by either removing,
adding, or modifying a character. To generate a sample run, we ran
the program for several minutes, and observed the most obvious failure
symptom.
The first two runs of this program induced the following configuration
errors:
Configuration Fault #1: sshd failure. The child VM's sshd
daemon does not respond to remote login requests.
Configuration Fault #2: boot failure.
The child VM does not boot correctly. Instead of a login prompt, the
user is asked to enter a shell name.
To diagnose the sshd failure, we wrote a probe that attempts to login
via ssh and execute the UNIX date command. This probe (shown
in Figure 6) is an external probe: it runs on the
parent VM. Notice that the probe only deals with the observable
symptoms of ssh, and not with any of its potential failure causes
(TCP/IP mis-configurations, authentication failure, failure of the ssh
daemon itself, etc.) Figure 7 shows the output of
running a Chronus binary search for this error. The ssh fault was
introduced between disk block writes 4919 and 4920 within the log.
The output from diff indicates the error resulted from a
change in the ssh_host_key file.
To diagnose the boot failure, we crafted a probe that writes a string
into a file (see Figure 8). The probe runs
internally (within the child VM), but only executes after the
boot sequence has completed. As a result, the
existence of the file /TTOUTPUT indicates a successful trial.
If the boot process hangs, Chronus eventually terminates the virtual
machine, and the trial constitutes a failure. As shown in
Figure 8, Chronus correctly identified the source of
the error as a small typo in the file /etc/rc.d/bootconf.sh.
4.2 Debugging Mozilla errors
To understand Chronus's behavior for graphical applications, we
analyzed a list of frequently asked questions for the Mozilla Web
browser [26]. The questions fall into two categories:
1) customization questions such as "how can I make Mozilla my default
browser?" and 2) errors/problems. The latter category comprises 24
out of a total of 53 questions.
In Table 2, we indicate which Mozilla errors could
be diagnosed with Chronus. To qualify for Chronus support, an error
must be both easily reproducible and result from a state change
from Mozilla's default configuration. Overall, 15 of the 24 errors
(63%) in the Mozilla FAQ satisfy these criteria.
We further break down the errors captured by Chronus according to the
best available testing strategy. For 7 error cases, it would be
possible to construct a shell-script probe to elicit the
failure condition. From a script, it is possible to direct Mozilla to
a specific page and extract the returned result. Also, Mozilla
supports a "ping" command, which is useful for determining if the
application has crashed or hung. The 8 remaining error cases require
manual control over some or all of the testing process;
typically, these errors involve GUI interactions that are difficult to
script. In the future, it may be possible to automate more diagnoses
using graphical capture/replay tools [20].
The "connection refused" error requires further explanation. The
error arises when a local firewall prevents the Mozilla executable
from establishing out-bound connections. This error has a subtle
dependence on the order that the firewall and Mozilla are
installed. If Mozilla is installed first, then the installation of
the firewall will trigger a failure, which Chronus can detect. If the
firewall is installed first, then Mozilla will never
work correctly. Nevertheless, it is still possible to diagnose this
error with Chronus by using a probe that first installs
Mozilla, and then tests the application.
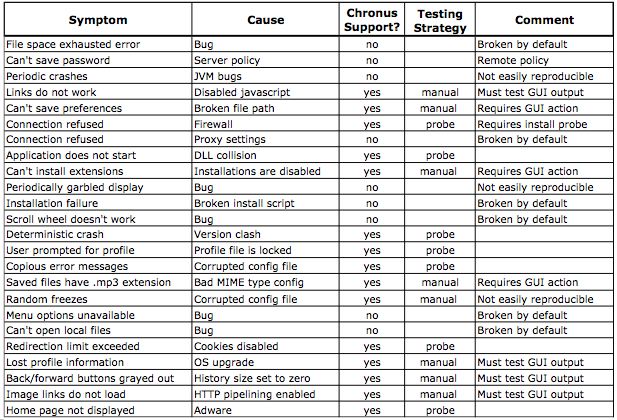 Table 2: The applicability of Chronus for Mozilla
errors: 15 of these 24 errors could be captured by Chronus.
This means that they are both repeatable and result from a state
change. In 7 of these cases, the testing could be conducted
automatically given a shell-script probe. For the other 8 cases,
the testing process requires assistance from a human operator,
either to manipulate Mozilla or interpret its visual output.
Beyond studying applicability, we also used Chronus to diagnose
several of the Mozilla errors. For each trial, we synthetically
injected the error condition based on the description in the Mozilla
FAQ. We then wrote a probe to diagnose the behavior, and ran Chronus
to pinpoint the offending state transition. We now describe two such
trials in more depth.
Table 2: The applicability of Chronus for Mozilla
errors: 15 of these 24 errors could be captured by Chronus.
This means that they are both repeatable and result from a state
change. In 7 of these cases, the testing could be conducted
automatically given a shell-script probe. For the other 8 cases,
the testing process requires assistance from a human operator,
either to manipulate Mozilla or interpret its visual output.
Beyond studying applicability, we also used Chronus to diagnose
several of the Mozilla errors. For each trial, we synthetically
injected the error condition based on the description in the Mozilla
FAQ. We then wrote a probe to diagnose the behavior, and ran Chronus
to pinpoint the offending state transition. We now describe two such
trials in more depth.
4.2.1 JavaScript error
JavaScript is used by some web sites to provide enhanced functionality
beyond static content. JavaScript is also a security concern, and
Mozilla allows users to limit the functionality of scripts, or to
disable JavaScript completely. In some cases, JavaScript-enabled sites
may demonstrate strange behavior if JavaScript is not enabled. For
example, the user may be unable to follow hyperlinks for a particular
page [26].
To model this error, we installed Mozilla in a virtual machine and
disabled JavaScript through the preferences menu. To test for the
error, we wrote a probe that directs Mozilla to fetch a web page that
requires JavaScript support. The probe asks the user whether the
resulting display output is correct. The probe and console output are
shown in Figure 9.
# Probe
#!/bin/sh

ssh -X root@10.19.13.79 'mozilla  $WEBSITE' &

echo -n 'RESULT: '

read result
echo $result

# Console output

169904: RESULT:  GOOD 222044: RESULT: BAD
195974: RESULT: BAD 182939: RESULT: BAD
176421: RESULT: BAD 173162: RESULT:  GOOD
174791: RESULT: BAD 173976: RESULT: BAD
173569: RESULT: BAD 173365: RESULT:  GOOD
173467: RESULT: BAD 173416: RESULT:  GOOD
173441: RESULT:  GOOD 173454: RESULT: BAD
173447: RESULT:  GOOD 173450: RESULT:  GOOD
173452: RESULT: BAD 173451: RESULT: BAD

>>> diff -r  /child1 /child2
file /root/.mozilla/default/zc1u3kp2.slt/prefs.js
differs:
> user_pref("browser.download.dir", "/root");
> user_pref("browser.startup.homepage",
"https://www.mozilla.org/start/");
> user_pref("javascript.enabled", false);
Figure 9: Mozilla JavaScript probe and console output:
This probe, combined with user input, diagnosed a Mozilla
rendering problem related to JavaScript. The probe runs
externally on the parent VM, so that X-windows ssh forwarding is
set up properly. Spurious information exists because Mozilla
atomically saves all preference changes made during a user
session.
4.2.2 A misbehaved extension
Mozilla allows developers to provide new functionality via an
extensibility API. These extensions are not well-isolated, and a
misbehaved extension can cause the overall browser to malfunction. To
model this error, we installed a set of extensions from the Web.
After quitting and restarting the program, we discovered that one of
these extensions had introduced a malfunction, such that Mozilla would
hang before displaying a page.
To diagnose this error, we wrote a probe that uses the Mozilla
"ping" command to indicate whether a previously-launched browser is
functioning correctly. Figure 10 shows the
output of the diff utility. Although more verbose than
previous examples, the state change reveals that the "StockTicker"
extension caused Mozilla to malfunction.
>>> diff -r /child1 /child2
file /root/.mozilla/default/zc1irw5u.slt/chrome
/chrome.rdf differs:

> <RDF:Description about="urn:mozilla:package
:stockticker"
> c:baseURL="jar:file:///root/.mozilla/default
/zc1irw5u.slt
> /chrome/stockticker.jar!/content/"
> c:locType="profile"
> c:author="Jeremy Gillick"
> c:authorURL="https://jgillick.nettripper.com/"
> c:description="Shows your favorite stocks in a
> customized ticker."
> c:displayName="StockTicker 0.4.2"
> c:extension="true"
> c:name="stockticker"
> c:settingsURL="chrome://stockticker/content
/options.xul" />
Figure 10: Console output for a buggy Mozilla
extension: Chronus traced the failure to the "StockTicker"
extension.
4.3 A complex Apache error
As discussed in Section 2.4, binary search can
fail in the presence of multiple faults in a single time-line. To
explore this phenomenon, we introduced a sequence of configuration
events inside an Apache web server, as shown in
Figure 11a. The "true failure" is a
mis-configuration of the Apache suexec command, which allows
an administrator to run CGI scripts as a different user than the
overall Web server. suexec is a common source of
configuration errors, especially when scripts require special
privileges [7]. In our example, the CGI script
must connect to a back end database, which only permits access from
the user www. As a result, Web requests for this script
return an HTTP error message.
In addition to the suexec error, we performed two actions
that affect the Web server's functionality. Near the start of the
trace, we changed the server's IP address. Because DNS mappings are
not captured in our time-travel layer, any attempt to connect to the
server before the IP address change will not succeed. Subsequently,
we upgraded the version of the Apache running on the server. This new
build was necessary to support the suexec command. During
the installation of the upgrade, the Web server is unavailable to
Chronus probes.
There are two strategies one could take in analyzing this failure.
First, one could write a success-directed probe, which tests
whether the system successfully handles requests. We wrote such a
probe by testing for a successful HTTP response. The drawback of such
a probe is that it may detect any transition from a working to
a failing state, as shown in Figure 11a. In the
worst case, the user must decipher two spurious results before
revealing the true source of the error.
An alternate approach is to construct a failure-directed probe.
Instead of looking for successful completion of a request, a
failure-directed probe searches for the precise error behavior
exhibited by the application. In this example, the suexec
failure returned a distinctive error message. Because different
errors often exhibit different symptoms, a failure directed probe can
result in fewer state transitions over an equivalent system time-line
(see Figure 11b). Using a failure-directed probe,
we discovered the source of the suexec failure using a single
Chronus search invocation.
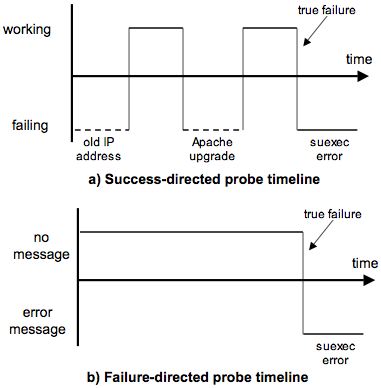 Figure 11: Apache suexec error, as seen by two
different probes: A success-directed probe searches for
transitions from a working to a failing state. This may return
spurious results when the system contains multiple such
transitions. A failure-directed probe searches for changes in the
specific error symptom exhibited by the application. For this
example, a failure-directed probe revealed the configuration error
with a single Chronus invocation.
Figure 11: Apache suexec error, as seen by two
different probes: A success-directed probe searches for
transitions from a working to a failing state. This may return
spurious results when the system contains multiple such
transitions. A failure-directed probe searches for changes in the
specific error symptom exhibited by the application. For this
example, a failure-directed probe revealed the configuration error
with a single Chronus invocation.
4.4 Reverse debugging
Although we intended Chronus as a tool for finding configuration bugs,
an alternate use is to search for configuration fixes. This is
especially useful in cases when the "fix" was applied
serendipitously. For example, application X might install a
dynamic library that fortuitously allows application Y to work
correctly. In practice, the issue is even more subtle, because
the order in which packages are installed can affect the system's
final configuration [19]. Given a failing machine and a
correct machine, an administrator can use Chronus to find the fix from
the correct machine, and then apply the fix to the failing machine.
We used reverse debugging to elicit the correct configuration for the
NetBSD Network Time Protocol (NTP) daemon. Initially, the system's
NTP configuration was incorrect, causing the system's time to be set
to an incorrect value. Although we fixed the problem in one
particular VM, the change was not propagated back to the base disk
image. To locate the fix, we wrote a probe that searches for unusual
behavior from the make utility; make relies on a correct
clock, and may force unnecessary recompilation when the clock is
mis-configured.
5 Quantitative Evaluation
In this section, we provide quantitative measurements of Chronus. We
analyze time-travel disk performance, log growth, and debugging
execution time. All tests were run on a uniprocessor 3.2GHz Pentium 4
with hyperthreading disabled. The test machine had 2 GB of RAM, but
the virtual machines (both the parent and the child) were configured
to use at most 512 MB. The machine contained a single 80 GB, 7200 RPM
Maxtor DiamondMax Plus IDE drive, and an Intel PRO/1000 PCI gigabit
Ethernet card.
All of the following experiments were run without appending recovery
sectors to log writes. Therefore, the results model a system that
uses some other mechanism for insuring meta-data consistency (e.g.,
non-volatile RAM). An implementation with recovery sectors would
require 12.5% more disk space (one 512 byte recovery sector is
appended to each 4 KB block). The performance overhead would likely
be similar.
5.1 Runtime Overhead
To evaluate time-travel disk performance, we ran the set of workloads
shown in Table 3. We generated the sequential read and
write workloads using the UNIX dd command using 32 KB block
increments. We also ran an "adversarial" sequential read, in which
we read over a disk region that was previously written in reverse
order in 32 KB increments. Finally, we ran untar and grep over the
Mozilla 1.6 source tree. Mozilla 1.6 contains 35,186 files in 2,454
directories, and has a total size of 300 MB. The "native disk" data
series shows the performance of a child VM using a physical disk
partition. The time-travel disk log was backed by a physical
partition. No disk operations were processed by the checkpoint disk,
and swapping was disabled for these tests.
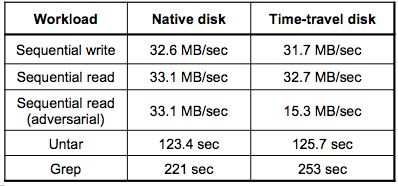 Table 3: Time-travel disk performance:
The time-travel disk is competitive with the native disk for all
workloads, except for the "adversarial" workload designed to exhibit
poor locality in the time-travel log.
For most workloads, the performance of the time-travel disk is
competitive with the native disk. The one exception is the
adversarial sequential read workload. Because blocks are written out
in reverse log order, this style of workload generates poor
performance from a log-structured storage layer. Most files are
processed sequentially [2], suggesting this style
of workload occurs rarely in practice.
Table 3: Time-travel disk performance:
The time-travel disk is competitive with the native disk for all
workloads, except for the "adversarial" workload designed to exhibit
poor locality in the time-travel log.
For most workloads, the performance of the time-travel disk is
competitive with the native disk. The one exception is the
adversarial sequential read workload. Because blocks are written out
in reverse log order, this style of workload generates poor
performance from a log-structured storage layer. Most files are
processed sequentially [2], suggesting this style
of workload occurs rarely in practice.
5.2 Measuring log inflation
Chronus relies on excess storage capacity to maintain the time-travel
log. This is reasonable, given that storage capacity is growing at an
annual rate of 60% [18] and shows no signs of abating.
Other researchers have noted that users can already go years without
reclaiming storage [16].
One remaining concern is log inflation, which arises from file
system meta-data operations. Applications that heavily modify the
directory structure can generate excessive log growth.
Table 4 shows the amount of log growth required for
various operations on the Mozilla 1.6 archive. As expected, simply
copying the tar file does not generate undue log inflation. However,
untaring Mozilla causes log growth that is more than six times larger
than the growth in the underlying file system. Even worse, deleting
the Mozilla directory tree (with rm -Rf) generates 1432 MB of log
data! The source of this log growth is repeated, synchronous updates
to file system structures such as free block lists, inodes, and
directory contents.
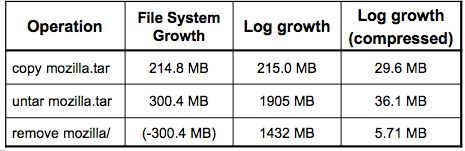 Table 4: Log inflation: Operations that greatly
modify the file system directory structure generate a large number
of log writes. Fortunately, the writes are highly redundant and
amenable to compression.
We have considered two possibilities for combating log inflation. One
possibility is compression. The contents of meta-data operations are
highly redundant, and therefore would exhibit significant size
reductions (as shown in Figure 4). A second
possibility is to temporarily deactivate versioning - for example,
using heuristics similar to those employed by the Elephant file
system [30]. We have not yet experimented with or
implemented either of these strategies.
Table 4: Log inflation: Operations that greatly
modify the file system directory structure generate a large number
of log writes. Fortunately, the writes are highly redundant and
amenable to compression.
We have considered two possibilities for combating log inflation. One
possibility is compression. The contents of meta-data operations are
highly redundant, and therefore would exhibit significant size
reductions (as shown in Figure 4). A second
possibility is to temporarily deactivate versioning - for example,
using heuristics similar to those employed by the Elephant file
system [30]. We have not yet experimented with or
implemented either of these strategies.
5.3 Debug execution time
Because Chronus uses binary search, it can discover configuration
errors in a logarithmic number of steps. Figure 12
shows Chronus's convergence time for logs of various sizes. The test
uses an internal probe that tests for the existence of a particular
file. Chronus currently requires roughly 20 seconds to conduct a
single probe. More than half this time is devoted to file system
consistency check (fsck) operations, which we must do twice
for each probe - once before installing the probe, and once to
extract the result. Moving to a journaling file system would
substantially reduce this overhead.
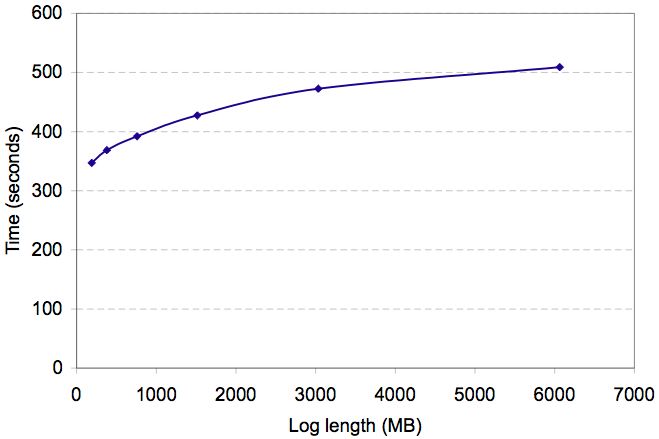 Figure 12: Debug execution time: The runtime grows
logarithmically with log size.
Figure 12: Debug execution time: The runtime grows
logarithmically with log size.
6 Related Work
We now discuss related work in problem diagnosis and resolution. We
first discuss history-based resolution techniques, and then we discuss
other techniques.
6.1 History-based problem resolution
Researchers have proposed versioning storage systems at various levels
of abstraction [25,30,31,32,14]. In some
cases, recovery from configuration errors has been cited as a
driving application. The VMWare virtual machine monitor [33]
also supports checkpointing to enable safe recovery. Unlike Chronus,
these systems do not perform
failure diagnosis. As a result, the user is forced to undo
all state changes that occurred after the error.
Chronus helps to reveal the specific failure cause, enabling recovery
with minimal lost state.
The Operator Undo work [8] attempts to recover lost
state by invoking an application-specific replay procedure. In a
similar vein, Windows XP restore [24] allows
developers to exert some control over which state is included in state
snapshots. Both of these approaches, being application specific, are
less general than Chronus. Also, these techniques have side effects,
which can further corrupt system state. For example, Windows Restore
may inadvertently re-introduce a virus into the system.
The Backtracker tool [22] maintains an operating system
causal history log. Such a tool could address one of Chronus's
current shortcomings, which is its inability to extract semantically
relevant debugging information from the child virtual machine. For
example, Chronus might discover that an application failure was caused
by an update to a particular dynamic library. Given this starting point,
a Backtracker-like tool could determine that the library change was
caused by the installation of an unrelated application.
Several research efforts have extended programming language debuggers
with the ability to perform time-travel or backwards
execution [6]. These systems tend to have high
overhead or long replay times, depending on the extent to which they
rely on checkpointing or logging. In addition, these systems are tied
to a particular language or runtime environment. Chronus detects
configuration errors that span applications and the OS, and it does so
with tolerable overhead by recording only those changes that reach
stable storage.
Delta-debugging [36] applies search techniques to
the problem of localizing source code edits that induced a failure.
Delta-debugging does not assume changes are ordered, and much of the
system's complexity derives from having to prune an exponentially
large search space. The challenges for Chronus relate to capturing
and replaying complete system states using time-travel disks and
virtual machines.
The STRIDER [34] project uses periodic snapshots of the
Windows registry to reveal configuration errors. Unlike Chronus,
STRIDER monitors a single execution of a failing program,
during which it records the registry keys that are accessed by the
faulty process. STRIDER requires registry-specific heuristics to
prune the search space: for example, registry keys that differ across
machines are less likely to be at fault. STRIDER does not detect
indirect dependencies that result from interactions with helper
processes or the operating system. For example, STRIDER cannot reveal
errors related to TCP/IP parameters or firewall policy.
6.2 Other problem resolution techniques
A direct strategy for automated debugging is to construct a software
agent that embodies the knowledge of a human
expert [3]. The limitation of such systems is that
they are only as good as their initial diagnosis heuristics. Complex
systems generate unexpected errors. Chronus can capture these errors
by operating beneath the layer of operating system and application
semantics.
The No-Futz [21] computing initiative advocates a principled
approach to maintaining configuration state. For example, the authors
advocate making individual configuration parameters orthogonal to
limit the effect of unintended side effects. While this is a
worthwhile goal, the tight integration of today's application and
system functionality suggests that debugging techniques will still be
necessary when inevitable failures occur.
Redstone et al. proposed a model of automated debugging that extracts
relevant system state and symptoms to serve as a query against a
database of known problems [27]. A challenge for
such a system is constructing a database and query format that yield
meaningful results. Chronus avoids using databases by directly
"querying" the system state at a previous instant in time. The
results returned by our system may be more relevant because they
pertain exclusively to the system under consideration.
Several recent projects have investigated path-based debugging of
distributed systems [10,1]. These
systems log the interactions between components or nodes of a
distributed system. By applying statistical techniques to these
traces, it is possible to extract some information of interest, e.g.,
localizing performance problems or detecting an incipient system
failure. These systems depend on the ability to extract large volumes
of trace data showing the integration between distributed components.
Chronus is useful in situations where these assumptions are not
satisfied, e.g., desktop personal computers.
7 Future Work
Although functional, our Chronus prototype could be extended in
numerous ways. One area of interest is extending mDenali and
Chronus beyond a UNIX environment. In particular, systems based on
Microsoft Windows are likely to exhibit qualitatively different
configuration errors. We are also interested in extending Chronus
with different time-travel storage mechanisms. For example, some
administrators use CVS to maintain a log of configuration changes.
Chronus could use CVS check-ins to reconstruct previous system states.
Chronus is not a fully automatic tool: the troubleshooter must supply
a software probe and interpret the state change that induced the
failure. It may be possible to reduce this manual effort by combining
Chronus with related research efforts. For example, capture/replay
tools could automate probe creation [20], and
Backtracker [22] could simplify end-to-end diagnosis by
mapping from a low-level state change to a high-level action.
A final area for future work is to perform a more complete evaluation
of Chronus. Our work to date has focused on a small number of case
studies representing "common" configuration errors. Although our
initial results are promising, we do not have enough data about
configuration errors in the wild to make strong claims about the
applicability of Chronus. An even harder challenge is to measure the
"usefulness" of our tool. In the end, a complete evaluation of
Chronus will likely require a user study, since simulating a human
operator is intractable. Work by Brown et al. provides a starting
point for such an effort [9].
8 Conclusions
Software systems often break. When they do, diagnosing the cause of
failure can be difficult, especially when the application depends on a
wide range of system-level and user-level functionality. Existing
automated approaches based on expert systems can only handle error
cases that are known in advance. Human experts can leverage intuition
to solve unforeseen problems, but manual diagnosis requires
significant expertise, which ultimately translates into substantial
cost.
This paper has described Chronus, a tool for automating the diagnosis
of configuration errors caused by a state change. Chronus represents
a novel synthesis of existing techniques: versioning storage systems,
virtual machine monitors, testing, and search. Chronus reduces the
burden on human experts from complete diagnosis ("why is the system
not working") to testing for correctness ("is the system
working?"). Our experience to date suggests that Chronus is a
valuable tool for a significant class of configuration errors.
9 Acknowledgments
We thank our shepherd, Timothy Roscoe, for his guidance, and Ed
Lazowska, Neil Spring, Marianne Shaw, and Andrew Schwerin for their
insightful comments. We also thank Phil Levis for giving us pointers
to valuable related work. This research was supported in part by NSF
Career award ANI-0132817, funding from Intel Corporation, and a gift
from Nortel Networks.
References
- [1]
-
M.K. Aguilera, J.C. Mogul, J.L. Wiener, P. Reynolds, and A. Muthitacharoen.
Performance debugging for distributed systems of black boxes.
In Proceedings of the 19th ACM Symposium on Operating
System Principles, 2003.
- [2]
-
M.G. Baker, J.H. Hartman, H.D. Kupfer, K.W. Shirriff, and J.K. Ousterhout.
Measurements of a distributed file system.
In Proceedings of the thirteenth ACM symposium on Operating
systems principles, 1991.
- [3]
-
G. Banga.
Auto-diagnosis of field problems in an appliance operating system.
In Proceedings of the USENIX Annual Technical Conference, June
2000.
- [4]
-
P. Barham, B. Dragovic, K. Fraser, S. Hand, T. Harris, A. Ho, R. Neugebauer,
I. Pratt, and A. Warfield.
Xen and the art of virtualization.
In Proceedings of the 19th Symposium on Operating System
Principles (SOSP 2003), Bolton Landing, NY, October 2003.
- [5]
-
S. Beattie, S. Arnold, C. Cowan, P. Wagle, C. Wright, and A. Shostack.
Timing the application of security patches for optimal uptime.
In Proceedings of the Sixteenth USENIX LISA Conference,
November 2002.
- [6]
-
B. Boothe.
Efficient algorithms for bidirectional debugging.
In Proceedings of the ACM Conference on Programming Language
Design and Implementation, 2000.
- [7]
-
R. Bowen and K. Coar.
Apache Cookbook.
O'Reilly and Associates, November 2003.
- [8]
-
A.A. Brown and D.A. Patterson.
Undo for operators: Building an undoable e-mail store.
In Proceedings of the 2003 USENIX Annual Technical Conference,
June 2003.
- [9]
-
A.B. Brown, L. Chung, W. Kakes, C. Ling, and D.A. Patterson.
Experiences with evaluation human-assisted recovery processes.
In Proceedings of the International Conference on Dependable
Systems and Networks, June 2004.
- [10]
-
M.Y. Chen, A. Accardi, E. Kiciman, D. Patterson, A. Fox, and E. Brewer.
Path-based failure and evolution management.
In Proceedings of the First Symposium on Network Systems Design
and Implementation, March 2004.
- [11]
-
Peter M. Chen and Brian D. Noble.
When virtual is better than real.
In Proceedings of the Workshop on Hot Topics in Operating
Systems, May 2001.
- [12]
-
Final Report of the CRA Conference on Grand Research Challenges in Information
Systems.
https://www.cra.org/reports/gc.systems.pdf, 2003.
- [13]
-
R.J. Creasy.
The origin of the VM/370 time-sharing system.
IBM Journal of Research and Development, 25(5), 1981.
- [14]
-
Version management with CVS.
https://www.cvshome.org/docs/manual/.
- [15]
-
G.W. Dunlap, S.T. King, S. Cinar, M. Basrai, and P.M. Chen.
ReVirt: Enabling intrusion analysis through virtual-machine
logging and replay.
In Proceedings of the 2002 Symposium on Operating Systems Design
and Implementation (OSDI 2002), Boston, MA, December 2002.
- [16]
-
J. Gemmell, G. Bell, R. Lueder, S. Drucker, and C. Wong.
MyLifeBits: Fulfilling the Memex vision.
In ACM Multimedia, December 2002.
- [17]
-
Jim Gray.
Why do computers stop and what can be done about it ?
In Proceedings of the 5th Symposium on Reliablity in Distributed
Software and Database systems, January 1986.
- [18]
-
E. Growchowski.
Emerging trends in data storage on magnetic hard disk drives.
Datatech, 1998.
- [19]
-
J. Hart and J. D'Amelia.
An analysis of RPM validation drift.
In Proceedings of the USENIX LISA Conference, 2002.
- [20]
-
J.H. Hicinbothom and W.W. Zachary.
A tool for automatically generating transcripts of human-computer
interaction.
In Proceedings of the Human Factors and Ergonomics Society 37th
Annual Meeting, 1993.
- [21]
-
D.A. Holland, W. Josephson, K. Magoutis, M. Seltzer, C.A. Stein, and A. Lim.
Research issues in no-futz computing.
In Proceedings of the 8th Workshop on Hot Topics in Operating
Systems, May 2001.
- [22]
-
Samuel T. King and Peter M. Chen.
Backtracking intrusions.
In Proceedings of the 19th Symposium on Operating System
Principles (SOSP 2003), Bolton Landing, NY, October 2003.
- [23]
-
Marshall Kirk McKusick, Bill Joy, Leffler, and Fabry.
A Fast File System for UNIX.
ACM Transactions on Computer Systems, 2(3), 1984.
- [24]
-
Microsoft, Inc.
Windows XP system restore.
https://msdn.microsoft.com/library/default.asp?URL=/library/techart/windowsxpsystemrestore.htm, April 2001.
- [25]
-
C.B. Morrey and D. Grunwald.
Peabody: The time travelling disk.
In 20th IEEE/11th NASA Goddard Conference on Mass Storage
Systems and Technologies, April 2003.
- [26]
-
Mozilla FAQ: Using mozilla.
https://mozilla.gunnars.net/mozfaq_use.html.
- [27]
-
Joshua A. Redstone, Michael M. Swift, and Brian N. Bershad.
Using computers to diagnose computer problems.
In Proceedings of the 9th Workshop on Hot Topics in Operating
Systems, 2003.
- [28]
-
Mendel Rosenblum and John K. Ousterhout.
The design and implementation of a log-structured file system.
In Proceedings of the 13th ACM Symposium on Operating Systems
Principles, 1991.
- [29]
-
S.J. Russell and P. Norvig.
Artificial Intelligence: A Modern Approach.
Prentice Hall, 2nd edition, December 2002.
- [30]
-
D.S. Santry, M.J. Feeley, N.C. Hutchinson, A.C. Veitch, R.W. Carton, and
J. Ofir.
Deciding when to forget in the Elephant file system.
In Proceedings of the 17th ACM Symposium on Operating Systems
Principles (SOSP'99), December 1999.
- [31]
-
C.A.N. Soules, G.R. Goodson, J.D. Strunk, and G.R. Ganger.
Metadata efficiency in versioning file systems.
In Proceedings of the 2nd USENIX conference on file and
storage technologies, March 2003.
- [32]
-
M. Stonebreaker.
The design of the POSTGRES storage system.
In Proceedings of the 13th International Conference on Very
Large Databases, September 1987.
- [33]
-
VMware, Inc.
VMware virtual machine technology.
https://www.vmware.com/.
- [34]
-
Y. Wang, C. Verbowski, J. Dunagan, Y. Chen, H.J. Wang, C. Yuan, and Z. Zhang.
STRIDER: A black-box, state-based approach to change and
configuration management and support.
In Proceedings of the USENIX LISA Conference, October 2003.
- [35]
-
Andrew Whitaker, Richard S. Cox, Marianne Shaw, and Steven D. Gribble.
Constructing services with interposable virtual hardware.
In Proceedings of the First Symposium on Network Systems Design
and Implementation, March 2004.
- [36]
-
A. Zeller.
Yesterday, my program worked. Today, it does not. Why?
In Proceedings of the 7th European Software Engineering
Conference, September 1999.
File translated from
TEX
by
TTH,
version 3.63.
On 4 Oct 2004, 15:19.
|
