| ||||||||||||||||||||||||||||||||||||||||||||||||||||
|
NSDI '05 Paper
[NSDI '05 Technical Program]
|
 |
Based on the performance model, we explore ways that it can assist various system management functions for online services. First, we examine component placement and replication strategies that can achieve high performance with given hardware resources. Additionally, our model can be used to estimate resource needs to support projected future workload or to analyze the cost-effectiveness of hypothetical hardware platforms. Although many previous studies have addressed various system management functions for online services [5,6,10,31], they either deal with single application components or they treat a complex application as a non-partitionable unit. Such an approach restricts the management flexibility for multi-component online services and thus limits their performance potentials.
The rest of this paper is organized as follows. Section 2 describes our profiling techniques to characterize application resource needs and component interactions. Section 3 presents the throughput and response time models for multi-component online services. Section 4 validates our model using two J2EE-based applications on a heterogeneous Linux cluster. Section 5 provides case examinations on model-based component placement, capacity planning, and cost-effectiveness analysis. Section 6 describes related work. Section 7 concludes the paper and discusses future work.
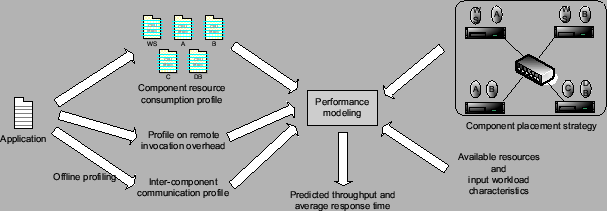
Due to the complexity of multi-component online services, an accurate performance model requires the knowledge of application characteristics that may affect the system performance under any possible component placement strategies. Our application profile captures three such characteristics: per-component resource needs (Section 2.1), the overhead of remote invocations (Section 2.2), and the inter-component communication delay (Section 2.3).
We perform profiling through operating system instrumentation to achieve transparency to the application and component middleware. Our only requirement on the middleware system is the flexibility to place components in ways we want. In particular, our profiling does not modify the application or the component middleware. Further, we treat each component as a blackbox (i.e., we do not require any knowledge of the inner-working of application components). Although instrumentation at the application or the component middleware layer can more easily identify application characteristics, our OS-level approach has wider applicability. For instance, our approach remains effective for closed-source applications and middleware software.
A component profile specifies component resource needs as functions of
input workload characteristics. For time-decaying resources such as CPU
and disk I/O bandwidth, we use the average rates
![]() cpu and
cpu and
![]() disk to capture the resource requirement specification.
On the other hand, variation in available memory size often has a severe
impact on application performance. In particular, a memory deficit during
one time interval cannot be compensated by a memory surplus in the
next time interval. A recent study by Doyle et al. models the
service response time reduction resulting from increased memory cache size
for Web servers serving static content [12]. However,
such modeling is only feasible with intimate knowledge about application
memory access pattern. To maintain the general applicability of our
approach, we use the peak usage
disk to capture the resource requirement specification.
On the other hand, variation in available memory size often has a severe
impact on application performance. In particular, a memory deficit during
one time interval cannot be compensated by a memory surplus in the
next time interval. A recent study by Doyle et al. models the
service response time reduction resulting from increased memory cache size
for Web servers serving static content [12]. However,
such modeling is only feasible with intimate knowledge about application
memory access pattern. To maintain the general applicability of our
approach, we use the peak usage
![]() mem for specifying the memory
requirement in the component profile.
mem for specifying the memory
requirement in the component profile.
The input workload specifications in component profiles can be parameterized
with an average request arrival rate
![]() workload and other
workload characteristics
workload and other
workload characteristics
![]() workload including the request
arrival burstiness and the composition of different request types (or request
mix). Putting these altogether, the resource requirement profile for a
distributed application component specifies the following mapping
workload including the request
arrival burstiness and the composition of different request types (or request
mix). Putting these altogether, the resource requirement profile for a
distributed application component specifies the following mapping
![]() :
:
We use a modified Linux Trace Toolkit (LTT) [38] for our profiling. LTT instruments the Linux kernel with trace points, which record events and forward them to a user-level logging daemon through the relayfs file system. We augmented LTT by adding or modifying trace points at CPU context switch, network, and disk I/O events to report statistics that we are interested in. We believe our kernel instrumentation-based approach can also be applied for other operating systems. During our profile runs, each component runs on a dedicated server and we measure the component resource consumption at a number of input request rates and request mixes.
Profiling measurements were conducted on a Linux cluster connected by a 1Gbps Ethernet switch. Each profiling server is equipped with a 2.66GHz Pentium 4 processor and 512MB memory. For the two applications, the EJB components are hosted on a JBoss 3.2.3 application server with an embedded Tomcat 5.0 servlet container. The database server runs MySQL 4.0. The dataset for each application is sized according to database dumps published on the benchmark Web sites [28,34].
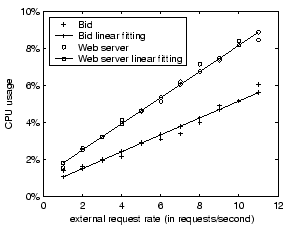
After acquiring the component resource consumption at the measured input rates, we derive general functional mappings using linear fitting. Figure 2 shows such a derivation for the Bid component and the Web server in RUBiS. The results are for a request mix similar to the one in [9] (10% read-write requests and 90% read-only requests). The complete CPU profiling results for all 11 RUBiS components and 7 StockOnline components are listed in Table 1 and Table 2 respectively. We do not show the memory and disk I/O profiling results for brevity. The memory and disk I/O consumption for these two applications are relatively insignificant and they never become the bottleneck resource in any of our test settings.
Remote component invocations incur CPU overhead on tasks such as message passing, remote lookup, and data marshaling. When the interacting components are co-located on the same server, the component middleware often optimizes away these tasks and some even implement local component invocations using direct method calls. As a result, the invocation overhead between two components may vary depending on how they are placed on the hosting cluster. Therefore, it is important to identify the remote invocation costs such that we can correctly account for them when required by the component placement strategy.
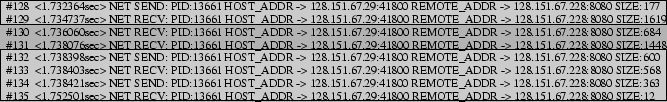
It is challenging to measure the remote invocation overhead without assistance from the component middleware. Although kernel instrumentation tools such as LTT can provide accurate OS-level statistics, they do not directly supply middleware-level information. In particular, it is difficult to differentiate CPU usage of normal component execution from that of passing a message or serving a remote lookup query. We distinguish the remote invocation cost of component A invoking component B in a three step process. First, we isolate components A and B on separate machines. Second, we intercept communication rounds initiated by component A. We define a communication round as a sequence of messages between a pair of processes on two different machines in which the inter-message time does not exceed a threshold. Finally, we associate communication rounds with invocations. Thus, the remote invocation cost incurred between components A and B is the sum of resource usage during communication rounds between them. Since the components are isolated during the profiling, communication rounds are not likely to be affected by network noises.
 |
We profile component interaction patterns that may affect bandwidth usage and network service delay between distributed application components. We measure inter-component bandwidth consumption by intercepting all network messages between components during off-line profile runs. Note that the bandwidth usage also depends on the workload level, particularly the input user request rate. By measuring bandwidth usage at various input request rates and performing linear fitting, we can acquire per-request communication data volume for each inter-component link.
The processing of a user request may involve multiple blocking round-trip communications (corresponding to request-response rounds) along many inter-component links. We consider the request processing network delay as the sum of the network delays on all inter-component links between distributed components. The delay on each link includes the communication latency and the data transmission time. Inter-component network delay depends on the link round-trip latency and the number of blocking round-trip communications between components. We define a round trip as a synchronous write-read interaction between two components.
 |
|
Due to the lack of knowledge on the application behavior, it is challenging to identify and count blocking round trip communications at the OS level. Our basic approach is to intercept system calls involving network reads and writes during profile runs. System call interception provides the OS-level information nearest to the application. We then count the number of consecutive write-read pairs in the message trace between two components. We also compare the timestamps of consecutive write-read pairs. Multiple write-read pairs occurring within a single network round-trip latency in the profiling environment are counted as only one. Such a situation could occur when a consecutive write-read pair does not correspond to each other in a blocking interaction. Figure 4 illustrates our approach for identifying blocking round trip communications. To avoid confusion among messages belonging to multiple concurrent requests, we process one request at a time during profile runs.
Non-Linear functional mappings. In our application studies, most of the workload parameter (e.g., request arrival rate) to resource consumption mappings follow linear functional relationships. We acknowledge that such mappings may exhibit non-linear relationships in some cases, particularly when concurrent request executions affect each other's resource consumption (e.g., extra CPU cost due to contention on a spin-lock). However, the framework of our performance model is equally applicable in these cases, as long as appropriate functional mappings can be extracted and included in the application profile. Non-linear fitting algorithms [4,30] can be used for such a purpose. Note that a non-linear functional mapping may require more workload samples to produce an accurate fitting.
Profiling cost.
To improve measurement accuracy, we place each profiled component on a
dedicated machine. This eliminates the interference from co-located components
without the need of complex noise-reduction techniques [8].
However, the profiling of isolated components imposes a large demand on the
profiling infrastructure (i.e., the cluster size equals the number of
components). With a smaller profiling infrastructure, it would require multiple
profile runs that each measures some components or inter-component links.
At a minimum, two cluster nodes are needed for per-component resource
consumption profiling (one for the profiled component and the other for the rest)
and three machines are required to measure inter-component communications.
At these settings for an ![]() -component service, it would take
-component service, it would take ![]() profile runs
for per-component measurement and
profile runs
for per-component measurement and
![]() runs for inter-component
communication profiling.
runs for inter-component
communication profiling.
We present our performance model for cluster-based multi-component online services. The input of our model includes the application profile, workload properties, available resources in the hosting platform, as well as the component placement and replication strategy. Below we describe our throughput prediction (Section 3.1) and response time prediction (Section 3.2) schemes. We discuss several remaining issues about our performance model in Section 3.3.
Our ability to project system throughput under each component placement strategy can be illustrated by the following three-step process:
The service response time for a cluster-based online service includes two elements: 1) the request execution time and the queueing time caused by resource competition; and 2) network delay due to blocking inter-component communications.
The average response time at each server can be estimated as follows under the M/G/1 queuing model:
![$\displaystyle E[r] = E[e] + \frac{\rho E[e] ( 1 + C_e^2)}{2(1-\rho)}
$](img25.png)
The average request execution time at each component is the resource
needs per request at very low request rate (when there is no resource
competition or queuing in the system). The average request execution
time at each server ![]() is the sum of such time for all hosted
components. The workload intensity at each server
is the sum of such time for all hosted
components. The workload intensity at each server ![]() can be
derived from the component resource needs and the set of components
that are placed at the server in question. The coefficient of
variation of the request execution time
can be
derived from the component resource needs and the set of components
that are placed at the server in question. The coefficient of
variation of the request execution time ![]() can be determined with
the knowledge of its distribution. For instance,
can be determined with
the knowledge of its distribution. For instance, ![]() if the request
execution time follows an exponential distribution. Without the
knowledge of such distribution, our application profile maintains an
histogram of execution time samples for each component and we then use
these histograms to determine
if the request
execution time follows an exponential distribution. Without the
knowledge of such distribution, our application profile maintains an
histogram of execution time samples for each component and we then use
these histograms to determine ![]() for each server under a particular
placement strategy.
for each server under a particular
placement strategy.
![$\displaystyle \Gamma = \sum_{\text{for each non-local inter-component link } l} [\kappa_l \cdot \gamma_l + \frac{\nu_l}{\omega_l}]
$](img35.png)
Cache pollution due to component co-location. When components are co-located, interleaved or concurrent execution of multiple components may cause processor cache pollution on the server, and thus affect the system performance. Since modern operating systems employ affinity-based scheduling and large CPU quanta (compared with the cache warm-up time), we do not find cache pollution to be a significant performance factor. However, processor-level multi-threading technologies such as the Intel Hyper-Threading [19] allow concurrent threads executing on a single processor and sharing level-1 processor cache. Cache pollution is more pronounced on these architectures and it might be necessary to model such cost and its impact on the overall system performance.
Replication consistency management. If replicated application states can be updated by user requests, mechanisms such as logging, undo, and redo may be required to maintain consistency among replicated states. Previous studies have investigated replication consistency management for scalable online services [15,29,32,39]. Consistency management consumes additional system resources which our current model does not consider. Since many component middleware systems in practice do not support replication consistency management, we believe this limitation of our current model should not severely restrict its applicability.
Cross-architecture performance modeling. A service hosting cluster may comprise servers with multiple types of processor architectures or memory sizes. Our current approach requires application profiling on each of the architectures present in the cluster. Such profiling is time consuming and it would be desirable to separate the performance impact of application characteristics from that of server properties. This would allow independent application profiling and server calibration, and thus significantly save the profiling overhead for server clusters containing heterogeneous architectures. Several recent studies [22,33] have explored this issue in the context of scientific computing applications and their results may be leveraged for our purpose.
|
We perform measurements to validate the accuracy of our throughput and response time prediction models. An additional objective of our measurements is to identify the contributions of various factors on our model accuracy. We are particularly interested in the effects of the remote invocation overhead modeling and the network delay modeling.
Our validation measurements are based on the RUBiS and StockOnline applications described in Section 2.1. The application EJB components are hosted on JBoss 3.2.3 application servers with embedded Tomcat 5.0 servlet containers. The database servers run MySQL 4.0. Although MySQL 4.0 supports master/slave replication, the JBoss application server cannot be configured to access replicated databases. Therefore we do not replicate the database server in our experiments.
All measurements are conducted on a 20-node heterogeneous Linux cluster
connected by a 1Gbps Ethernet switch. The roundtrip latency (UDP or TCP
without connection setup) between two cluster nodes takes around 150![]() .
The cluster nodes have three types of hardware configurations. Each type-1
server is equipped with a 2.66GHz Pentium 4 processor and 512MB memory.
Each type-2 server is equipped with a single 2.00GHz Xeon processor and
512MB memory. Each type-3 server is equipped with two 1.26GHz Pentium III
processors and 1GB memory. All application data is hosted on two local
10KRPM SCSI drives at each server.
.
The cluster nodes have three types of hardware configurations. Each type-1
server is equipped with a 2.66GHz Pentium 4 processor and 512MB memory.
Each type-2 server is equipped with a single 2.00GHz Xeon processor and
512MB memory. Each type-3 server is equipped with two 1.26GHz Pentium III
processors and 1GB memory. All application data is hosted on two local
10KRPM SCSI drives at each server.
 |
The performance of a cluster-based online service is affected by many factors, including the cluster size, the mix of input request types, the heterogeneity of the hosting servers, as well as the placement and replication strategy. Our approach is to first provide detailed results on the model accuracy at a typical setting (Section 4.1) and then explicitly evaluate the impact of various factors (Section 4.2). We summarize our validation results in Section 4.3.
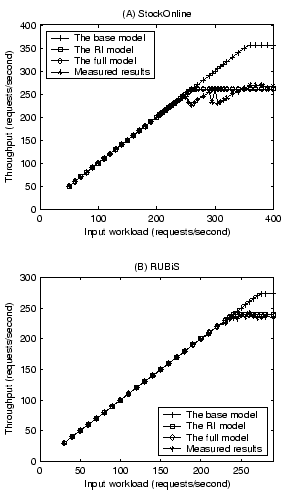
The measurement results in this section are based on a 12-machine service cluster (four are type-1 and the other eight are type-2). For each application, we employ an input request mix with 10% read-write requests and 90% read-only requests. The placement strategy for each application we use (shown in Table 3) is the one with highest modeled throughput out of 100 random chosen candidate strategies. We compare the measured performance with three variations of our performance model:
Figure 6 shows validation results on the overall system throughput for StockOnline and RUBiS. We measure the rate of successfully completed requests at different input request rate. In our experiments, a request is counted as successful only if it returns within 10 seconds. Results show that our performance model can accurately predict system throughput. The error for RUBiS is negligible while the error for StockOnline is less than 13%. This error is mostly attributed to instable results (due to timeouts) when the system approaches the saturation point. There is no difference between the prediction of the RI model and that of the full model. This is expected since the network delay modeling does not affect the component resource needs and subsequently the system throughput. Comparing between the full model and the base model, we find that the modeling of remote invocation overhead has a large impact on the prediction accuracy. It improves the accuracy by 36% and 14% for StockOnline and RUBiS respectively.
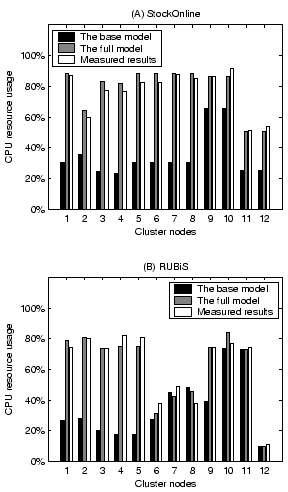
Since the system throughput in our model is derived from resource usage at each server, we further examine the accuracy of per-node resource usage prediction. Figure 7 shows validation results on the CPU resource usage at the input workload rate of 230 requests/second (around 90% workload intensity for both applications). We do not show the RI model since its resource usage prediction is the same as the full model. Comparing between the full model and the base model, we find that the remote invocation overhead can be very significant on some of the servers. The failure of accounting it results in poor performance prediction of the base model.
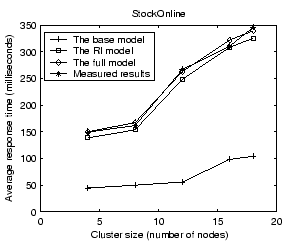 |
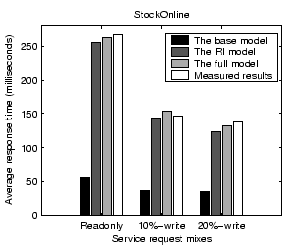
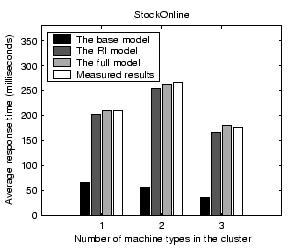
Figure 8 shows validation results on the average service response time for StockOnline and RUBiS. For each application, we show the average response time when the input workload is between 50% and 90% of the saturation throughput, defined as the highest successful request completion rate achieved at any input request rate. Results show that our performance model can predict the average response time with less than 14% error for the two applications. The base model prediction is very poor due to its low resource usage estimation. Comparing between the full model and the RI model, we find that the network delay modeling accounts for an improved accuracy of 9% and 18% for StockOnline and RUBiS respectively.
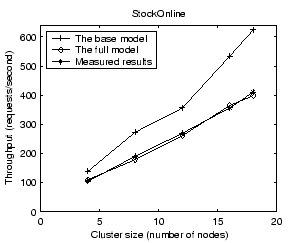
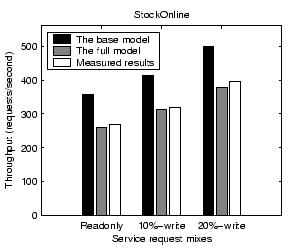
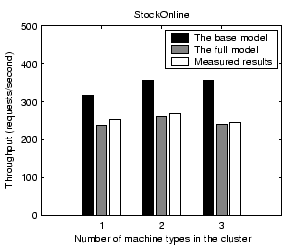
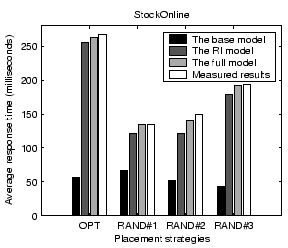
We examine the impact of various factors on the accuracy of our performance model. When we vary one factor, we keep other factors unchanged from settings in Section 4.1.
 |
 |
 |
|
We explore how our performance model can be used to assist system management functions for multi-component online services. A key advantage of model-based management is its ability to quickly explore the performance tradeoff among a large number of system configuration alternatives without high-overhead measurements. Additionally, it can project system performance at hypothetical settings.
Our objective is to discover a component placement and replication strategy that achieves high performance on both throughput and service response time. More specifically, our target strategy should be able to support a large input request rate while still maintaining an average response time below a specified threshold. Our model proposed in this paper can predict the performance with any given component placement strategy. However, the search space of all possible placement strategies is too large for exhaustive check. Under such a context, we employ optimization by simulated annealing [21,24]. Simulated annealing is a random sampling-based optimization algorithm that gradually reduces the sampling scope following an ``annealing schedule''.
We evaluate the effectiveness of our approach on a 12-node cluster (the same as in Section 4.1) using the StockOnline application. We set the response time threshold of our optimization at 1 second. The number of samples examined by our simulated annealing algorithm is in the order of 10,000 and the algorithm takes about 12 seconds to complete on a 2.00GHz Xeon processor. For comparison, we also consider a random sampling optimization which selects the best placement out of 10,000 randomly chosen placement strategies. Note that both of these approaches rely on our performance model.
For additional comparison, we introduce two placement strategies based on ``common sense'', i.e., without the guidance of our performance model. In the first strategy, we replicate all components (except the database) on all nodes. This is the suggested placement strategy in the JBoss application server documentation. High replication may introduce some overhead, such as the component maintenance overhead at each replica that is not directly associated with serving user requests. In the other strategy, we attempt to minimize the amount of replication while still maintaining balanced load. We call this strategy low replication. Table 4 lists the three placement strategies except all replication.
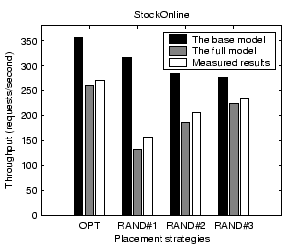
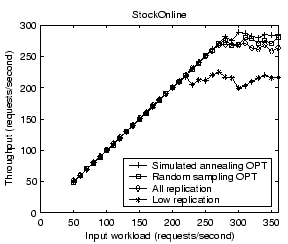
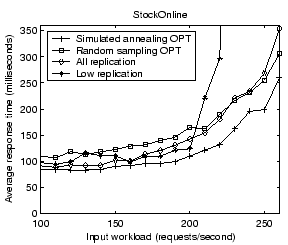
Figure 17 illustrates the measured system throughput under the above four placement strategies. We find that the simulated annealing optimization is slightly better than the random sampling approach. It outperforms all replication and low replication by 7% and 31% respectively. Figure 18 shows the measured average response time at different input workload rates. The response time for low replication rises dramatically when approaching 220 requests/second because it has a much lower saturation throughput than the other strategies. Compared with random sampling and all replication, the simulated annealing optimization achieves 22% and 26% lower response time, respectively, at the input workload rate of 250 requests/second.
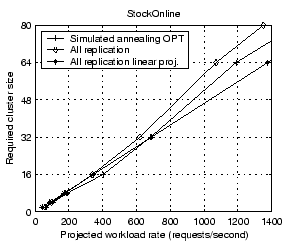
The ability of predicting future resource needs at forecast workload levels allows an online service provider to acquire resources in an efficient fashion. Figure 19 presents our capacity planning results for StockOnline on simulated annealing-optimized placement and all replication placement. The base platform for capacity planning is a 12-node cluster (four type-1 nodes and eight type-2 nodes). Our performance model is used to project resource needs at workload levels that could not be supported in the base platform. We assume only type-2 nodes will be added in the future. Previous work [23] has suggested linear projection-based capacity planning where future resource requirement scales linearly with the forecast workload level. For the comparison purpose, we also show the result of linear projection. The base performance for linear projection is that of all replication on the 12-node cluster.
Results in Figure 19 illustrate that our optimized strategy consistently saves resources compared with all replication. The saving is at least 11% for projected workload of 1000 requests/second or higher. Comparing between the modeled all replication and linearly projected all replication, we find that the linear projection significantly underestimates resource needs (by about 28%) at high workload levels. This is partially due to heterogeneity in the machines being employed. More specifically, four of the original nodes are type-1, which are slightly more powerful than the type-2 machines that are expected to be added. Additionally, linear projection fails to consider the increased likelihood of remote invocations at larger clusters. In comparison, our performance model addresses these issues and provides more accurate capacity planning.
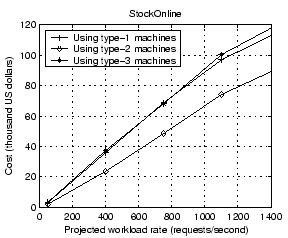
We provide a model-based cost-effectiveness analysis. In our evaluation, we plan to choose one of the three types of machines (described in the beginning of Section 4) to expand the cluster for future workloads. We examine the StockOnline application in this evaluation. Figure 20 shows the estimated cost when each of the three types of machines is employed for expansion. We acquire the pricing for the three machine types from www.epinions.com and they are $1563, $1030, and $1700 respectively. Although type-2 nodes are less powerful than the other types, it is the most cost-effective choice for supporting the StockOnline application. The saving is at least 20% for projected workload of 1000 requests/second or higher. Such a cost-effectiveness analysis would not be possible without an accurate prediction of application performance at hypothetical settings.
Previous studies have addressed application resource consumption profiling. Urgaonkar et al. use resource usage profiling to guide application placement in shared hosting platforms [36]. Amza et al. provide bottleneck resource analysis for several dynamic-content online service benchmarks [3]. Doyle et al. model the service response time reduction with increased memory cache size for static-content Web servers [12]. The Magpie tool chain actually extracts per-request execution control flow through online profiling [8]. The main contribution of our profiling work is that we identify a comprehensive set of application characteristics that can be employed to predict the performance of multi-component online services with high accuracy.
A very recent work by Urgaonkar et al. [35] models a multi-tier Internet service as a network of queues. Their view of service tiers is not as fine-grained as application components in our model. Additionally, service tiers are organized in a chain-like architecture while application components can interact with each other in more complex fashions. As a result, their model cannot be used to directly guide component-level system management such as distributed component placement. On the other hand, our approach uses a simple M/G/1 queue to model service delay at each server while their model more accurately captures the dependencies of the request arrival processes at different service tiers.
Recent studies have proposed the concept of component-oriented performance modeling [17,37]. They mainly focus on the design of performance characterization language for software components and the way to assemble component-level models into whole-application performance model. They do not describe how component performance characteristics can be acquired in practice. In particular, our study finds that the failure of accounting the remote invocation overhead can significantly affect the model accuracy.
Distributed component placement has been examined in a number of prior studies. Coign [18] examines the optimization problem of minimizing communication time for two-machine client-server applications. ABACUS [2] focuses on the placement of I/O-specific functions for cluster-based data-intensive applications. Ivan et al. examine the automatic deployment of component-based software over the Internet subjected to throughput requirements [20]. Most of these studies heuristically optimize the component placement toward a performance objective. In comparison, our model-based approach allows the flexibility to optimize for complex objectives (e.g., a combination of throughput and service response time) and it also provides an estimation on the maximum achievable performance.
This paper presents a profile-driven performance model for cluster-based multi-component online services. We construct application profiles characterizing component resource needs and inter-component communication patterns using transparent operating system instrumentation. Given a component placement and replication strategy, our model can predict system throughput and the average service response time with high accuracy. We demonstrate how this performance model can be employed to assist optimized component placement, capacity planning, and cost-effectiveness analysis.
In addition to supporting static component placement, our model may also be used to guide dynamic runtime component migration for achieving better performance. Component migration requires up-to-date knowledge of runtime dynamic workload characteristics. It also desires a migration mechanism that does not significantly disrupt ongoing service processing. Additionally, runtime component migration must consider system stability, especially when migration decisions are made in a decentralized fashion. We plan to investigate these issues in the future.
em
This document was generated using the LaTeX2HTML translator Version 2002 (1.62)
Copyright © 1993, 1994, 1995, 1996,
Nikos Drakos,
Computer Based Learning Unit, University of Leeds.
Copyright © 1997, 1998, 1999,
Ross Moore,
Mathematics Department, Macquarie University, Sydney.
The command line arguments were:
latex2html -split 0 -show_section_numbers -local_icons nsdi05.tex
The translation was initiated by Christopher Stewart on 2005-03-26
|
This paper was originally published in the
Proceedings of the 2nd Symposium on Networked Systems Design and Implementation,
May 2–4, 2005, Boston, MA, USA Last changed: 2 May 2005 aw |
|