
| Pp. 131-137 of the Proceedings |  |
This paper describes a new monitoring and event management concept. eEMU is a client-server system that provides for rapid development of monitoring agents. This is thanks to its messaging language that takes advantage of heuristic algorithms implemented in the eEMU server. As opposed to SNMP and other static monitoring methodologies used in system and application monitoring, eEMU takes a whole new approach by incorporating the dynamic aspect of application and system events into the very heart of the dynamic message processing server.
The society and industries are increasingly becoming dependent on computers. Consequently, system and application uptime management is becoming a critical issue. Performance of outsourcing companies is measured by SLAs (Service Level Agreements). With the advent of e-commerce on a global scale, ISPs are becoming 24x7 environments as well. It all calls for good, flexible and reliable monitoring tools that would allow to proactively keep uptimes at the highest level and at the same time measure performance of IT departments.
Monitoring tools must be simple, cross-platform, scalable and cost-effective. This, to my observation, is not the case with most available offerings. Utilities such as Big Brother are widespread since they are cost-effective open-source alternatives and they are relatively simple to use. Nevertheless, alarm presentation and agent technology in Big Brother does not bring any new major features compared to other expensive commercial offerings.
Enterprise offerings such as Tivoli, OpenView, BMC Patrol and Unicenter TNG use complex multilevel drill-down alarm representations. Multiple windows must be opened in order to identify the cause of an alarm. At the top level, alarms are usually represented with color-coded icons. Big Brother has borrowed this concept and offers color-coded button matrix for monitored resources with a drill-down option to find out more about some alarms. eEMU replaces color-coded icons with a simple intuitive interface called eEMU browser. Unlike other event viewers, the eEMU browser displays a single textual message for each event, not every event occurrence. Subsequent updates to the event merely update the existing message. As a result, a complete view of the enterprise is facilitated with a single message screen without a need to drill down for more information or consult the event log. By default, the eEMU browser displays only resources in ``alarm state''. It is based on the premise that ``normal state'' information is in most cases of little practical benefit.
eEMU was designed with modularity and integration in mind. Through scripting hooks to the event engine, integration with other management tools, such as OpenView or Unicenter TNG, is simple to achieve.
eEMU was developed by Jarra and Anna Voleynik of eEMUconcept after many years of experience on large datacenter sites. Its design was an effort to overcome shortcomings of other monitoring offerings and provide a simple, powerful tool. Around 80% of monitoring needs are application or site specific. Standard monitoring agents that come with other vendor's offerings will not monitor applications using off-the-shelf agent configurations. A well monitored site incorporates plenty of customisations that should be simple to make. Here, eEMU comes to the rescue by providing a message type arsenal that greatly simplifies the design of monitoring agents. In the resource ID section I will touch on the flexibility with which eEMU can process resource hierarchies. To date, eEMU has been providing the simplest agent development kit available, thanks to the fact that the alarm status is maintained by the eEMU server rather than by the agent. Most eEMU agents are so simple and small that they have been coined micro-agents.
The majority of the currently available tools are based on the premise that the agent ``remembers'' the state of resources it monitors. Consequently, agents are relatively complex programs that run as daemons and maintain either a status database or status files. eEMU works on the premise that all the status information is handled by the eEMU server. eEMU agents are simple scripts or programs that use the emsg program to send messages to the server. The emsg program is a simple executable that uses the eEMU protocol. The protocol is designed to deliver the necessary information to the server so that the server can maintain the status of monitored resources. The key attributes of each message are resource ID, time-to-live, and message type. There are multiple message types that implement the eEMU messaging language.
The eEMU server stores current alarms in an in-memory database. Alarm messages sent by agents are matched against the database contents to find out if the status of an alarm has changed. If so, the alarm status is updated. Each status change triggers an action script. For the action script, message attributes are facilitated as environment variables that can be used to take conditional actions or perform correlation of messages.
SNMP monitoring systems are known to produce UDP storms. This is partly caused by the fact that SNMP traps are not guaranteed to be delivered, therefore the SNMP manager must regularly poll for resource status as well. eEMU has been tested to easily monitor 100 systems on a 33 Kbps dialup line. This is due to the fact that the OK status is not transmitted and there is no polling necessary by the eEMU server. eEMU uses the TCP reliable protocol and any message delivery problems are quickly revealed through missing heart beats from the heart beat agent, which is an important part of every eEMU agent kit. eEMU has been tested to process 1000 messages a minute on a 400 MHz Pentium PC. On a large site with hundreds of nodes it may be easier to deploy 2 or 3 tiers of monitoring servers with a consolidation server at the top. Messages from middle tier servers can be selectively forwarded to the higher level server. To make a reasonable effort of delivering messages, emsg uses an exponential back-off for spacing out several connection attempts before giving up and returning a failure code. Consequently, out-of-band communication channel can be used by agents if the primary communication channel is down.
The user interface is represented by an intuitive event console called eEMU browser. The browser unifies the best of both worlds - drill-down icons and scrolling event screens. To enhance user communication, the browser allows the operators to not only annotate existing messages but send new ones as well. Technically, there is no difference between messages sent by scripting agents and messages send by operational staff. The whole purpose is to create an event flow between enterprise components and staff.
Figure 1 shows a list of alarms that are color-coded by severity for easy interpretation. The ``user root is logged in'' message is annotated with a change request number to indicate a scheduled work on the firewall.
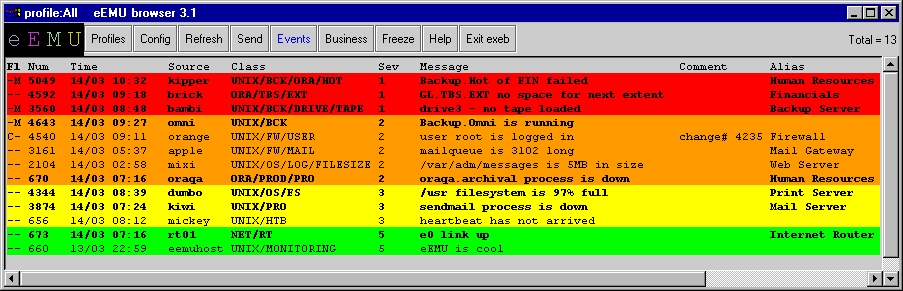
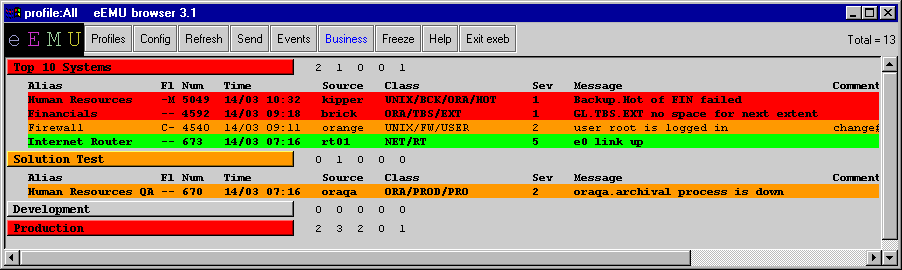
Figure 2 shows the business view mode with alarms logically grouped for a consolidated functional view of the enterprise. Alarms under a specific business group can be displayed by clicking the business group button.
In order to identify monitored resources, each resource is assigned an Object ID. For a simple Object ID processing, the Object ID must form the first word of each message. To uniquely identify a resource, we need a node name as well. Consequently, ``node_ name'':``Object ID'' form a Resource ID, which is a message key maintained by the eEMU server for every alarm. All references to existing alarms are done based on the Resource ID. Examples of Resource IDs are: web.dumbo.com.au:/usr or ps.porky.com.au:printer. sydney.accounts1.
If a new agent is written, its messages will be sent with its own resource ID. Therefore, the resource ID should fit into the existing resource ID hierarchy, just like SNMP OIDs are constructed based on a hierarchical principle. With eEMU there is no need to register the resource ID since the server doesn't need to know it in advance. It makes deployment of new agents and resource hierarchies an extremely simple task compared to SNMP agents. Today, systems and applications undergo a constant change, thus representing a very dynamic environment that calls for an equally dynamic monitoring tools.
If we start integrating eEMU with a call logging system, we will find that calls need to be logged once only for a specified resource problem. Later messages for that particular resource need to update the existing call only. Resource ID makes call logging possible.
Resource IDs are part of eEMU agents and can be part of the agent code or part of the agent configuration.
Time-to-live is a critical attribute of each message. It determines how long the message is kept in the status database maintained by the server. Let us demonstrate the time-to-live on a simple agent scenario. A filesystem agent runs every 5 minutes. It scans all the mounted filesystems and compares their utilisation with predefined thresholds. If a threshold is exceeded, a message to that effect is sent to the eEMU server. Time-to-live attached to the message will be set to 7 minutes. The server will store the message in the status database for the period of 7 minutes. If the message is not updated within 7 minutes, the server will delete it. The next filesystem agent run will occur 5 minutes later. It will send another message to the server if the offending filesystem's threshold is still exceeded. Since the previous message is still stored in the database (with 2 more minutes to live), the refresh message will re-set its life to 7 minutes. The situation repeats itself as long as the filesystem's threshold is exceeded. Once the problem is fixed, the message times-out and is removed from the status database by the server.
Time-to-live concept allows to transfer alarm status management responsibilities onto the server, thus tremendously offloading eEMU monitoring agents. The concept of time-to-live can also be used in the reverse sense as implemented in the sleep message type, described below.
The message class attribute was designed for flexible classification of resources, building business rules, event logging and escalation. The class can be used to hierarchically build classes or trees of resources and group them. The class attribute can decide which support group needs to know about the event and subsequently take action. Also, it may describe a resource hierarchy from the application or system point of view. Thus, class assists in both, the business escalation process (it adds a business layer to the message) and resource identification. Since the class attribute can be retrieved from within action scripts, it is trivial for administrators to implement conditional message processing based on the class string.
Message classes are part of eEMU agents and can be part of the agent code or part of the agent configuration.
Class examples are: /UNIX/PRD/FS, /NT/DEV/ ORA.
Analysis of monitoring agents behavior revealed that there are typical scenarios that repeat themselves. The findings prompted us to turn these scenarios into event message types, which resulted in the eEMU messaging language.
The eEMU messaging language and time-to-live are the key ingredients for making eEMU so simple to use. A fairly complex monitoring scenario can be expressed in a few lines of code.
Currently eEMU supports ten types of messages: normal, delete, count, sleep, wakeup, event, mask, query, comment and control.
The normal message is held in the status database for the time-to-live period, whereupon it is removed from the database if it is not refreshed. By setting time-to-live to slightly more than the agent polling interval, the message is guaranteed to stay in the status database for the duration of the alarm, thus reflecting alarm status.
The delete message can be sent to the server to delete a message.
The count message behaves similar to the normal message only it is in an inactive state until the message has been refreshed a predefined number of times. Each count message is accompanied with a ``lag'' value that indicates how many successive alarm messages need to be received before the resource status is changed. As an example, a system administrator is not usually interested in CPU reaching 100% for short periods of time. It becomes a problem only if the CPU utilisation is high consistently over longer periods of time. There are many resources exhibiting similar qualities, e.g. the swap space, network traffic and memory utilisation. Count messages are a powerful means for monitoring such resources.
The sleep message is kept inactive (sleeping) in the status database. It becomes active when it times out. Of course, it can be removed from the database with a delete message before the actual time-out. The premature sleep message removal is used in many scenarios such as backups. When a backup is started, a sleep message is sent to the eEMU server. Time-to-live of the sleep message is slightly greater than the maximum duration of the backup. At the end of the backup, the sleep message is deleted. There are two conditions under which the backup raises an alarm. The first is that the backup script failed or crashed. The second is that the backup is running overtime. Both conditions will be revealed by the sleep message timing out and becoming active.
One of the most interesting uses of the sleep message is a heart beat agent that monitors system uptime. E.g. the heart beat agent on node ``dumbo'' keeps sending heart beat messages, such as
$ emsg -o sleep -n eemuserver \
    -p 1965 -t 7m -s 1 -c /UNIX/HB \
    -w icecream -m "heart-beat is down"
The above message is sent to ``eemuserver'' listening on port 1965, time-to-live of 7 minutes, severity 1, class /UNIX/HB, password ``icecream'' and message ``heart-beat is down''. The resource ID is ``dumbo:heart-beat''.
With heart beat agents, no node discovery is necessary. The first heart beat registers the node with the eEMU server. If the node is down, the heart beat message is not refreshed. The server turns the sleep message into an active message that triggers an action and displays the alarm on the eEMU browser. Once the problem is fixed, the message goes to sleep again by switching its status to inactive. After giving some thought to the heart beat concept one finds out that it is completely self-maintained. Frequent adding of new nodes to a large monitored base is as easy as sending the first heart beat without touching the eEMU server configuration. Also, removing a node is as simple as deleting the heart beat sleep message from he eEMU database. Experience from large scale eEMU deployments has shown that heart beat agents are an extremely reliable means of detecting problems.
The wakeup message is used to wake up a sleep message. Let us suppose that there is a sleep message already in the database but we would like to expedite its time-out. It can be accomplished with a wakeup message.
The event message behaves just like the normal message with the difference that by default it does not show on the eEMU message browser. It is predominantly used to notify the eEMU server of an event and subsequently keep the event in the database for the event's duration. Event messages trigger action scripts and many times they are used just for that. At other times, a query message (described below) is used to query the status database for a particular event. E.g., a batch job on system A sends an event message to eEMU on successful completion. System B runs its batch job only on condition that the batch job on system A completed successfully. Before the batch job on system B runs, it first checks with a query message if an event that designates the system A batch job's successful completion exists.
The mask message instructs eEMU to mask out messages of a particular resource ID. The effect of the mask message is set for a time-to-live interval. It lends itself to scenarios such as when a backup shuts down an application that is being monitored. The application alarms can be masked out for the duration of the backup.
The query message has two main uses. The former use lies in querying the status database to find out about other alarms. This is handy for cross-system event correlation. The latter use lies in downloading files from the eEMU server. Central storage of files on the server can be used for software distribution purposes among others.
The comment message is used to annotate existing eEMU messages. IT staff can instantly provide information related to raised alarms, such as actions taken to correct existing alarms or reasons for scheduled downtimes.
The control message is used for administrative purposes
such as suspending the eEMU server.
eEMU Agents
eEMU agents have the eEMU messaging language at their disposal. The core of the agent is the emsg executable. In many cases, the agent code is a few lines of code. This is due to the intelligence built into various message types eEMU makes available.
Most monitoring systems rely on thick agents that maintain status of monitored resources. The agent technology can be tapped into by using a provided SDK (Software Development Kit). Apart from a need to have programming skills, administrators are bound to learn the API and develop agents that are not portable, depend on one vendor and are hard to maintain. With eEMU, the agents are typically simple scripts in a language of the administrator's choice. Due to the agent's simplicity and scripting language implementation, they are portable, developed in a rapid time-frame and easy to maintain. Moreover, eEMU agents can be simply scheduled through the UNIX cron or other scheduler, thus further simplifying the agent code.
To demonstrate eEMU features, below are a few scenarios and the way they can be tackled with eEMU.
A batch job run takes more than 10 minutes. If it is less than 10 minutes, the job terminated prematurely and we want to know about it. The following is the eEMU wrapper code:
emsg -n eemuserver -o "count 2" \
       -t 10m -c /VMS/BATCH \
       -m "batch_job failed"
start batch_job
emsg -n eemuserver -o "count 2" \
       -t -1 -C /VMS/BATCH \
       -m "batch_job failed"
Before the batch job is started, a count message with the lag value of
2 is sent to the server. This message will be sitting in the server in
an inactive state for 10 minutes and unless it is refreshed, it will
be deleted. Notice that the second emsg is sent for the same object
ID, namely batch_job, whereby the lag of the count message is also set
to 2. It means that if the first message is still in the database at
the time the second message arrives, the message will assume an active
state and displays in the eEMU browser.
A cold backup of an oracle database on system ``porky'' shuts the database down. Since the database processes are monitored with a process agent, we are inevitably going to receive an alarm that the database is down. In case of planned downtimes, we do not wish to receive alarm messages. Some monitoring systems offer a calendar feature that can be used to temporarily stop alarms from occurring. The problem is that a ``static'' calendar configuration needs to be attached to the alarm. With eEMU, message masking is dynamically adjusted to the oracle backup interval.
emsg -n eemuserver -h porky -o mask \
      -t 2h -c /PROD/ORA \
      -m "sap_oracle is down"
shutdown_oracle.sh
backup_oracle.sh
startup_oracle.sh
emsg -n eemuserver -o delete \
      -m "porky:sap_oracle"
The first emsg sends a mask message for the porky:sap_oracle resource ID. It will mask out sap_oracle alarm messages for 2 hours. Next, the database is shut down and a backup performed. After the backup has been completed, oracle is started up and the mask message deleted. A bonus is that if the backup runs overtime (more than 2 hours in this case), we will be alerted of the application being down beyond the backup window.
A CPU agent can be as small as the following single line:
eval `vmstat 1 3 | tail -1 | \
    awk '{if ($16 < 1) { print \
    "emsg -n eemuserv -p 1 965 \
     -c LINUX/CPU -t 7m -s 1 \
     -o \"count 5\" \
     -m \"CPU is 100% utilised\""}}'`
The above line retrieves the CPU idle time from a vmstat output and if the idle time is less than 1% it sends a count eEMU message with a lag of 5. If five such messages are received in a row, an alarm is raised.
In order to expand the usability of eEMU, the query message was equipped with a file download option. As a result, a file can be downloaded from the eEMU server. This feature can be used for software or script distribution but also for ad-hoc remote job execution. The following simple task distribution agent regularly (from cron) checks if there is a specific script in the download directory on the server. If there is a script for download, it is downloaded and executed.
RET=`emsg -n eemuserver \
    -p 1965 -w icecream -o query \
    -m "FILE dumbo.job" | \
    tee job_to_do.sh`
if [ "$RET" != "none" ];then
    chmod 700 job_to_do.sh
    job_to_do.sh
fi
In the above, the downloaded script is displayed by emsg on the
standard output and subsequently saved in job_to_do.sh for later
execution. If there is no script for download on the server, emsg
returns string ``none'' and the body of the ``if'' statement is not
executed. Notice that we do not need to log into the remote system to
perform the task. For a site with many systems, the script or file
distribution feature can provide great benefits for day-to-day system
administration.
Without action scripts, alarms can be viewed on the eEMU browser but there cannot be any automation. One of the major benefits of monitoring systems is that a corrective action or alarm escalation can take place automatically without human intervention. eEMU action scripts can be written in any programming or scripting language. The scripts are called in the background, whereby message attributes are passed to it as environment variables. Korn shell, Perl, Python, Tcl or Visual Basic are examples of excellent scripting languages that can be used with eEMU.
eEMU features three action scripts: input, output and delete. The input action script is called immediately on receipt of a new message. If the input script returns a value greater than 0, the message is discarded. The input script can be used for message replication or to supplement security and let in messages from specified hosts only.
The output action script is called for every message processed by eEMU except for delete messages. Delete messages invoke a separate script called ``delete action script''.
An exhaustive group of environment variables is provided for all the three action scripts, thus alarm actioning can be easily coded. There is no limit on what can be done in action scripts. emsg can also be used in action scripts to query the eEMU database, read a file or send a new message to eEMU. Care must be taken to avoid infinite message loops.
With a combination of resource IDs, message classes and message severity, call logging or paging is simple to achieve through action scripts. For example, to send a page if an alarm of severity 1 occurs, the following output action script can be used:
if [ $E_SEV -eq 1 -a $E_COUNT \
   -eq 1 -a $E_TYPE = "normal" ];then
 /usr/local/bin/page \
             $E_CLASS $E_HOST $E_MSG
fi
The first occurrence of a normal message (E_TYPE) with severity 1 (E_SEV) calls the /usr/local/bin/page script. The script can page the appropriate staff based on the message class (E_CLASS).
While syslog and e-mail has been in use for some time and as such are powerful, proven messaging tools, they do not provide enough flexibility for dynamic monitoring in ever changing environment. With the messaging arsenal eEMU provides it is possible to build simple powerful agents not only for the system and hardware, but most importantly for applications. It is increasingly necessary to monitor various applications. This task is not easy with system agents provided with most other monitoring solutions. The eEMU messaging language is expressive enough to capture most typical scenarios in application monitoring. Such scenarios are dynamic masking out alarms, measuring application response times, catching overtime or hung business processes, identifying crashed scripts, synchronising batch job etc. Since eEMU agents do not, in most cases, have to store the resource status information, all that needs to be done is transform the monitoring case into the eEMU messaging language and if necessary, deploy the provided standard agents, e.g. the log agent, directory agent and process agent.
The eEMU server is a powerful implementation that has a minimum demand on operating system resources. E.g. the message database on disk does not typically grow beyond 500 kB. Action scripts are simple to implement. Action scripting is designed for easy integration with other products, such as paging software or third party messaging.
Status messages are equipped with a timestamp and written into a log file. There is one log file for each day. The contents of the log file can be used for generating reports or ad-hoc alarm searches. Message attributes in the file are delimited with a vertical bar for handy processing by scripts or other reporting software.
The eEMU browser unifies the best capabilities of today's alarming concepts, namely color-coded system icons and event logs into one interface. As a result, the browser is extremely intuitive with minimum requirements on the operational staff. The latest version of the eEMU browser implements ``business views'' that allow to segment alarms into groups by function, geographical region, business importance etc.
There are a few passwords that enable access to specific message type groups. For example, helpdesk staff can view and annotate messages but cannot delete them. Each message type must be equipped with the correct password in order to be accepted by the server.
Since eEMU agents do not typically run as daemons, but rather are scheduled through a scheduling mechanism, such as cron on UNIX, eEMU represent a very safe monitoring solution for systems deployed in insecure environments such as firewalls. eEMUconcept provide an eEMU agent scheduler for Windows NT.
eEMU is a modular system that allows to build multi-tier hierarchies of monitoring agents and servers. The emsg executable forms the client side of the system. It can easily be integrated into any third party system. The integration can be done either at the emsg level or at the server level through action scripts.
eEMU has been successfully integrated with HP OpenView and Unicenter TNG. They are both SNMP based, so how was it done ? Simply through action scripts. In case of standalone SNMP agents without an SNMP manager, there are a few approaches. An SNMP daemon can listen for SNMP traps and log them into a log file. The eEMU log agent is pointed at the log file and sends alarms for traps of our interest. If SNMP GETs need to be employed, a simple agent script, possibly written in perl, uses an snmpget utility to retrieve a resource status and subsequently sends a message to eEMU.
In the above, I described the case of alarms that are forwarded to eEMU for display on the eEMU browser and for triggering alarm actions. However, it is also possible to forward alarms from eEMU to a third party system. We can use the eEMU action scripts and command line interface as a vehicle for such forwarding.
In the network realm, SNMP is a successful, firmly established monitoring methodology. As a result, there have been numerous attempts to apply SNMP to system monitoring. Our experience shows that such attempts are not successful. What administrators need is a powerful, simple command line interface to the monitoring server. Moreover, the interface needs to possess intelligence so that agent scripting requirements are reduced to the minimum. eEMU is a system that brings message type and time-to-live concepts that make the above possible. With eEMU, every system and network administrator is able to build monitoring and messaging infrastructure that forms the backbone of every enterprise management. There is no enterprise management without a powerful messaging foundation equipped with scripting interfaces at all levels. Some vendors like to say that enterprise management is using their products or their integration kits for other third party programs. This is not so. Enterprise management is based on open standard interoperability and easy integration hooks in and into existing systems. A lot of effort has been put into making vendors build their products to recognised standards. There has been more or less success doing that. However, command line interface to programs and script invocation on various events is still the best and most versatile API available.
The eEMU software is available from eEMUconcept Pty Ltd, Australia. A free evaluation licence is available on request from the company's home web page (https://www.eemuconcept.com). The eEMU kit includes Unix and Windows NT system agents.
Jarra Voleynik is a co-author of eEMU. He is currently working for eEMUconcept as a chief architect for the eEMU product. Jarra has a MSc degree in radioelectronics. He has been involved with computers, especially UNIX, for 12 years. He has worked, as a consultant, for major UNIX vendors, such as Digital Equipment Corporation, Compaq and Sun Microsystems. Recently, Jarra has architected one of the largest monitoring and call logging projects in Australia. Reach him electronically at jarra@eemuconcept.com.