
| ||||||||||||||||||||||||||||||||||||||||||||||||||||
|
LISA 2002 Paper
MieLog: A Highly Interactive Visual Log Browser Using Information Visualization and Statistical Analysis(Berkeley, CA: USENIX Association, 2002). AbstractSystem administration has become an increasingly important function, with the fundamental task being the inspection of computer log-files. It is not, however, easy to perform such tasks for two reasons. One is the high recognition load of log contents due to the massive amount of textual data. It is a tedious, time-consuming and often error-prone task to read through them. The other problem is the difficulty in extracting unusual messages from the log. If an administrator does not have the knowledge or experience, he or she cannot readily recognize unusual log messages. To help address these issues, we have developed a highly interactive visual log browser called ``MieLog.'' MieLog uses two techniques for manual log inspection tasks: information visualization and statistical analysis. Information visualization is helpful in reducing the recognition load because it provides an alternative method of interpreting textual information without reading. Statistical analysis enables the extraction of unusual log messages without domain specific knowledge. We will give three examples that illustrate the ability of the MieLog system to isolate unusual messages more easily than before. IntroductionAdministration of computers has become more important than ever because of the increasing role of computers and networks in providing various services to our daily life. It is therefore necessary to conduct them continuously and properly as part of our modern infrastructure. Computer log inspections are the most fundamental tasks in administration, since most of the events occurring in computers and networks are recorded into log-files. Administrators, therefore, must inspect them periodically. When they find an anomaly in the log-file, they must make an appropriate response as soon as possible. Today's security threats to a computer network increase the importance of log inspections to help detect possible breaches. Although administrators recognize the importance of log inspection, the task is often not performed regularly at many computer sites. One reason is that it is a tedious and time-consuming task due to the large amount of textual data. Another reason is that it requires skilled knowledge to recognize an unusual message in the log-files. We have developed a highly interactive log browser, called ``MieLog,'' which uses information visualization and statistical analysis to help alleviate some of the problems involved in log monitoring. The purpose of the system is to assist administrators to inspect computer logs manually. MieLog consists of three main approaches. One is information visualization to improve the recognition load of textual data. Another is a high level of interactivity which makes it easier to filter out or extract information from log data. The last is statistical analysis which provides inspectors with various tools to help detect unusual messages in the log. This paper is organized as follows: First, we mention the issues and importance of computer log inspections. The next section presents the system overview and the detail of each module of MieLog. Subsequently, we explain the visualization method of computer logs and interactive functions. then we show some examples of computer log inspections using MieLog. Finally, we discuss related work and proposed future enhancements. Problems of Computer Log InspectionsThere is no doubt that log inspections are indispensable for computer administration. Administrators, however, regard them as tedious, time-consuming and often unrewarding tasks. Therefore, although some administrators are aware of the importance of the tasks, they hesitate to perform them. Indeed, a recent security survey in Japan shows that such tasks have not been performed sufficiently even by Internet service providers. We can define log inspections in more specific terms:
We will consider each of these problems in further detail. The factors that make it difficult to interpret the log contents are that:
These factors clarify the problems that administrators must face. Administrators must read through the log messages to understand them and they must spend many hours doing so. Thus, it is almost impossible to manually inspect computer logs at a large computer site. Administrators also require specialized knowledge about the logs, since recording formats, contents and existing directories of each log may be completely different. There are many problems with just the log recognition stage in log inspection tasks. Next, we list the factors that make it difficult to isolate unusual log messages.
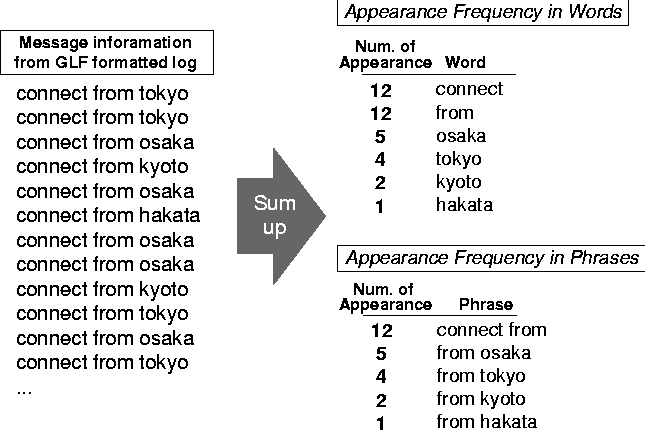
Computer log-files contain various kinds of messages. They contain not only errors and warnings but also operating system status and notice from applications. In general, they contain only a few important messages, while the others are less important messages. Administrators, therefore, must be able to extract the important messages from the log. The next problem is that it is difficult to formulate the rules for unusual log message extraction. There are two reasons. One is that no administrator knows what constitutes unusual messages for all cases. The other is that the rules are highly dependent on both administrator's knowledge and the environment of the site. We confer that it is important to build rules for extracting known problem log messages. We believe that it is also important to inspect the logs periodically to find unknown unusual log messages and rebuild or refine extraction rules based on the new information. The last problem is that administrators cannot judge the importance of each log message based solely on one kind of log-file. Because each log message contains only partial information about an event that has occurred in a computer, a more reliable judgment requires log messages from multiple log-files. It is therefore necessary to collect other related information from various log-files and analyze them comprehensively. This would require many operations, as well as extensive knowledge and time. In this paper, we propose the use of information visualization and statistical analysis to address the above problems. In general, the number of unusual log messages is small in typical log-files. If we obtain frequency information from a log using statistical analysis, it is possible to isolate such log messages. It helps administrators to find truly unusual log messages. Furthermore, MieLog visualizes frequency information and the log file itself as a figure. It reduces the recognition load of log messages when inspecting them. The reason is that the method of log message recognition changes from ``reading'' to ``looking.'' MieLog does not just visualize a log as a figure. It also adds a high level of interactivity. Many of the interactive functions help perform filtering of log messages in various ways. An inspector can execute commands by direct interaction with a visualized figure. The combination of the two features makes it possible to reduce the problems of inspecting logs by humans. MieLog: System Overview and its VisualizationWe developed an interactive log information browser called ``MieLog'' based on the considerations presented in the previous section. In this section, we describe the system modules of MieLog and the features which address the above mentioned problems. We used C++ programming language and OpenGL library in development of MieLog. The visual screen of MieLog is shown in Figure 1. The screen is composed of four visualization areas. They are the ``Tag area,'' the ``Time area,'' the ``Outline area'' and the ``Message area'' respectively in order from left to right of the screen. The left three areas visualize different ``characteristics'' of the log, while the fourth area is for viewing the actual message text. MieLog also visualizes the relationship between each area clearly. The system modules of MieLog are illustrated in Figure 2. MieLog is composed of three modules. We explain the details of each module in the following sections. 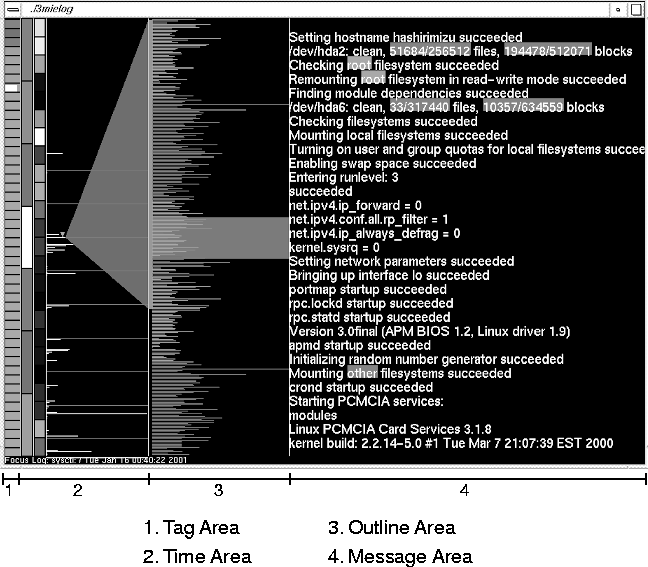 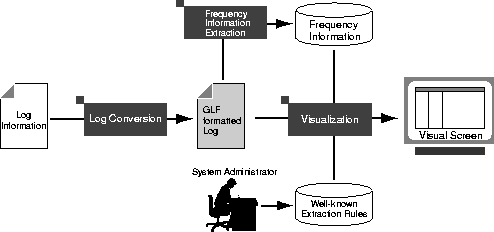 Log Conversion ModuleThis module converts logs with various recording formats into an intermediate format called the ``Generalized Log Format'' (GLF). There are various problems involved in inspecting a log. One is the different recording formats used and the types of contents of each log message. The other is that administrators must have extensive knowledge about the log: where the log-file exists, how to get the log messages and which log-files should be inspected. To simplify these problems, we provide two types of tools. One is the log collection and conversion tool. The other tool is for merging converted logs. Figure 3 shows the syntax of the ``Generalized Log Format'' and a conversion example. 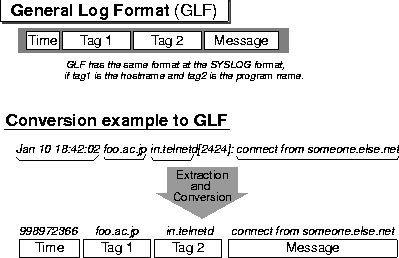 As you can see, the General Log Format consists of four elements. The type of each element is a character string except for the time element, which is an integer value in seconds. This format is very similar to the message format of the syslog daemon on UNIX systems. This module contributes to a couple of advantages. MieLog has the ability to browse through log messages recorded in several log-files at one time because the conversion of log message enables the integration of various computer logs into one. The integration of logs are based on the recorded time stamp of each message. These functions reduce the number of operations and time involved when administrators have to inspect several logs. Moreover, this reduces the difficulty of the comprehensive judgment because an inspector receives the time correlation of log messages. The other role of this module is pre-processing for statistical analysis in order to extract frequency information from the log. Frequency Information Extraction ModuleThis module extracts frequency information from GLF formatted log messages using statistical analysis. MieLog uses this information to help extract unusual log messages without pre-defined keywords. This approach is based on the following concept: even if a log has a massive amount of message data, there are generally only a few key messages. In other words, using such information, we can extract at least the ``candidates'' of unusual log messages. This assists an inspector in recognizing anomalous messages even if administrators have no prior knowledge or experience about the log. We explain how to extract frequency information with respect to each element in the GLF as follows:
 Using MieLog, it is also possible to extract unusual log messages using keywords that an inspector already knows. When an inspector defines keywords, MieLog highlights these words or phrases visually. Information Visualization ModuleMieLog visualizes log messages by combining three kinds of sources: GLF-formatted log messages, frequency information and pre-defined keywords. This module also makes MieLog a highly interactive system. MieLog has a variety of interactive functions to help extract unusual messages. Visualization provides the inspectors with the following two advantages: One is to reduce the load on recognizing a textual message. The other is that it enables administrators to introduce human decision making into judging whether each message seems to be unusual or not. Visual Representations and Interactive FunctionsIn this section, we describe the visualization method and interactive functions of MieLog. Visual Representation of MieLogThe information visualization module creates a visual screen such the one shown in Figure 1. The screen of MieLog is composed of four visual areas as mentioned in the previous section. We will explain the visual representation of each area in this section. Tag areaThe tag area visualizes frequency information of tags as a vertical grid (Figure 5). Each colored tile in the grid represents a corresponding tag information. The number of tiles represents the total number of tags. 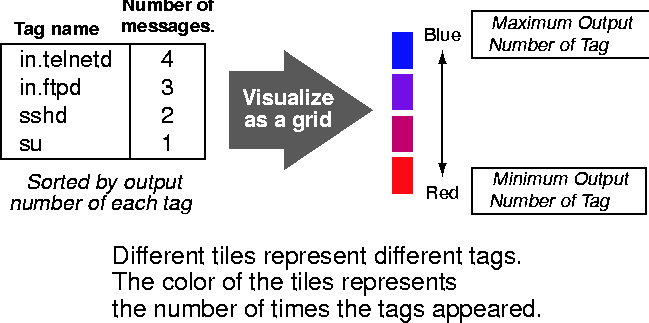 The color of the tiles represents the value of frequency information of each tag. A blue tile indicates that the corresponding tag has the highest frequency value in the log, while a red tile indicates that the corresponding tag has the lowest frequency value. Other tiles with intermediate frequency values have intermediate colors between red and blue. This visualization makes it possible to understand the number and frequency of each tag. The name of each tag is displayed at the bottom of the screen. MieLog uses another coloring scheme in this area based on the number of tiles, namely the number of tags. The color of each tile is evenly gradated from blue to red. It is easier to distinguish each tile than the colors based on the frequency values. Time areaThe time area is subdivided into three areas. The right-most column of the time area shows a histogram. The time is assigned from top to bottom, and the value axis is assigned from left to right. It shows how many messages area produced in each unit span. The two left columns in the time area represent the appearance frequency information in different periodic time divisions. As you can see, the left grid has seven tiles and the right has twenty four tiles. This indicates that the left grid represents the appearance frequency information in a week and the right represents them in a day. The representation method of these grids is the same as that of the tag area except for the coloring. The coloring of this area is a gradation between white and black instead of blue and red (Figure 6). These visual representations make it easier to recognize time-characteristics of the log. 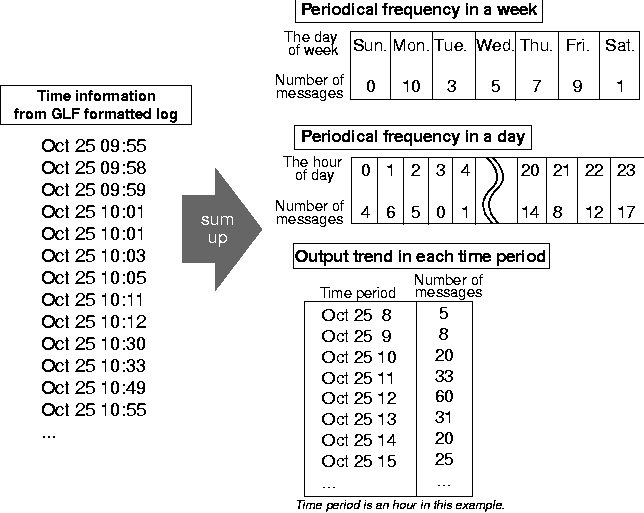 Outline areaThis area displays the outline of log messages. Each log message is represented as a colored line. The length of the line is the string length of the log message. The colors of the lines are the same as the grid's colors in the tag area. In other words, the color of each line is assigned to the color of the corresponding tag defined in the tag area (Figure 7). 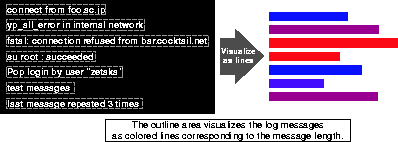 This visual representation enables administrators to recognize log messages as a visual pattern based on the length and the frequency with which they appear. As a result, it is possible to browse many log messages at once, unlike textual representations. Since the line color depends on an appearance frequency of the tag, administrators can also judge whether each message appears to be unusual or not. These provide inspectors with the opportunity to pinpoint unusual log messages before they read the textual log messages. In the center of this area, a transparent square exists, representing the correlating section between the outline area and the message area. The region of the highlighted square in the outline area is the section displayed in the message area. Message areaThe message area represents actual textual log messages. It is a view similar to that of a text editor, with the exception that it has highlighted words or phrases. Words and phrases highlighted in red and blue (Figure 8). The words and phrases highlighted with red represent the keywords specified in the pre-defined keywords. Those highlighted in blue represent words with a low appearance frequency value. An inspector must define the threshold value manually if he or she wants to extract the words and phrases with a low appearance frequency value. These features make it possible to extract not only known key messages but also potentially suspect messages. 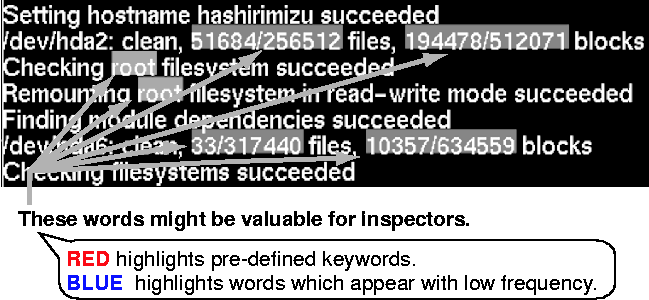 Interactive FunctionsMieLog has a variety of interactive functions that perform various filtering of log messages. Using these functions, administrators can extract log messages using various visual transformations. This capability effectively assists inspectors by extracting the messages that meet a specific pattern. In this section, we describe the interactive functions of MieLog. We explain them with respect to each visual area. Tag areaAn interactive function in the tag area allows the extraction of log messages with a specific tag. If administrators want to filter log messages using tag information, they simply specify their focused tag by clicking the tile in the grid with the mouse. They then obtain a new visual screen that displays only the log messages with the specified tag. It is possible for inspectors to specify not only one tag but also multiple tags in the filtering. It is also possible to specify the tags based on appearance frequency information. Time areaAn interactive function in the time area extracts the log messages based on their recorded time. There are two types of visualization methods in this area: grid visualization and histogram visualization. We explain the interactive function of each of them respectively. In grid visualization, an inspector can extract log messages based on two types of periodical time spans. They are the hour of the day and the days of the week. The method of filtering, as in the tag area, is to click the tile with the mouse. The administrator can specify multiple tags in a grid. They can also specify multiple tags in two separate grids. In such a case, MieLog extracts the log messages based on the ``AND'' condition in each time span. In other words, it is possible to extract the log messages that were recorded in 18, 19 and 20 o'clock on Saturday and Sunday just by clicking the five tiles. In histogram visualization, an inspector can extract the log messages based on the number of log messages in each time span. The filtering method is described as the following. First, the inspectors should select the type of the filtering. There are three filtering conditions: ``less than,'' ``nearly equal,'' and ``more than'' a threshold value based on the number of log messages in each time span. Next, the inspector should define a threshold value. A vertical line is drawn when the inspector drags the mouse pointer by pushing the right button in the histogram area. That line represents the threshold value for filtering. The inspector can define the threshold value interactively using the visual representation. Finally, the inspector releases the right mouse button to fix the threshold value according to the location of the mouse pointer. The filtering process, then, starts running using the threshold value and the previously defined filtering mode. A visual representation reflects the filtered result. Outline areaAn interactive function in the outline area enables inspectors to extract log messages based on the length of the log message. Whenever the inspector defines a base length for filtering by manipulating a mouse, they obtain a new visual screen that displays only the messages with a certain length. There are three filtering conditions. The first filtering condition extracts messages shorter than the base length. The second condition extracts messages which are nearly equal to the base length. The third condition extracts messages longer than the base length. The method of filtering is the same as the filtering method based on the output number in the histogram of the time area. The outline area has another interactive function which enables direct access to the specific log message for a detailed look, displaying it in the message area. The number of visualized log messages is much greater in the outline area than in the message area. Therefore, many log messages visualized in the outline area are not visible in the message area. If unusual log messages seem to exist in the log messages, it is natural that administrators would want to know the details of them. This interactive function helps them to inspect such log messages more easily. Message areaAn interactive function in the message area extracts log messages that include specific words or phrases. In other words, it is possible to filter log messages by a word or a phrase. The method is described as follows. First, the inspector should choose words or phrases in the menu. This operation is to decide the unit element for filtering. Second, a filtering condition should be selected. There are three filtering conditions: ``and,'' ``or,'' and ``not.'' These filtering conditions represent the logical relation between selected words or phrases. Filtering with ``and'' condition extracts the log messages that include all selected words or phrases. Filtering with ``or'' condition extracts the log messages that include at least one of the selected words or phrases. The above two filtering conditions become effective when an inspector selects more than one word or phrase. Filtering with ``not'' condition extracts the log messages that do not include the selected words or phrases. It is also possible for an inspector to use this filtering condition when he or she selects only one word or phrase. The ``not'' filtering is extremely useful to reduce the amount of visualized messages because it enables the inspector to erase some messages from the inspection target. Using this filtering, the administrators filter out the well-known (i.e., useless) log messages step by step. This function assists the administrator to narrow the inspection target easily and interactively. There are other kinds of interactive functions that are not closely related to other visual areas. Defining Keywords and Key PhrasesWhen the inspector defines keywords or key phrases that are already known as unusual log messages, MieLog highlights them in a manner that the inspector can easily recognize the existence of them. The definition of keywords and key phrases is usually done using another tool such as a text editor. It is, however, possible to define them using MieLog itself through the GUI. There is two methods of defining keywords or key phrases in MieLog. One is to input them through the GUI. The other method is described as follows. First, the inspector selects a word or a phrase as a keyword or a key phrase on the screen of MieLog using the mouse. Next, he or she starts running the GUI for keyword definition. Then, selected words or phrases are automatically input in the GUI. If the inspector pushes the ``OK'' button on the GUI, they are defined as a keywords or key phrases. Namely, the latter method provides a convenient method of input of keywords or key phrases for the inspectors. Summarizing Log MessagesMieLog has a log summarization function that eliminates the duplication of log messages. Computer log-files generally contain massive amounts of messages. One of the reasons is that relatively unimportant messages are recorded repeatedly in the log. These messages are usually a result of a proper event of the operating system or applications. MieLog, therefore, enables the inspector to summarize log messages interactively in order to reduce the inspection target. If the inspector executes this function, all visualized log messages in MieLog become unique. This makes it possible to reduce the number of log messages and avoid redundant log inspection. Log Inspection Examples Using MieLogIn this section, we show three examples which demonstrate how to find log messages that seem to show an abnormal behavior using MieLog. We also explain how to use the interactive functions for effective browsing in each case. An Inspection Example using Log Recording Time VisualizationFigure 9 shows an example of visual representation of the time area. 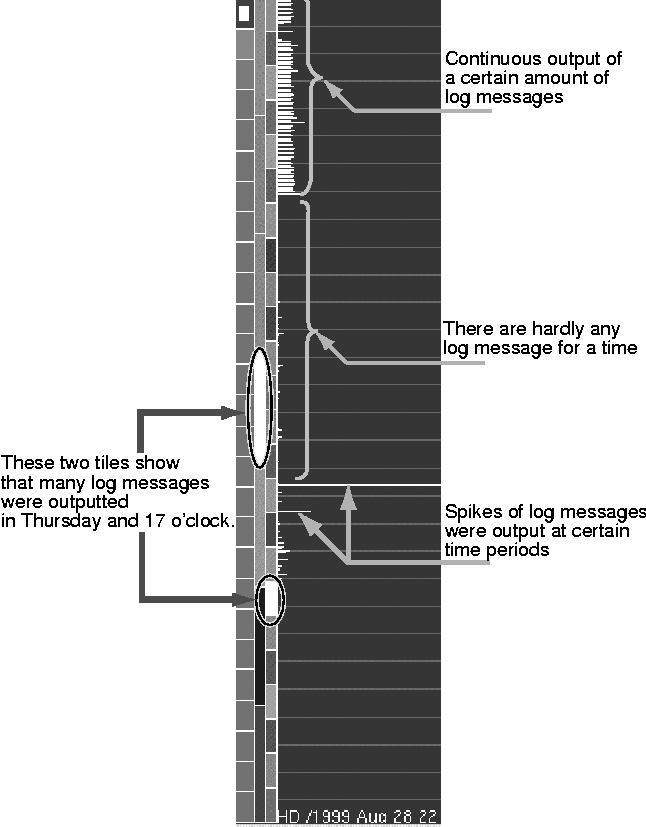 There are two grids in the time area. Each grid has one bright white tile. This visualization shows that many log messages were recorded at a certain hour of the day and a certain day of the week. In this example, these are 17 o'clock and Thursday. This is a notable indication to help find an unusual log message. Such an indication would be regarded as an abnormal event in many cases. occurrences in many cases. The administrators, therefore, should inspect the log messages recorded in that period of time. It is easy for them to view only the log messages recorded in those periods of time, if they make use of the interactive log message filtering by time. They would simply click the two white tiles with the mouse. Next, we look at the visualization of an output trend as a histogram in the time area. From the example diagram, it is possible to recognize certain notable activity as listed below:
We propose that there are three specific areas that the administrator should inspect the log in further detail based on the above indications. One is the time when message output was lost. The others are the two time spans when a large number of log messages was recorded. It is easy to perform these inspections using the interactive function of MieLog. Administrators can easily access the log messages that were recorded in a specific time span just by clicking the lines in the histogram of the time area. They will get a new visual screen that shows the messages recorded in the specific time span only. In this example, as a result of the above indications, the inspectors was able to determine the following things: The reason why log messages ceased after a certain time is that a system program did not start after the system configuration was modified. And the massive number of log messages generated in specific time spans were a result of running examination of new software by an another administrator. In this case, both indications did not result from an abnormal event. We have shown an example in which MieLog was able to represent various indications to the inspector just by focusing on the time area. These indications assisted the inspector to find unusual messages through time trends and frequency, which would have been almost impossible to discover reading through conventional text. An Inspection Example using Log Outline VisualizationNext, we focus on the visual representation of the outline area. Figure 10 shows three visual representations of the outline area. The left visualization seems to have been made during a normal status. The other visualizations seem to indicate an abnormality. 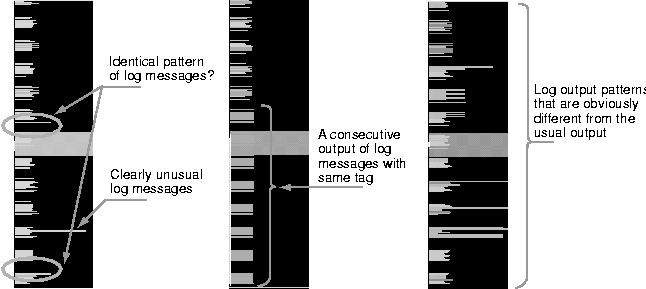 Focusing on the left visualization, There are three characteristics which can be recognized as follows:
An administrator should suspect the latter two of the three as an indication of unusual log messages and inspect them in detail. To look at the log messages in detail, the inspector clicks the line in the outline area with the mouse and the text will appear in the message area. if the inspector decides there is something unusual about the messages, he or she needs to investigate the log from the following points of view:
It is also easy to answer the above questions using interactive functions. The inspector can extract the series of messages using word filtering. The inspector can then easily get the output trend and periodicity of such messages from the time area. He or she, of course, can easily access each message pattern and its surrounding messages. These functions help the inspector to look for unusual message around that time period. Next, we look at the center image in Figure 10. This figure is clearly different from the log messages outlined in the other two visualizations. The inspector, therefore, easily recognizes an abnormal status at a glance. The reason is that the log messages in this outline example have various lengths of lines with red color. The inspector knows that these particular log messages rarely appear in this log-file. The inspectors should investigate them in further detail. We finally focus on the right image in Figure 10. This visualization contains many lines with the same blue color and the same length towards the bottom. This is absolutely unusual status. The line colors are blue and therefore, appear to be a normal status. We think, however, that the reason why the line colors are blue is because the repeated output of the same message makes its appearance frequency high. The inspector should investigate these messages in further detail. As seen in these examples, outline visualization enables the inspector to recognize the log messages as a pattern. This feature provides indications to find an unusual message before reading the textual messages. In other words, outline visualization provides another method for extracting unusual log messages other than the frequency information data. The above examples give a glimpse of such ability. This capability greatly depends on using information visualization and introducing a human decision into the judgment. An Inspection Example Using Log Message Representation with Word and Phrase HighlightingFinally, we focus on the visual representation of the message area. MieLog represents log messages as text. However, more than just text, MieLog uses highlighting features, which makes it possible to quickly recognize words and phrases with low appearance frequency. Figure 11 gives three examples of visual representations of the message area. The difference between these visualizations is the method of highlighting the words and phrases for indicating the suspicious log messages. The left visualization is an example using keyword extraction only. There is one word highlighted in red. It means that the word is one of the keywords pre-defined by the inspector. 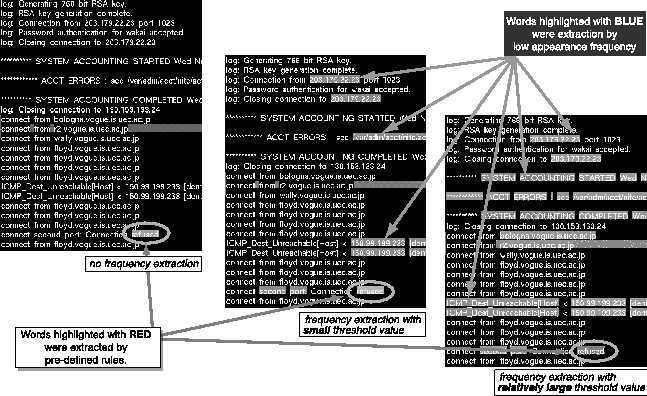 The other two visualizations are examples using keyword and frequency extraction. There are some words colored blue. It means that they are low appearance frequency words. In the center visualization of Figure 11, the inspector sets the threshold value for low frequency extraction to low. In the right visualization, the inspector sets the threshold value to middle. There are, of course, many more highlighted words with blue color in the right visualization than the center. If the inspector wants to know the low frequency word, he or she must define the threshold value first. In the current implementation, the inspector must select the threshold value from fixed values using pop-up menu. Then, the inspector clearly recognizes the words and the phrases with low appearance frequency because they are highlighted in blue. We believe that indicating low appearance frequency words and phrases helps administrators find unusual log messages. Such words and phrases are probably related to unusual log messages. Visual representations reduce the chance of overlooking them in manual log inspections and makes it easier to recognize low frequency words and phrases where they appear. DiscussionWe describe the advantages and proposed future work of MieLog in this section. Advantages of MieLogMieLog provides administrators with various tools for inspection using information visualization and statistical analysis. They help administrators to look for unusual log messages. MieLog also makes it possible to inspect logs interactively. The advantages of MieLog are as follows:
We put above advantages in another way. The greatest advantage of MieLog is to provide a method of anomaly detection for manual log inspection task. An anomaly detection is well-known technique for detecting intrusive behavior in intrusion detection research. There is, however, no system that makes use of such technique. Other log inspection systems make use of misuse detection only, such as keyword search. Information visualization and statistical analysis make it possible to use such technique in inspecting computer log manually. From this point of view, MieLog varies greatly from other log inspection tools. One more another advantage of MieLog is that it is a human-centered system. MieLog is just a log browser, not an automated log inspection tool. And information visualization makes easier to recognize the log content than textual representation. We consider that there are still a lot of system administrators who want to inspect the log by themselves. There is, however, no system that has functions in order to meet their requests. We believe that MieLog is a tool that has a variety of functions to meet their requests. Future WorksWe describe proposed future enhancements of MieLog in this section. There are two main areas for improvement. First issue is the log message extraction method. We use the appearance frequency information for extracting unusual log messages. However, not all extracted log messages are unusual log messages. We must evaluate the validation between extracted messages and unusual log messages and refine the extraction method. For example, many numerical values in the log are extracted as low frequency words because they are not recorded repeatedly. Therefore, we should exclude them as targets of statistical analysis. The next issue is the performance related to the size of logs. The modules that are mainly affected by the size of log are statistical analysis and interactive functions. As the size of log increases, the more time is needed to process the response of the interactive functions. To alleviate this problem, we think it would be better to separate the statistical analysis from the graphical browser. We are also considering using a database. The last issue is to add a real-time log monitoring feature. This issue has a lot of problems. We think that we must modify the system design largely in order to implement this feature. We also consider that we should be prepare for the another visual expression method for real-time log monitoring. One reason is that MieLog visualizes only a small number of log messages in current representation method. If we use MieLog in real-time log monitoring, MieLog should have an ability to visualize a large number of log messages more than the current because it is easily expected that a lot of log messages are suddenly outputted at a time. If such case occurred, administrators lost the chance to see unusual log messages like above. In addition, we must prepare log conversion programs for the various type of logs in order to capitalize on the advantages of MieLog. We currently provide only log conversion for UNIX syslog formats. Related WorksThere are a number of log inspection tools already in existence which can be compared with MieLog. In this section, we describe two typical log browsing and inspection systems, and explain how MieLog differs from these types of systems. One system is ``Xlogmaster'' [9]. This is a GUI based log monitoring system running on X window system. The main problem of Xlogmaster is that it represents log messages as text and it is harder for inspectors to recognize the log messages. Moreover, it is almost impossible to determine characteristics in the log, such as a message output trend and so on. The inspector must define the keywords in order to extract the unusual log messages. Administrators who have no knowledge and experience of performing log inspection will have difficulty extracting unusual log messages. The other system is ``SeeLog'' [1]. SeeLog, like MieLog, represents log messages visually. However, the main problem with SeeLog is that only an outline visualization is available. It is thus difficult to ascertain characteristics of the log. Although SeeLog enables a visual representation of textual log messages, it is difficult for administrators to browse through them. It also has the problem of requiring keyword definitions in order to extract unusual log messages. There are other log monitoring tools such as Swatch [5], Logsurfer [7] and syslog-ng [8]. However, a novice administrator will have difficulty using these tools effectively because the method of unusual log message extraction in these tools is by keyword search. There are a number of problems with using keyword search as the inherent method of extraction. The first problem is that the inspector must define the keywords. It is, however, difficult for some administrators to do this because not all administrators are aware of the keywords for unusual log message. The second problem is that it is almost impossible to extract unusual log message that are not widely known. The third problem is that extracted log messages are represented as text and will still have a problem with the recognition load of the log messages. The last problem is that these systems do not support log inspection of messages around the suspect message. Administrators must inspect log messages manually around the time of the recorded extracted log message in order to find other related unusual log messages. They also might have to look for another log-files in the same purpose. ConclusionIn this paper, we have described the interactive visual log browser, named MieLog. MieLog assists human inspection of computer log data. MieLog has three main features which address some problems of log inspection tasks:
These features provide the following merits. The inspector can inspect more than one log at a time. It is also possible to find an unusual log message even if the inspector has no prior knowledge about them. The most important merit of MieLog is that it brings the human decision making process into the log inspection task. Future works on MieLog include its evaluation in a practical environment, and the refinement and extension of message extraction methods and interactive functions. Availability and RequirementsRegrettably, MieLog is not freely available because we have a plan to be a commercial product. However, we might release a limited version of MieLog in future. The reason is that we have to evaluate it and collect the opinions about MieLog. Please feel free to contact the author by E-mail to zetaka@computer.org for the current status of MieLog or any related information. Author InformationTetsuji Takada is a researcher at the Satellite Venture Business Laboratory in University of Electro-Communications, Tokyo, Japan. His main interests are information visualization and computer security. He received his BS, MS and Dr. of Eng. degrees in information engineering from the University of Electro-Communications in 2000. He is a member of the IEEE. Tetsuji can be reached via email at zetaka@computer.org. Hideki Koike is an associate professor at the Graduate School of Information Systems, University of Electro-Communications, Tokyo, Japan. His research interests include information visualization, vision-based human-computer interaction, and computer security. He received his BS degree in mechanical engineering from the University of Tokyo in 1986. He received his MS and Dr. of Eng. degrees in information engineering from the University of Tokyo in 1988 and 1991, respectively. He is a member of the IEEE and ACM. Hideki can be reached via email at koike@acm.org. References[1] Eick S. G., M. C. Nelson, and Schmidt J. D.:, ``Graphical Analysis of Computer Log Files,'' Communications of the ACM, Vol. 37, No. 12, pp. 50-56, 1994.[2] Lee, W. and S. Stolfo: ``Data Mining Approaches for Intrusion Detection,'' In Proceedings of Seventh USENIX Security Symposium, pp. 79-93, Jan 1998. [3] Cox, Kenneth C., Stephen G. Eick, Graham J. Wills, and Ronald J. Brachman, ``Visual Data Mining: Recognizing Telephone Calling Fraud,'' Journal of Data Mining and Knowledge Discovery, Vol. 1, No. 2, pp. 225-231, 1997. [4] James, A. H., Audit Log Analysis Using the Visual Audit Browser Toolkit, Computer Science Department U. C. Davis Technical Report (CSE-95-11), 1995. [5] Hansen, S. E. and E. T. Atkins, ``Automated System Monitoring and Notification With Swatch,'' USENIX Seventh System Administration Conference, Nov 1993. [6] Toshiyuki, Masui, ``LensBar - Visualization for Browsing and Filtering Large Lists of Data,'' In Proceedings of InfoVis 1998, pp. 113-120, Oct 1998. [7] Ley, W. and U.Ellerman, Logsurfer, https://www.cert.dfn.de/eng/logsurf/, 1995. [8] ``BalaBit: The Free Software Company,'' syslog-ng, https://www.balabit.hu/products/syslog-ng/. [9] Greve, Georg C. F., The Xlogmaster, https://www.gnu.org/software/xlogmaster/, 1998. |
|
This paper was originally published in the
Proceedings of the LISA 2002 16th System Administration Conference, November 3-8, 2002, Philadelphia, Pennsylvania, USA.
Last changed: 24 Oct. 2002 aw |
|