The Alexander prototype is constructed as a software RAID driver in the Linux 2.2 kernel. File systems mount the pseudo-device and use it as if it were a normal disk. Our environment is excellent for understanding many of the issues that would be involved in the construction of a ``real'' hardware D-GRAID system; however, it is also limited in the following ways. First, and most importantly, Alexander runs on the same system as the host OS and applications, and thus there is interference due to competition for resources. Second, the performance characteristics of the microprocessor and memory system may be different than what is found within an actual RAID system. In the following experiments, we utilize a 550 MHz Pentium III and four 10K-RPM IBM disks.
Does Alexander work correctly? Alexander is more complex than simple RAID systems. To ensure that Alexander operates correctly, we have put the system through numerous stress tests, moving large amounts of data in and out of the system without problems. We have also extensively tested the corner cases of the system, pushing it into situations that are difficult to handle and making sure that the system degrades gracefully and recovers as expected. For example, we repeatedly crafted microbenchmarks to stress the mechanisms for detecting block reuse and for handling imperfect information about dynamically-typed blocks. We have also constructed benchmarks that write user data blocks to disk that contain ``worst case'' data, i.e., data that appears to be valid directory entries or indirect pointers. In all cases, Alexander was able to detect which blocks were indirect blocks and move files and directories into their proper fault-isolated locations.
To verify that Alexander places blocks on the appropriate disk, we instrumented the file system to log block allocations. In addition, Alexander logs events of interest such as assignment of a home site for an inode, creation of a new mapping for a logical block, re-mapping of blocks to a different homesite and receipt of logical writes from the file system. To evaluate the behavior of Alexander on a certain workload, we run the workload on Alexander, and obtain the time-ordered log of events that occurred at the file system and Alexander. We then process this log off-line and look for the number of blocks wrongly laid out at any given time.
We ran this test on a few hours of the HP Traces, and found that in many of the hours we examined, the number of blocks that were misplaced even temporarily was quite low, often less than 10 blocks. We report detailed results for one such hour of the trace where we observed the greatest number of misplaced blocks, among the hours we examined. Figure 5 shows the results.
The figure has two parts. The bottom part shows the normal operation of Alexander, with the capability to react to block reuse by remapping (and copying over) blocks to the correct homesite. As the figure shows, Alexander is able to quickly detect wrongly placed blocks and remap them appropriately. Further, the number of such blocks misplaced temporarily is only about 1% of the total number of blocks accessed in the trace. The top part of the figure shows the number of misplaced blocks for the same experiment, but assuming that the remapping did not occur. As can be expected, those delinquent blocks remain misplaced. The dip towards the end of the trace occurs because some of the misplaced blocks are later assigned to a file in that homesite itself, accidentally correcting the original misplacement.
| Run-time | Blocks Written | |||
|
|
(seconds) | Total | Meta | Unique |
| data | ||||
| RAID-0 | 69.25 | 101297 | - | - |
| D-GRAID1 | 61.57 | 93981 | 5962 | 1599 |
| D-GRAID2 | 66.50 | 99416 | 9954 | 3198 |
| D-GRAID3 | 73.50 | 101559 | 16976 | 4797 |
| D-GRAID4 | 78.79 | 113222 | 23646 | 6396 |
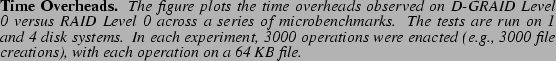
What time overheads are introduced? We now explore the time overheads that arise due to semantic inference. This primarily occurs when new blocks are written to the file system, such as during file creation. Figure 6 shows the performance of Alexander under a simple microbenchmark. As can be seen, allocating writes are slower due to the extra CPU cost involved in tracking fault-isolated placement. Reads and overwrites perform comparably with RAID-0. The high unlink times of D-GRAID on FAT is because FAT writes out data pertaining to deleted files, which have to be processed by D-GRAID as if it were newly allocated data. Given that the implementation is untuned and the infrastructure suffers from CPU and memory contention with the host, we believe that these are worst case estimates of the overheads.
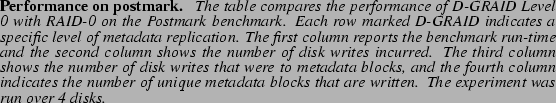
Another cost of D-GRAID that we explore is the overhead of metadata replication. For this purpose, we choose Postmark [25], a metadata intensive file system benchmark. We slightly modified Postmark to perform a sync before the deletion phase, so that all metadata writes are accounted for, making it a pessimistic evaluation of the costs. Table 2 shows the performance of Alexander under various degrees of metadata replication. As can be seen from the table, synchronous replication of metadata blocks has a significant effect on performance for metadata intensive workloads (the file sizes in Postmark range from 512 bytes to 10 KB). Note that Alexander performs better than default RAID-0 for lower degrees of replication because of better physical block allocation; since ext2 looks for a contiguous free chunk of 8 blocks to allocate a new file, its layout is sub-optimal for small files.
The table also shows the number of disk writes incurred during the course of the benchmark. The percentage of extra disk writes roughly accounts for the difference in performance between different replication levels, and these extra writes are mostly to metadata blocks. However, when we count the number of unique physical writes to metadata blocks, the absolute difference between different replication levels is small. This suggests that lazy propagation of updates to metadata block replicas, perhaps during idle time or using freeblock scheduling, can greatly reduce the performance difference, at the cost of added complexity. For example, with lazy update propagation (i.e., if the replicas were updated only once), D-GRAID4 would incur only about 4% extra disk writes.
We also played back a portion of the HP traces for 20 minutes against a standard RAID-0 system and D-GRAID over four disks. The playback engine issues requests at the times specified in the trace, with an optional speedup factor; a speedup of 2 x implies the idle time between requests was reduced by a factor of two. With speedup factors of 1 x and 2 x , D-GRAID delivered the same per-second operation throughput as RAID-0, utilizing idle time in the trace to hide its extra CPU overhead. However, with a scaling factor of 3 x , the operation throughput lagged slightly behind, with D-GRAID showing a slowdown of up to 19.2% during the first one-third of the trace execution, after which it caught up due to idle time.
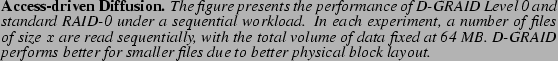
How effective is access-driven diffusion? We now show the benefits of access-driven diffusion. In each trial of this experiment, we perform a set of sequential file reads, over files of increasing size. We compare standard RAID-0 striping to D-GRAID with and without access-driven diffusion. Figure 7 shows the results of the experiment.
As we can see from the figure, without access-driven diffusion, sequential access to larger files run at the rate of a single disk in the system, and thus do not benefit from the potential parallelism. With access-driven diffusion, performance is much improved, as reads are directed to the diffused copies across all of the disks in the system. Note that in the latter case, we arrange for the files to be already diffused before the start of the experiment, by reading them a certain threshold number of times. Investigating more sophisticated policies for when to initiate access-driven diffusion is left for future work.
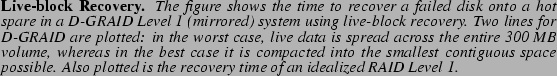
How fast is live-block recovery? We now explore the potential improvement seen with live-block recovery. Figure 8 presents the recovery time of D-GRAID while varying the amount of live file system data.
The figure plots two lines: worst case and best case live-block recovery. In the worst case, live data is spread throughout the disk, whereas in the best case it is compacted into a single portion of the volume. From the graph, we can see that live-block recovery is successful in reducing recovery time, particularly when a disk is less than half full. Note also the difference between worst case and best case times; the difference suggests that periodic disk reorganization [41] could be used to speed recovery, by moving all live data to a localized portion.
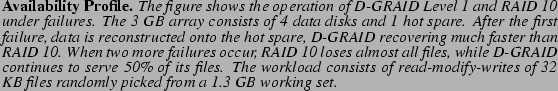
What overall benefits can we expect from D-GRAID? We next demonstrate the improved availability of Alexander under failures. Figure 9 shows the availability and performance observed by a process randomly accessing whole 32 KB files, running above D-GRAID and RAID-10. To ensure a fair comparison, both D-GRAID and RAID-10 limit their reconstruction rate to 10 MB/s.
As the figure shows, reconstruction of the 3 GB volume with 1.3 GB live data completes much faster (68 s) in D-GRAID compared to RAID-10 (160 s). Also, when the extra second failure occurs, the availability of RAID-10 drops to near zero, while D-GRAID continues with about 50 % availability. Surprisingly, after restore, RAID-10 still fails on certain files; this is because Linux does not retry inode blocks once they fail. A remount is required before RAID-10 returns to full availability.
How complex is the implementation? We briefly quantify the implementation complexity of Alexander. Table 3 shows the number of C statements required to implement the different components of Alexander. From the table, we can see that the core file system inferencing module for ext2 requires only about 1200 lines of code (counted with number of semicolons), and the core mechanisms of D-GRAID contribute to about 2000 lines of code. The rest is spent on a hash table, AVL tree and wrappers for memory management. Compared to the tens of 1000's of lines of code already comprising modern array firmware, we believe that the added complexity of D-GRAID is not that significant.
![\includegraphics[width=3.2in]{Figures/correct.eps}](img18.png)
![\includegraphics[width=3.2in]{Figures/last-overhead.eps}](img20.png)
![\includegraphics[width=3.2in]{Figures/horizontal.eps}](img23.png)
![\includegraphics[width=3.2in]{Figures/recovery.eps}](img25.png)
![\includegraphics[width=3.2in,
height=2.25 in]{Figures/avail_profile_latest.eps}](img27.png)