
| ||||||||||||||||||||||||||||||||||||||||||||||||||||
USENIX Technical Program - Paper - 1st Workshop on Intrusion Detection and Network Monitoring
[Technical Program]
An eye on network intruder-administrator shootoutsLuc Girardin
AbstractCarefully logging network activity is essential to meet the requirements of high security and optimal resource availability. However, detecting break-in attempts within this activity is a difficult task. Making the distinction between misuse and normal use is hard, and identifying intrusions that use novel attacks is fundamentally difficult. In this paper, we introduce a visual approach for analyzing network activity. This approach differs from anomaly and misuse detection because it considers human factors to support the exploration of network traffic. Our prototype application is based on an unsupervised neural network and consequently does not rely on any prior knowledge of the data being analyzed. We use self-organizing maps to project the network events on a space appropriate for visualization, and achieve their exploration using a map metaphor. The approach we present can be used to analyze past and present activities, as well as to show trends in the events. To demonstrate the usability of our tools, we describe the investigation of a dataset containing common intrusion patterns. We also discuss some weaknesses of current intrusion detection systems and propose a new paradigm for monitoring network activity that enables the discovery of new, sophisticated, and structured attacks. 1. Introduction(Readers already familiar with current anomaly and misuse detection approaches should skip to the next section.) The primary source of information that enables administrators to monitor their networks is the logging facilities provided by hubs, routers, firewalls, hosts, and network sniffers. Such facilities are often used to track real-time events and to archive the activity-history of the network. Careful logging is essential to the security [Geer et al., 1997], and provides the foundation for intrusion and anomaly detection. Intruders trying to break-in or spiteful employees attempting to gain unauthorized access are two important targets for intrusion detection systems. Audit logs can be used to detect abnormal behaviors to solve problems before occur. Logs are crucial to determine the cause of a failure, or the extent of damage after an attack and can, if monitored in real-time, be used to track failures and intrusions in progress. Another important use of audit logs is the analysis of how, when, and where resources are used, thus providing information on which to base planning decisions. Additionally, making potential intruders aware of the logging activity is a good deterrent, or can in the last resort provide evidence, which may be used to prosecute them. Geographical maps have always provided a practical way to navigate our expanding world. From handwritten maps to satellite imaging, geography has played a major role in the analysis and in the expansion of human activity. They have become more than practical records of locations, they have given us a perception of space. People are easily able to explore cities and navigate through countries they have never visited before thanks to geographic tools. Despite the fact that maps must distort reality to portray meaningful relationships within a complex world [Monmonier, 1991], they are essential to our continuous expansion. Although the physical earth has been completely mapped, we usually still watch our activities in cyberspace through a keyhole. Maps of abstract spaces, such as the activity taking place in a network can help in getting a global view of what is going on, and in particular improve the way we protect ourselves from potential intruders. Current intrusion detection systems are targeted toward unattended operations. The primary weakness of such systems is their inability to cope with new, sophisticated, and structured attacks. Such attacks represent the greatest threat to security. Our approach differs because it acknowledges the human ability to cope with complexity. It provides us with the possibility of using our tacit knowledge to make fuzzy decisions as to whether a pattern of activity is of harmless/dangerous or kindly/malicious nature, therefore giving a chance to detect unexpected attacks. In this paper, we discuss our visual approach for monitoring network traffic in the context of intrusion detection. Visualizing the network activity provides us with new ways to explore, track, and analyze intruders. It makes the monitoring user-friendly and supports the mental representation by providing a frame of reference for the network activity. We describe our prototype application, which is based on the self-organizing map algorithm to perform topological clustering. We then explain how to use our network visualization tool to detect four different types of popular attacks. 2. Intrusion detectionWith the expansion of the Internet, electronic commerce and distributed computing, the amount of information transmitted through electronic networks is continuously increasing. Such possibilities have opened many new business horizons. However, they have also resulted in a considerable increase of illegal computer intrusions [Power, 1998]. While it is common to protect our networks the same way we lock our doors, it is no longer possible to widely monitor the activity taking place on our computers and networks. In fact, the rise in sophistication of intrusions and the ever-increasing network traffic and complexity make our current monitoring tools blind and impractical. Consequently, we cannot even be informed after a breach that our door has be smashed or our belongings stolen. Thus, all the symptoms disappear and we realize our errors through the consequences. The usual result is a decision to install better and more complicated locks on the doors, postponing the problem for a while, or to tighten the security policy, leading to a limitation in the way we can conduct our business. An emerging trend that addresses these problems is the deployment of intrusion detection systems. These systems are aimed at detecting threatening situations which occur in spite of other security measures and follow two main paradigms: anomaly detection and misuse detection systems. They are intended to be used in conjunction with additional security measures enforcing the security policy. Like motion detectors in a building, they constitute a second line of defense sitting behind the locks on the doors and windows [Avolio, 1998]. Anomaly detection systems work by attempting to create a profile of what constitutes typical network activity. This model is created by capturing observable behaviors in the network traffic in order to identify and extract characterizing and repeating patterns. Typically, such systems use rules to automate filtering by suppressing known-good behaviors and triggering appropriate alerts when required. To achieve this, the profile is compared against new patterns of activity that will trigger alarms if the difference with the model exceeds a certain threshold. One of the problems is to distinguish between normal and suspicious behaviors; a sophisticated intruder might still generate malicious activities that mimic normal behaviors. Also, because the profile is updated over time, there is still a possibility for an attacker to generate innocent traffic that might be useful in hiding a subsequent attack. Finally, one has to ensure that the extracted characteristics used to build the model will allow for the differentiation of normal and malicious activity. An attack might leave no identifiable clues that an intrusion detection system will pick-up [Amoroso, 1994]. Descriptions of such anomaly detection systems can be found in [Anderson et al., 1995, Frank, 1994, Hofmeyr et al., 1998, Lane et al., 1997, Lankewicz et al., 1997, Tan, 1997]. In misuse detection systems, events are comon systems, events are compared against a database of known attack signatures. They are comparable to virus scanners and therefore exhibit the same problems. They will not be able to detect attacks they do not know about and therefore rely on the quality and completeness of their database of attacks. Thus they are not capable of recognizing future unforeseen and unexpected threats. Even worse, the detection system may not recognize the fingerprint of a slightly mutated generic attack. Another reproach to such systems is their limited scope of applicability; adding attack signatures that are specific to your organization is difficult and cumbersome. Because of the low rate of false positives such an approach exhibits and the low computational requirements, it is not surprising that it has led to many successful commercial products. To name a few, Cisco NetRanger, ISS RealSecure, and Security Dynamics KSM are among the most popular. Another approach to the problem of detecting intruders is the installation of computerized burglar alarms that rely on an understanding of the network and what should not happen within it [Ranum, 1998]. While we believe that this could help to pinpoint intruders, this approach does not solve the issue of making a clear separation between usual and unexpected network events. Such alarm systems rely on the generation of a list of events that should not occur. This process is both time-consuming and prone to errors. 3. A new paradigm for intrusion detectionThe intrusion and anomaly detection systems we mentioned previously, and other specialized applications [Couch ,et al., 1996, Hughes, 1996, Karam, 1994, Oetiker, 1998] usually provide us with reporting and monitoring capabilities. We like this possibility because it provides us with a condensed view of what is going on. However, most of the time this view will offer a simplistic interpretation and tends to ignore the complexity and context in which events are generated. Additionally, this view makes the ability to conduct interactive exploration a difficult task for the user. Our goal is to take advantage of our innate perceptual abilities by inducing the viewer to think about the substance, and not about the methodology. From our perspective, we think that all these approaches fail to acknowledge the natural human ability to cope with complexity. After all, talented people who craft highly complex and unexpected attacks by mixing social and technical competence are the one we should fear the most. However, we acknowledge that the solutions presented before are well adapted to the popular brute force attacks, but we find them hopeless for the more serious threats. Thus, our motivation is to take into account our intrinsic capabilities using visual metaphor, which trigger our senses to make decisions. This gives the user the possibility to make fuzzy judgments whether something is normal/abnormal, important/benign, critical/isolated, etc. In this work, we considered an approach that relies on visual metaphors and machine learning algorithms to accomplish unattended topological classification with interactive visualization to explore event logs. By presenting large amount of information in a condensed and coherent view, one can gain an overview of the global relationships within the data. Additionally, it provides a frame of reference to embed fine-grained tasks, along with a view that reveals the data at several levels of detail and encourages the eye to compare different pieces of information. Moreover, providing interactive visualization is a means of letting viewers conduct exploratory analysis, giving a chance to discover the unexpected. In general, we believe there is a big difference between the rigidity and formalization required by traditional information systems, and the fluidity and intuition of the way we think and work as humans. Our work attempts to bridge that gap. 4. OverviewNetwork activity can usually be captured as a time ordered sequence of events. This operation can be performed by network sniffers, the Network Flight Recorder [Ranum et al., 1997], RMON and SNMP querying and trapping facilities, or using the logging mechanisms provided by firewalls and intrusion detection systems. Structured logs contain distinct and uniform entries characterizing each event or state by a given set of attributes. Each entry found in structured logs can be seen as a vector representing a point in a high dimensional space. In this space, the distance between two points is proportional to their dissimilarity. This provides us with the ability to compute the extent to which two network patterns are similar. Using these dissimilarities, we can use a dimensionality reduction process to map high dimensional points to a low dimensional representation. In our case, we rely on the self-organizing map algorithm [Kohonen, 1995], which provides us with a data reduction method to create a topologically ordered mapping. While such a process implies a loss of information, essential information is preserved and noise smoothed out. Many other techniques exist to perform the process of dimensionality reduction. Two popular approaches are principal components analysis and multidimensional scaling. Creating a mapping is equivalent to the concept of building profiles of the network activity. A mapping can therefore be compared with some subsequent network events, as long as they are of similar nature and follow the initial distribution. Appropriate visualization techniques can be used to graphically represent the output of such a mapping. Such visualizations provide for the visual comparison of a typical profile against new activity, thus highlighting divergences from the norm. The scheme we use to communicate this information provides the user with the overall frame of reference that visually highlights event correlation, and a set of interactive tools to conduct fine-grained exploration of the map. To evaluate our approach, we use a dataset provided by the Information Exploration Shootout project [Grinstein, 1996, 1997]. This dataset contains four different attacks: IP spoofing, ftp password guessing, network scanning, and network hopping. 5. A multidimensional modelThe attributes describing the characteristics of each entry in the logs form an n-dimensional space, where n is the number of attributes (see figure 1). Thus, each event has a unique spatial position depending on its specific characteristics. To create a context for the network activity, we must be able to compare one event to another using a similarity function. Such a function defines the extent to which two network events are related. Dissimilarities can be seen as distances in the metaphorical sense. Defining a similarity or distance function implies subjectivity and tacit knowledge should be used where available. 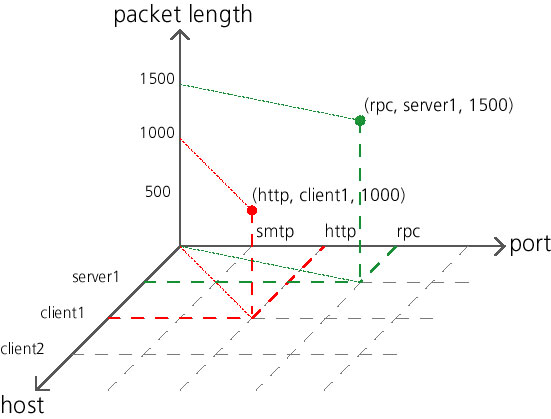
Figure 1. This graph depicts how each event may be seen as a point in a multidimensional space. Events are placed on each axis according to the values of their respective attributes. In this model, each attribute is equivalent to a sin-gle dimension. Of course, the datasets we are interested in contain many more dimensions. For our purpose, we mainly rely on the Euclidean metric, along with domain knowledge where available for weighting the different dimensions depending on their importance. However, our approach has one particularity in how categorical attributes are treated. This case is frequent with network protocols, where for example flags or types of service do not have any special order. In our case, we treat these attributes with one dimension for each categorical value, resulting in a very high-dimensional, but conceptually correct space. 6. Mapping the network activityWhile we could rely on scatter plots or similar techniques to display information such as which hosts communicate with each other, we would like to provide the network administrator with a comprehensive picture of what is going on. These f what is going on. These techniques are limited to a low number of dimensions that can be depicted simultaneously. A high-dimensional space like the one we described earlier cannot be directly portrayed to the user. In order to provide an overview of the network activity, we must reduce the dimensionality to create a representation of the relative similarities of events. By creating low-dimensional representation on a plane, the depiction on a screen or on paper can easily be achieved. We like to describe such representations as maps, with the particularity of conveying abstract relationships. Events that are similar are placed close together while events with unrelated patterns are further apart. In our previous paper [Girardin et al., 1998], we performed the dimensionality reduction process using two competing methods. The first was a method inspired from physics, the spring layout algorithm, while the other was the self-organizing map algorithm. During the present work, we did not rely on the spring layout algorithm due to its scalability issues. However, the spring layout algorithm might still be useful for obtaining more detailed information as this could be achieved by a coupling with the self-organizing map algorithm. Please refer to [Chalmers, 1996] for further information on the spring layout algorithm, and to [Girardin et al., 1998] for a description on how we use the two methods together. We use an artificial neural network, the self-organizing map algorithm [Kohonen, 1995] to accomplish the dimensionality reduction process. Self-organizing maps are inspired from biology and are designed to behave, for example, like the somatotopic map of the motor nerves and the tonotopic map of the auditory region. The self-organizing map algorithm, is an unsupervised (self-organizing) neural network composed of an input layer and a competitive/output neural layer. For our purpose, the most interesting property of this network is that the feature map preserves the topology of stimuli according to their similarity. This algorithm does not depend on any prior knowledge of the network, and in this sense we can say that it exhibits self-organization. The kind self-organizing maps we use are composed of a discrete two-dimensional grid of units (also referred to as neurons within the artificial intelligence community). The algorithm is initiated by setting weights for each unit to random values. While feeding the network with events, the unit with a weight vector that matches the input pattern the best is sought. Then, the weight vector of this best match is slightly adjusted to resemble more closely the input pattern. Through iterations, the network will produce discrete maps that exhibit as best as possible the topology of the input space. Moreover, the network learns the distribution of the input patterns and will attempt to generalize it within a space of lower dimensionality. The self-organizing map algorithm in the learning process stage can be summarized as follows (please refer to figure 2 for a graphical description): 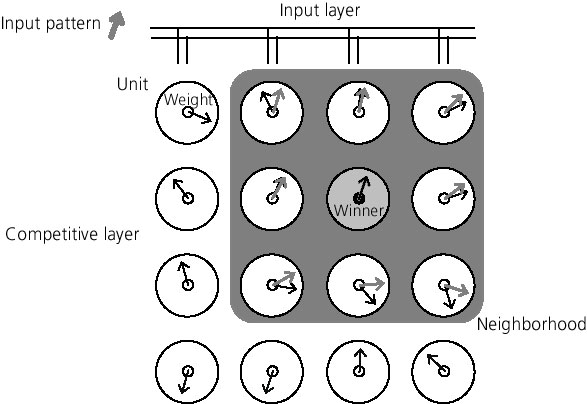
Figure 2. The adaptation process in the self-organizing map algorithm iteratively feeds the input layer with patterns. The initial configuration is random (black arrows). Then, the unit with a weight that best matches the input pattern, the winning node (gray unit), is sought in the competitive layer. Weights in the neighborhood (gray area) of the win-ner are now be slightly adjusted to resemble more closely the input pattern (gray arrows).
One problem with the adaptation process is that it is limited to continuous attributes. To cope with this limitation, we created a special kind of weight that holds a dynamically growing dictionary of weighted categorical values. Thus, each categorical weight is a vector in a subspace containing only the categories relevant to its associated unit. The result of this process can be used to map any multidimensional dataset to units on the grid. Data points that are close in the high dimensional space will result in close units on the map. However, the dataset that has been used for the training and the one that is to be mapped must be of the same nature and, for optimal results should contain the same distribution as the data. For each entry, a measure of the mapping quality can be computed using a quantization error, which is the distance from one input data point to the best matching weight vector. The self-organizing map algorithm outperforms other comparable methods [Li et al., 1995]. The computational time needed to create a map is proportional to the number of units in the map and to the number of input dimensions, but not to the size of the input dataset. However, datasets containing complex relationships will certainly need more iterations to achieve convergence during the training stage. There is still no theoretical proof about the convergence of the self-organizing map algorithm. Additionally, the different training parameters must be determined through empirical experimentation. Indeed, the number of iterations, the extent to which the weight vectors must be adapted, the size of the neighborhood, and the number of units composing the map must be specified manually. However, these issues are being tackled through growing self-organizing networks such as the one presented in [Fritzke, 1995]. 7. Visualization of the self-organizing mapsThe topology-preserving and dimensionality-reducing mapping performed by the self-organizing map algorithm is ideal for data visualization. We portray the units as squares within a grid and depict for each unit the following values (see figure 3): 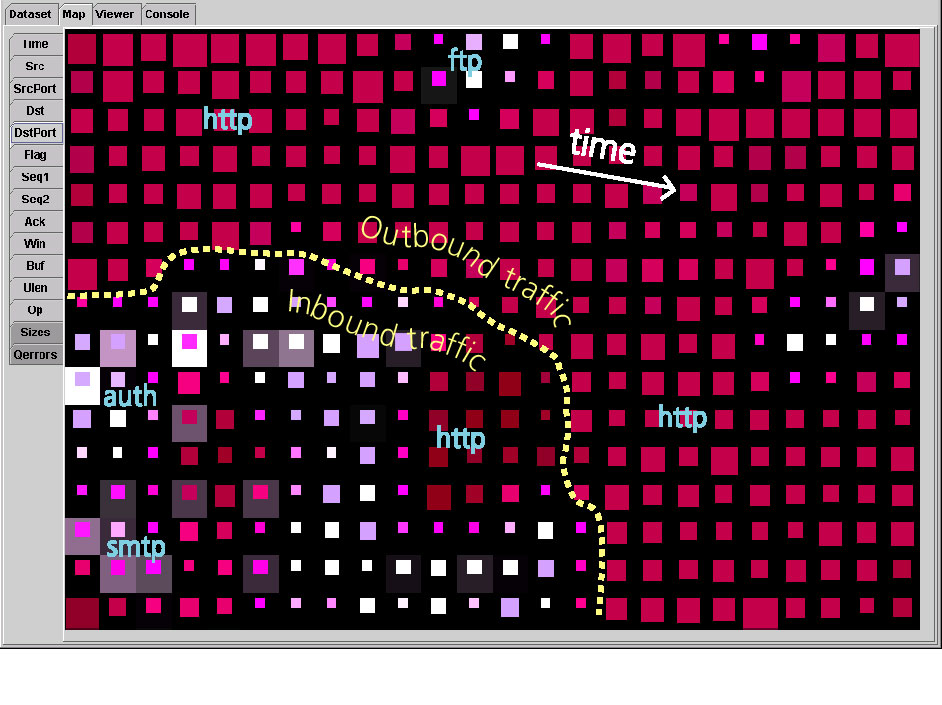
Figure 3. The user interface provides the possibility of showing the map colored by different attributes (panel on the left). In order to spot areas of similar nature across several attributes, the user can visually compare their distribution on the map to detect boundaries and correlated events. For example, we can see on this map that more connections are coming from the outside than from the inside. It also allows us to spot which are the main protocols flowing on the network. Additionally, because the outbound traffic is mainly composed of http requests, time becomes the prominent feature that gives order to this region.
Our user interface lets network administrators select which feature (time, source and destination hosts and ports,�) they are interested in. The selection results in an appropriate coloring that can be used to spot area containing similar behaviors. The size of each square is proportional to the number of network events that the unit contains. It allows for immediate identification of both the main and less frequent types of traffic. The quantization error communicates the quality of the mapping. Usually, a high quantization error is the result of atypical and rare events. This may also be used in the context of anomaly detection where we would like to compare some network events to a previously built profile. The quantization error visually reflects how well these events match the typical activity. Therefore, there are no false positives; network administrators can decide how much they are willing to investigate these anomalies depending of their priorities and time. Finally, selecting a unit in the map results in the display of the list of network events clustered in that location. 8. Exploration of an intrusion detection datasetFor our experiment, we use the network intrusion dataset provided for the Information Exploration Shootout project [Grinstein, 1996, 1997]. It consists of four different attacks provided in distinct files. Additionally, a baseline file that contains no attack is provided. The traffic was captured using the tcpdump tool and contains the following attributes for each network event:
Each file is roughly 50MB in size (30MB in comma separated format) and contains about 20 minutes of traffic captured on The MITRE Corp. network. These files are publicly available from http://iris.cs.uml.edu:8080/. Unfortunately, the different have been modified in a way which somewhat limits our ability to analyze them. The modifications include:
Therefore, this dataset only offers limited information to clearly find out which hosts are communicating with each other. Moreover, it does not permit the use of the baseline as a profile for the files containing each attack. Otherwise, it would have been very easy to spot the traffic that deviates from the norm. Through the analysis of the profile, we gained information about the typical traffic that flows within the MITRE network. Most of it is composed of http requests, more frequently outbound than inbound. The smtp protocol is also popular on their network and has the particularity of triggering ident queries every time a connection is initiated. Moreover, ident requests are most of the time not honored by the different mail servers and result in a reset of the connection. The activity described here can be also be seen in figure 3. We also found many connections from few external hosts to UDP port 7001. Additionally, some telnet, ftp, netbios related traffic was also spotted. Note that we only used this information to get a feeling of the nature of the network activity, and we did not use this profile for automatic comparison with the subsequent attacks. The first attack involves the IP spoofing scheme used by Kevin Mitnick against Tsutomu Shimomura's computers on Christmas day, 1994 [Shimomura et al., 1996]. This attack was detected because some connections were left half-open, providing evidence of a SYN flooding denial of service scheme [Schuba et al., 1997]. The few connections that did not finish the three-way TCP handshake were unusual enough to be isolated on the map. The unusual number of connections initiated to the internal servers first captured our attention. Indeed, this was a clear indication that the mail and web servers had an outage. We also discovered many highly redundant packets and other strange behaviors, which were certainly symptomatic of an attempted IP spoofing scheme. Additionally, we found a network scan with connections every 5 seconds on unusually high UDP ports. Finally, we believe that the attack resulted in the ability of the intruder to gain telnet access, but we are unsure about this fact because of hidden internal network topology. When exploring the second file, we found an unusually high number of FTP connections initiated on the internal network and directed towards 12 distinct hosts. There was a total of more than 60 suspicious connections that did not trigger any connection back through the ftp-data port, which makes us believe this was a password guessing attempt (and possibly a success). The attack started at 16:05 and ended at 16:20 (with a maximum of 10 connections per minute), which probably means that it had been automated or done by a good typist. This discovery includes 12 connections made within a 3 minute interval that was directed towards machines on the internal network that was possibly legitimate. Spotting this intrusion was aided by the correlation amongst the following features:
It was easy to discover a network scan contained in the third file (see figure 4). The scanning activity was made from and to the internal network. Hosts were probed through the echo port throughout the monitored period. At 15:26, certainly as a result of a host responding to the echo packet, a complete range of more than 40 ports were inspected. This activity had a one minute duration. Because many connections from a single source were initiated, their similarities resulted in one unit in the self-organizing map that clustered most of them (some were clustered in other close units). 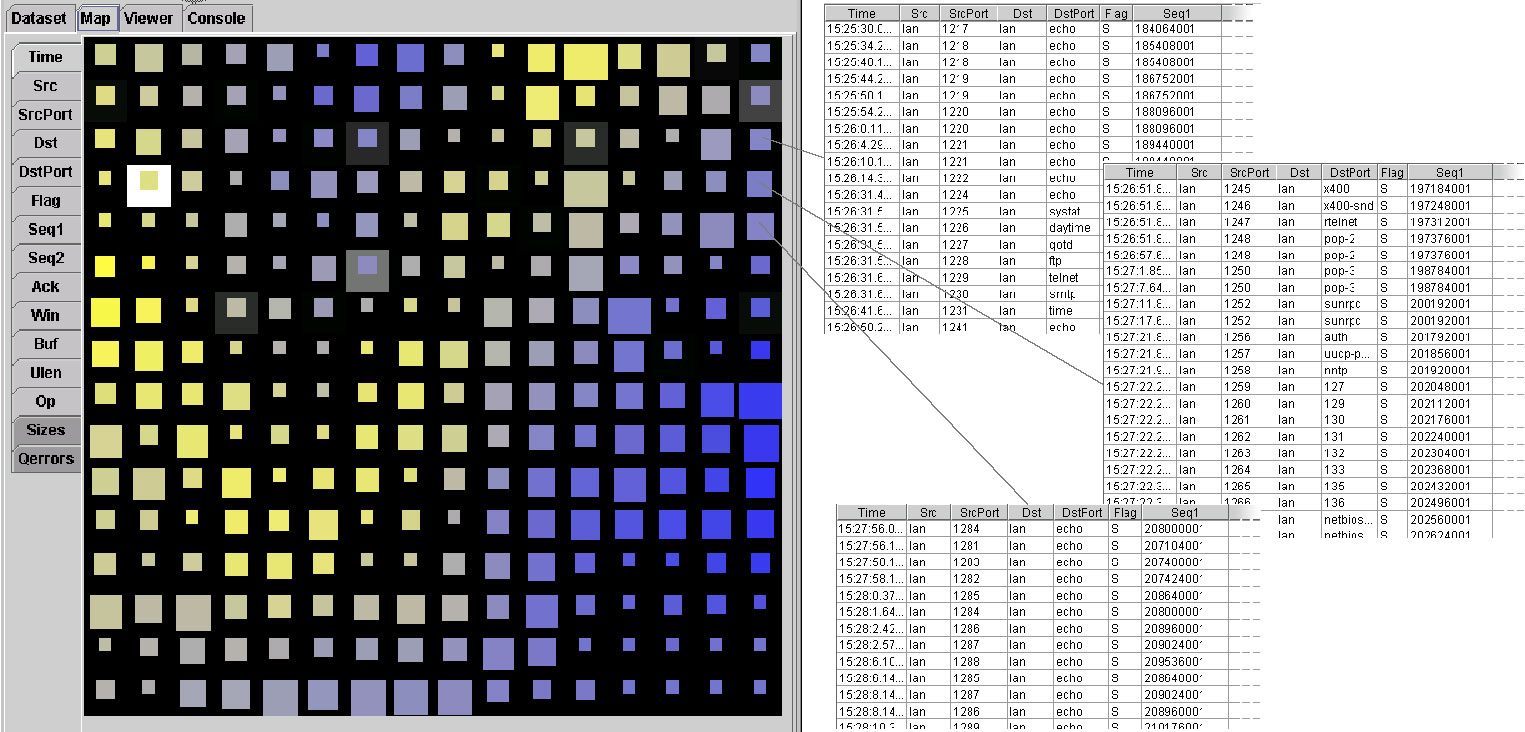
Figure 4. The activity resulting from the scanning attack has been mapped on three adjacent units. These units were inspected because of the distinctive nature of some of the attributes (time, hosts and ports, etc.). The upper unit contains the initial echo packets aimed at probing machines availability. The port scanning activity, which can mainly be found in the middle unit, probably followed the successfull probe of a host. The continuation of the network scan can be found in the lower unit. The fourth attack was discovered because of a high correlation between some incoming and outgoing traffic. Indeed, some telnet packets going to the internal network were almost identical, both temporally and in term of size, to some rlogin packets directed towards an external host. This is clearly an indication of some network hopping activity. Network hopping is where one connection is used to initiated another connection to the outside, possibly in the hope of making tracing more difficult. The computational time required by the self-organizing map algorithm for processing the above files on a 400 MHz workstation varied from 15 minutes to 2 hours, depending of the granularity of the map. Our prototype has been developed in Java and has not yet been optimized for speed. Furthermore, the algorithm is scalable for use on multiprocessor machines. 9. New directionsAfter having analyzed the network activity at the protocol level, we now feel that the information of such datasets is too poor to make complex patterns easily apparent. We think that using multiple sources of logs and finding ways to relate them could make our approach more effective. For instance, information from routers, firewalls, network sniffers, hosts, and networked applications can be grouped together and the causality of each event against others specified. We believe that such a scheme can greatly augment the value of the information and that unexpected behavior will be more easily detected. In our experiments, we used the notion time as just another dimension. However, a more sophisticated model could be created to take advantage of the special properties and importance of this feature, such as the detection of periodicity in the network events. This could provide a way to discover cyclic behaviors, such as a network backup or database update taking place every night. 10. ConclusionDuring this work, we havConclusion During this work, we have shown the use of a visual tool to explore and analyze network activity containing simple but popular attacks. Using self-organizing maps, the topological classification of the events is performed automatically and does not rely on any a priori knowledge about the content of the dataset. We use a map metaphor to provide the network administrator with a frame of reference and interactive facilities, enabling intuitive and effective interpretation of the information contained in these maps. Our system can be used to detect as many types of attacks that the event description model can possibly make explicit. We are confident that our tool will effectively support the discovery of unexpected, unforeseen, and hidden network behaviors. Additionally, our approach goes beyond intrusion detection and provides a global view of the activity under the administrator�s supervision. While the prototype we developed is still in its infancy, we have nonetheless shown that the visual paradigm for analyzing network activity is a powerful approach for anybody confronted with the monitoring of activity-based information. AcknowledgementsWe are indebted to a number of people who have contributed in this research. We are especially grateful to Karl Andersen, Dominique Brodbeck, Aline Chabloz, Hans-Peter Frei, Timothy Jones, Wendy Nather, Jon Rochlis, Václav Matyá�, Christian Zapf, and Kan Zhang for their interesting discussions, corrections, suggestions, developments, and support. Thanks also to Frederick Avolio for his insightful comments, suggestions and patience. Our gratitude also goes to Georges Grinstein for having made the network intrusion dataset available. References[Amoroso, 1994] Amoroso, Edward. "Fundamentals of computer security technology." Upper Saddle River: Prentice-Hall, 1994. ISBN: 0-13-108929-3. [Anderson et al., 1995] Anderson, Debra; Lunt, Teresa F.; Javitz, Harold; Tamaru, Ann; Valdes, Alfonso. "Detecting Unusual Program Behavior Using the Statistical Components of NIDES." Menlo Pak: SRI International, 1995. Tech. Report SRI-CSL-95-06. [Avolio, 1998] Avolio, Frederick M. "A multi-dimensional approach to internet security."; netWorker vol. 2.2, April 1998, pp. 15-22. [Chalmers, 1996] Chalmers, Matthew. "A Linear Iteration Time Layout Algorithm for Visualising High-Dimensional Data." Proc. IEEE Visualization '96, San Francisco, California, USA, October 1996. [Couch et al., 1996] Couch, Alva L. "Visualizing Huge Tracefiles with Xscal." Proc. 10th Systems Administration Conference (LISA'96), Chicago, IL, USA, September 29-October 4, 1996, pp. 51-58 [Frank, 1994] Frank, Jeremy. "Artificial Intelligence and Intrusion Detection: Current and Future Directions." Proc 17th National Computer Security Conference, 1994. [Fritzke, 1995] Fritzke, Bernd. "Growing Grid - a self-organizing network with constant range and adaptation strength." Neural Processing Letters, vol. 2, no. 5, 1995, pp. 9-13. [Geer et al., 1997] Geer, Dan (editor); Oppenheimer, David L.; Wagner; David A.; Crabb, Michele D. "System Security: A Management Perspective." Berkeley: The Usenix Association; 1997. ISBN: 1-880446-85-5. [Girardin et al., 1998] Girardin, Luc; Brodbeck, Dominique. "A visual approach for monitoring logs." Proc. 12th Usenix System Administration conference, Boston, Massachusetts, USA, December 6-11, 1998, pp. 299-308. [Grinstein, 1996] Grinstein, Georges (organizer). "Information Exploration Shootout or "Benchmarks for Information Exploration"." Proc. IEEE Visualization '96, San Francisco, California, USA, October 1996, pp. 449-450. [Grinstein, 1997] Grinstein, Georges (organizer). "Information Exploration Shootout Project and Benchmark Data Sets: Evaluating how Visualization does in Analyzing Real-World Data Analysis Problems. "Proc. IEEE Visualization '97, Phoenix, Arizona, USA, October 20-21, 1997, pp. 511-513. [Hofmeyr et al., 1998] Hofmeyr, Steven A.; Forrest, Stephanie; Somayaji, Anil. "Intrusion detection using sequences of system calls." Journal of Computer Security, 1998. [Hughes, 1996] Hughes, Doug. "Using Visualization in System and Network Administration." Proc. 10th Systems Administration Conference (LISA'96), Chicago, IL, USA, September 29-October 4, 1996, pp. 59-66. [Karam, 1994] Karam, Gerald M. "Visualization using Timelines." Proc. 1994 International Symposium on Software Testing and Analysis, Seattle, WA, USA, August 17-19, 1994. [Kohonen, 1995] Kohonen, Teuvo. "Self-organizing maps." Berlin; Heidelberg; New-York: Springer; 1995. ISBN: 3-540-58600-8. [Lane et al., 1997] Lane, Terran; Brodley, Carla. "An Application of Machine Learning to Anomaly Detection." 20th Annual National Information Systems Security Conference; Coast TR 97-03; 1997. [Lankewicz et al., 1997] Lankewicz, Linda B.; Srikanth, Radhakrishnan; George, Roy. "Anomaly Detection using Signal Processing and Neural Nets." Proc. ONDCP International Technology Symposium, Chicago, USA, 1997. [Li et al., 1995] Li, Sofianto; Vel, Olivier de, and Coomans, Danny. "Comparative analysis of dimensionality reduction methods," Learning from Data: Artificial Intelligence and Statistics V, New York: Springer-Verlag, 1995, pp. 323-331. [Monmonier, 1991] Monmonier, Mark. "How to lie with maps." Chicago, London: The University of Chicago Press; 1991. ISBN 0-226-53414-6. [Oetiker, 1998] Oetiker, Tobias. "MRTG - The Multi Router Traffic Grapher." Proc. 12th Usenix System Administration conference, Boston, Massachusetts, USA, December 6-11, 1998, pp. 141-147. [Power, 1998] Power, Richard. "Current and Future Danger." San Francisco: Computer Security Institute; 1998. [Ranum et al., 1997] Ranum, Markus J.; Landfield, Ken; Stolarchuk, Mike; Sienkiewicz, Mark; Lambeth, Andrew; Wall, Eric. "Implementing a Generalized Tool for Network Monitoring." Proc. 11th Usenix Systems Administration Conference, San Diego, California, USA, October 26-31, 1997, pp. 1-16. [Ranum, 1998] Ranum, Marcus. "Intrusion Detection: Challenges and Myths." Network Flight Recorder, Inc; 1998. [Schuba et al., 1997] Schuba, Christoph; Krsul, Ivan, Kuhn, Markus; Spafford, Eugene; Sundaram, Aurobindo; Zamboni, Diego. "Analysis of a Denial of Service Attack on TCP." IEEE Symposium on Security and Privacy; Oakland, CA; Coast TR 97-06; May, 1997. [Shimomura et al., 1996] Shimomura, Tsutomu; Markoff, John. Take Down. New York: Hyperion; 1996. ISBN: 0-7868-8913-6. [Tan, 1997] Tan, Kymie. The Application Of Neural Networks to UNIX Computer Security. 1997. |
|
This paper was originally published in the
Proceedings of the 1st Workshop on Intrusion Detection and Network Monitoring, April 9-12, 1999, Santa Clara, California, USA
Last changed: 21 Mar 2002 ml |
|
