| ||||||||||||||||||||||||||||||||||||||||||||||||||||
USENIX Technical Program - Paper - 1st Workshop on Intrusion Detection and Network Monitoring
[Technical Program]
Intrusion Detection through Dynamic Software Measurement
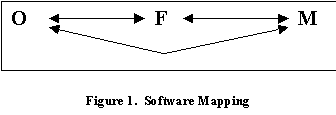
Sebastian Elbaum John C. Munson Computer Science Department University of Idaho Moscow, ID 83844-1010 {elbaum, jmunson}@cs.uidaho.edu Abstract The thrust of this paper is to present a new real-time approach to detect aberrant modes of system behavior induced by abnormal and unauthorized system activities. The theoretical foundation for the research program is based on the study of the software internal behavior. As a software system is executing, it will express a set of its many functionalities as sequential events. Each of these functionalities has a characteristic set of modules that it will execute. In addition, these module sets will execute with clearly defined and measurable execution profiles. These profiles change as the executed functionalities change. Over time, the normal behavior of the system will be defined by profiles. An attempt to violate the security of the system will result in behavior that is outside the normal activity of the system and thus result in a perturbation in the normal profiles. We will show, through the real-time analysis of the Linux kernel, that we can detect very subtle shifts in the behavior of a system. INTRODUCTION The literature and media abound with reports of successful violations of computer system security by both external attackers and internal users [6,9]. Very recently, we experienced such an attack by a hacker on one of our Linux based computers at the University of Idaho. These breaches occur through physical attacks, social engineering attacks, and attacks on the system software. It is this later category of attack that is the focus of this paper. During an attack, the intruder subverts or bypasses the security mechanisms of the system in order to gain unauthorized access to the system or to increase their current access privileges. These attacks are successful when the attacker is able to cause the system software to execute in a manner that is typically inconsistent with the software specification and thus leads to a breach in security [1]. Intrusion detection systems monitor traces of user activity to determine if an intrusion has occurred. The traces of activity can be collated from audit trails or logs [3,14,21], network monitoring [12,17] or a combination of both. Once the data regarding a relevant aspect of the behavior of the system is collected, the classification stage starts. Although taxonomies that are more complex exist [5,9], intrusion detection classification techniques can be broadly catalogued in the two main groups: misuse intrusion detection [15,16] and anomaly intrusion detection [3,13,20]. The first type of classification technique searches for occurrences of known attacks with a particular "signature" and the second type searches for departures from normality. Some of the newest intrusion detection tools incorporate both approaches [2,7,20]. The intent of this paper is to report on our work on the software engineering approach of dynamic software measurement to assist in the detection of intruders. Dynamic software measurement provides a framework to analyze the internal behavior of a system as it executes and makes transitions among its various modules governed by the structure of the program call graph. What is novel about our approach to dynamic intrusion detection is that we instrument the target system so that we can obtain measurements to profile the module activity on the system in real time. This paper reports on our investigations in intrusion detection with an instrumented Linux kernel. The objective of this research program has been to study the nominal behavior of the kernel software under a typical task load and then measure the direct effect of the application of a suite of known intrusion scenarios in the presence of the nominal activity. As we will see, program modules are distinctly associated with certain functionalities and operations that the program is capable of performing. As each operation is executed, a subset of software modules is executed which creates a particular and distinct signature of transition events [19]. As we come to understand the nominal behavior of a system as it is executing its customary activities we can profile this nominal system behavior quite accurately. Departures from the nominal system profile represent potential invidious activity on the system. Some unwanted activity may be understood from previous assaults on the system. We can store profiles and recognize these activities from our historical data. What historical data cannot do is to permit us to recognize new assaults. An effective security tool would be designed to recognize assaults as they occur thorough the understanding and comparison of the current behavior against nominal system activity. SOFTWARE ARCHITECTURAL MAPPING Software systems are constructed to perform a set of operations for their customers, the users. An example of such an operation might be the activity of adding a new user to a computer system [1]. At the software level, these operations must be reduced to a well-defined set of functions. These functions represent the decomposition of operations into sub-problems that may be implemented on computer systems. The operation of adding a new user to the system might involve the functional activities of changing to current directory to a password file, updating the password file, establishing user authorizations, and creating a new file for the new user. During the software design process, the basic functions are mapped by system designers to specific software program modules. These modules will implement the functionality. This software mapping from operation to functionality to modules is represented in Figure 1.
From the standpoint of computer security, not all operations are equal. Some user operations may have little or no impact on computer security considerations. Other operations, such as, system maintenance activities, have a much greater impact on security. System maintenance activities being performed by systems administrators would be considered nominal system behavior. System maintenance activities being performed by dial-up users, on the other hand, would not be considered nominal system behavior. In order to formalize this decomposition process, a formal description of these relationships will be established [18].
Mapping Operations to Functionalities Assume that the software system S was designed to implement a specific set of mutually exclusive functionalities F. Thus, if the system is executing a function From a computer security standpoint, we can envision operations as the set of services available to a user (e.g., login, open a file, write to a device) and functionality as the set of internal operations that implement a particular operation (e.g., user-id validation, ACL lookup, labeling). When viewed from this perspective, it is apparent that user operations that may appear to be non-security relevant may actually be implemented with security relevant functionalities (sendmail is a classic example of this, an inoffensive operation of send mail can be transformed into an attack if the functionalities that deal with buffers can be overloaded). Mapping Functionalities to Modules The software design process is strictly a matter of assigning functionalities in F to specific program modules
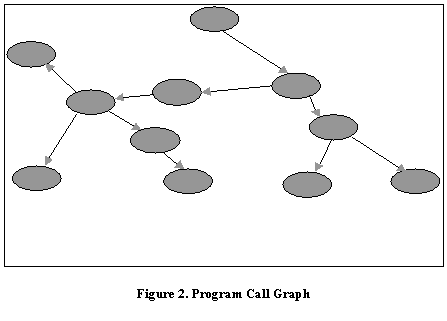
Mapping Modules to Operations We can see that there is a distinct relationship between any given operation, o, and a given set of program modules. That is, if the user performs an particular operation then this operation will manifest itself in certain modules receiving control. We can tell, inversely, which program operations are being executed by observing the pattern of modules executing, i.e. the module profile. In a sense, then, the mapping of operations to modules and the mapping of modules to operations is reflexive. It is a most unfortunate accident of most software design efforts that there are really two distinct set of operations. On the one hand, there is a set of explicit operations The set of implicit operations, THE PROFILES OF SOFTWARE DYNAMICS When the software is subjected to a series of unique and distinct functional expressions, there will be a different behavior for each of the user's operations. Each operation will implement a different set of functions that will in turn, invoke possibly different sets of program modules.
Operational Profile As a user performs the various operations on a system, he/she will cause each operation to occur in a series of steps or transitions. The transition from one operation to another may be described as a stochastic process. In which case we may define an indexed collection of random variables Each user may potentially bring his/her own distinct behavior to the system. Thus, each user will have his/her own characteristic operational profile. It is a characteristic, then, of each user to induce a probability function Functional Profile As the system progresses through the steps in the software lifecycle, the user requirements specifications, the set O, must be mapped on a specific set of functionalities, F, by system designers. This set F is in fact the design specifications for the system. As per our earlier discussion, each operation is implemented by one for more functionalities. The transition from one functionality to another may be also be described as a stochastic process. In which case we may define a new indexed collection of random variables When a program is executing a given operation, say
Alternatively,
Module Profile The next logical step is to study the most internal behavior of a software system, the module level. Each of the functionalities is implemented in one or more program modules. The transition from one module to another may be also be described as a stochastic process, in which case we may define a third indexed collection of random variables Each functionality j has a distinct set of modules
Again,
The module profile, r, ultimately depends on the operational profile, p. We can see this by substituting for
Each distinct operational scenario creates its own distinct module profile. Operational profile characteristics can be inferred from the module profile. It is this fact that we wish to exploit in the detection of unwanted or intrusive events. Interestingly enough, for all software systems at the application level, there is a distinguished module, the main program module that will always receive execution control from the operating system. If we denote this main program as module 0 then,
The granularity of the term epoch is now of interest. An epoch begins with the onset of execution in a particular module and ends when control is passed to another module. The measurable event for modeling purposes is this transition among the program modules. We will count the number of calls from a module and the number of returns to that module. Each of these transitions to a different program module from the one currently executing will represent an incremental change in the epoch number. In practice: Execution Profile In reality, few, if any systems are understood at the functional or operation level. We are continually confronted with systems whose functionality is not completely understood. While we have developed methodologies to recapture the essential functionalities [10,18], the majority of the time we will not know the precise behavior of the system that we are working with. To this end we will develop a more relaxed form of profile called the execution profile of a system. The execution profile reflects the internal system behavior based only on the understanding of the modular activity. Although it is not as powerful as the family of profiles presented before, it is simpler and allows obtaining basic profile information under environments with poor specifications and other constraints. When a user is exercising a system, the software will be driven through a sequence of transitions from one module to the next,
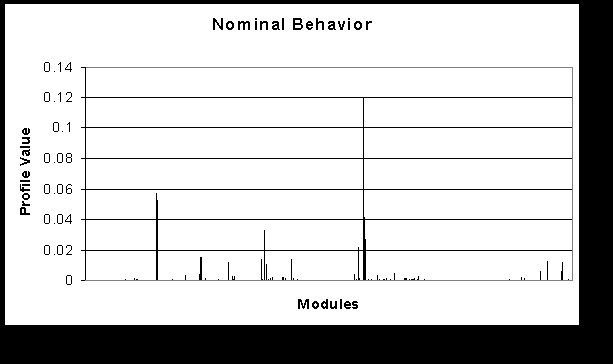
The whole notion of intrusion detection would be greatly facilitated if we knew what the functionalities of the system were. It would also be very convenient if we were to have a precise description of the set of operations for the software. Indeed, if these elements of software behavior were known and precisely specified, we probably would not have to worry about security faults in the behavior that present opportunities for hackers. In the absence of these specifications, we will assume that we cannot observe operational profiles nor functional profiles directly. Instead we must observe the distribution of activity among the program modules to make inferences about the behavior of the system. METHODOLOGY Objectives The main objective of our intrusion detection methodology is to trap in real-time any behavior that is considered abnormal. We want to observe the software modules and their behavior to determine with a certain level of confidence the existence of an intrusion. The two fundamental aspects used to determine an intrusion are the execution of a set of modules that define 1.) An implicit operation and 2.) A set of explicit operations in abnormal sequences or quantities. This intrusion detection approach observes not only the external events produced by the system (such us the popular "logs audit trails") but also the internal behavior of the software. The main advantages of observing and analyzing the internal behavior of the system instead of its external events are: 1.) Internal behavior disorders can be detected much earlier (external events might be visible much after the disorder started) 2.) It is more sensitive to anomalies because it makes observations at a system's component level. 3.) Higher level events can be derived from the lower level information provided by the internal analysis. In order to accomplish internal system behavior monitoring, we have developed a suite of profiler techniques that allows us to track the component interactions at the module level as stated before. These interactions constitute fingerprints of systems behavior that are represented in the execution profile. Each user and application generate a unique behavior that can be characterized through this technique. Normal behaviors can be established and, while the system is running, its behavior can be compared to the one defined as nominal. If the current behavior statistically differs from the normal then a flag must be raised because there is a probability that the system is under attack. The phases of detection Detection instrumentation must really be installed at five different levels of software: the system kernel, the network layer, the file-system, the shell, and the end user application. At the kernel level, the operating system will generate and display a normal level of activity as shown in its nominal execution profile. When this profile shifts to an off-nominal profile, something new and potential intrusive is occurring on the system. At the network level, the generation, assembly and transport of data packages can be characterized by a profile. When package generation is abnormally increased or decreased, when the assembly produces enormous packages or when the send or receive process takes unusual steps then something abnormal and potentially dangerous is occurring at the network level. At the file system level, each user accesses different files, in different locations, with different frequencies that describe certain patterns that can be represented in a profile. At the shell level, each user generates a standard profile representing the normal activities that are customary for that person. Finally, each application generates profiles of characteristic nominal behavior for each activity [2]. In any of these levels, when a user profile begins to differ from a nominal profile by a pre-established amount, an alarm is activated. Two things might be wrong. An intruder has gained entry to the system and is masquerading as an existing user. Alternatively, a current user is acting abnormally (possibly, in anticipation of an eminent departure from the company) and means us harm. Although a complete intrusion detection system would take into consideration all five levels, at this experimental stage, we are focusing strictly on the kernel level. We are interested in the kernel because it has the most complex requirements in terms of timing constraints allowing us to evaluate the worst case performance burden. We are focusing in the application domain because the other levels can be considered subsets of the application level with some special characteristics. Since each one of these levels provides a different perspective for the system, we expect that the integration of these levels will provide us with a more integral view of the whole system security. At this point, we are only equipped to deal with them individually. Experimenting with the Linux Kernel In this paper, we are introducing for the first time a simplified and preliminary version of the internal behavior analysis of the Linux kernel. It is now possible to instrument any application written in C with the CLIC tool [8], even time constrained software such as a kernel. We have chosen to instrument the Linux kernel as an example of a security relevant real-time application. The CLIC tool was employed to insert the necessary hooks into 2500 C modules of the kernel. Then the Linux kernel was recompiled. We were then able to profile the nominal activities of the kernel under four distinct application environments. First, we profiled the kernel when there was no user activity, the system was idle. Next, we profiled the kernel when there were a number of compute-bound scientific programs running. We then profiled the system with a number of I/O intensive activities, such as edit functions, running. Finally, we obtain profiles for the system running a large number of relative small tasks including a variety of networked activities. From these various exercises of the Linux kernel, we were able to establish a baseline profile for its nominal functionality under a host of legitimate user activities. Figure 3 shows an execution profile with normal system activity. On the x-axis are the 2500 instrumented modules and on the y-axis the percentage of execution that each module received. The execution is measured in terms of epochs as it was explained in the profile section. Over a period of time we can clearly establish reasonable boundaries for the nominal user activities on a given Linux system. We would clearly like to be able to raise the alarm when off-nominal activity occurs. Off-nominal behavior will be classified into one of two mutually exclusive categories. First, is the case when we can match the signature of the activity with a known system assault [3,12]. Second, is when we do not recognize the nature of the activity. This new observation represents new system behavior. This may or may not represent an assault. In either event, a security tool must signal an alarm. The system administrator will be notified that either a known assault is in progress or that a novel activity is now running and should be examined further.
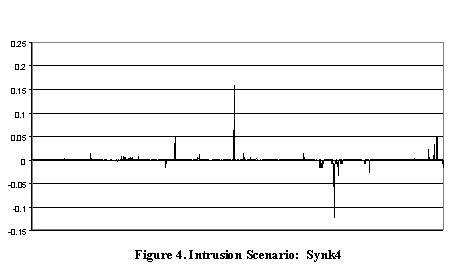
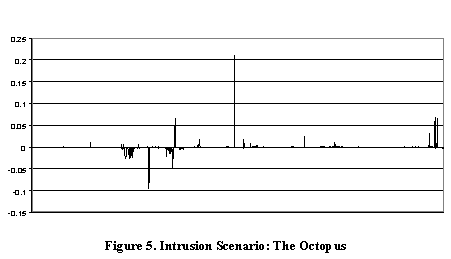
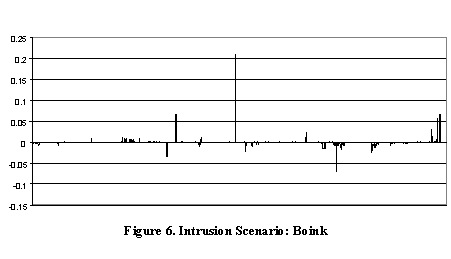
It was next of interest to examine the behavior of the kernel in response to a series of assault scenarios. In this investigation, we have explored several intrusion scenarios and their effect on the Linux kernel. Each activity running on the Linux kernel will cause the kernel to execute in a particular manner. By controlling for the effect of nominal system activity from any other activity we generate a signature profile for each one of them. In figures 4,5 and 6, we show the output of this differential comparison process for three intrusion scenarios we have investigated. The y-axis represents the impact of each intrusion activity on the nominal kernel activity. A positive value on the y-axis means that the system resources have decreased on the specific kernel module while the attack scenario was executing. Conversely, a negative value on the y-axis represents increased kernel module activity due to the intrusion.
The first attack scenario is produced by the program synk4. Synk4 floods the system ports with different types of requests. The system can be halted by overloading and IP addresses can be spoofed by this application. The second intrusion scenario is produced by Octopus. Octopus is usually used to generate a denial of service attack opening many connections to a remote host. The host is overwhelmed by the number of request and halts.
The last attack scenario is given by boink. Boink ex ploits the overlapping IP fragment bug present in most Linux kernels.
What is astonishing and is clearly revealed on inspection of the intrusion scenarios we present is that the signatures of each of these activities are very different. These distinct scenarios have their own recognizable signatures that differ sharply from the nominal activity profile. We are currently developing signatures for the full gamut of known intrusions. This will permit us to recognize the full spectrum of known attacks involving the Linux kernel. It will also permit us to identify new and potentially invidious assaults that we have yet to witness. CONCLUDING REMARKS We have presented a novel methodology for intrusion detection in real time that uses dynamic measurement techniques to analyze the internal software behavior. After a series of experiments, which were presented in this paper, we have shown that internal behavior analysis has an enormous potential as an effective means to detect abnormal activities that might constitute threats to a system. Through the real time analysis of the internal program activities we can detect very subtle shifts in the behavior of a system. In addition, based on the initial experiments, we can presume that each attack has a particular internal behavior signature that can be recognized. At this experimental stage, we have not addressed many issues. A more complete procedure and formalism for the determination of the normal profile is necessary. We haven't established a mechanism to reduce and filter the "noise" generated by multiple users and applications, although the multiple stage detection might provide some answers to that. Last, we are currently starting to assess the performance and the detection rates provided by this methodology and there is still a lot of work ahead of us in this arena. In order to validate our methodology, we have created an environment to allow experimentation and characterization of different profiles. The environment will provide a means to facilitate the study and evaluation of the comparison strategies and provide the experimentation platform to run attacks on. That a system has functioned securely in its past is not a clear indication that it will function securely in the future. The continuing evaluation of profiles over the life of a system can provide substantial information as to the changing nature of the program's execution environment. This, in turn, will foster the notion that software security assessment is as dynamic as the operating environment of the program. Though we have specifically chosen to focus our energies on the investigation of intrusions against the Linux kernel, the methodology we have presented in this paper is not restricted to kernel type activities. The kernel was our first choice because it is a complicated real time embedded application. If the technology can be shown to work in this complex environment, it will easily port to applications outside of the kernel. Any software system is a potential candidate for this methodology.
REFERENCES [1] J. Alves-Foss, D. Frincke and J. Munson. Measuring Security: A Methodological Approach, International Workshop on Enterprise Security, Stanford, CA, June 1996. [2] D. Anderson, T. Frivold and A. Valdez: Next-generation intrusion detection expert system (NIDES). Technical Report, Computer Science Laboratory, SRI International, Menlo Park, CA, SRI-CSL-95-07, May 1995. [3] D.Anderson, T.F. Lunt, H. Javitz, A. Tamaru and A. Valdes: Detecting Unusual Program Behavior Using the Statistical Component of the Next-generation Intrusion Detection Expert System (NIDES), SRI-CSL-95-06, SRI International, Menlo Park, CA, May 1995. [4] M. Bishop: A standard audit log format. Proc. of the 18th National Information Systems Security Conference, pp. 136-145, October 1995. [5] M.Bishop: A Taxonomy of UNIX and Network Security Vulnerabilities," M. Bishop, Technical Report 95-10, Department of Computer Science, University of California at Davis, May 1995. [6] CERT coordination Center http://www.cert.org/advisories [7] D. Denning: An intrusion-detection model. IEEE Transactions on Software Engineering, Vol.13, No:2, pp.222-232, February 1987. [8] S.G.Elbaum, J.C.Munson and M.Harrison. CLIC: a Tool for the Measurement of Software System Dynamics. Software Engineering Testing Lab technical report TR-98-04, University of Idaho, 1998. [9] Fathom Group - Intrusion Detection http://www.cs.uidaho.edu/~elbaum/fathom.html [10] G. Hall."Usage Patterns: Extracting System Functionality from Observed Profiles". Dissertation. University of Idaho. Computer Science Department. 1997. [11] L.R. Halme and R.K.Bauer: AINT misbehaving - a taxonomy of anti-intrusion techniques. Proc. of the 18th National Information Systems Security Conference, pp. 163-172, October 1995. [12] J. Hochberg, K. Jackson, C. Stallings, J.F.McClary, D. DuBois and J. Ford: NADIR: An automated system for detecting network intrusion and misuse. Computers & Security, Vol.12, No:3, pp.235-248, May 1993. [13] H.S. Javitz and A. Valdes: The SRI IDES statistical anomaly detector. Proc. of the IEEE Symposium on Research in Security and Privacy, pp.316-326, May 1991. [14] A.P.Kosoresow and S.A.Hofmeyr, "Intrusion Detection via System Call Traces", IEEE Software, Septemeber/October 1997, pp. 35-42. [15] S. Kumar and E.H. Spafford: A pattern matching model for misuse intrusion detection. Proc. of the 17th National Computer Security Conference, pp. 11-21, October 1994. [16] S. Kumar and E.H. Spafford: A Software Architecture to Support Misuse Intrusion Detection, Proc. 18th National Information Systems Security Conference, pp.194-204, 1995. [17] B. Mukherjee, L.T. Heberlein and K.N. Levitt: Network intrusion detection. IEEE Network, Vol.8, No:3, pp.26-41, May/June 1994. [18] J.C.Munson, A Functional Approach to Software Reliability Modeling. In Boisvert, ed., Quality of Numerical Software, Assessment and Enhancement, Chapman & Hall, London, 1997. ISBN 0-412- 80530-8. [19] J.C.Munson, "A Software Blackbox Recorder." Proceedings of the 1996 IEEE Aerospace Applications Conference, IEEE Computer Society Press, Los Alamitos, CA, November, pp. 309-320, 1996. [20] A.P. Porras and G.P. Neumann: EMERALD: Event Monitoring Enabling Responses to Anomalous Live Disturbances. National Information Systems Security Conference, 1997. [21] M. Sobirey, Richter and H. Konig. The intrusion detection system AID. Architecture, and experiences in automated audit analysis. Proc. of the International Conference on Communications and Multimedia Security, pp. 278-290, September 1996.
|
|
This paper was originally published in the
Proceedings of the 1st Workshop on Intrusion Detection and Network Monitoring, April 9-12, 1999, Santa Clara, California, USA
Last changed: 21 Mar 2002 ml |
|