Check out the new USENIX Web site.

Towards Fingerpointing in the Emulab Dynamic Distributed System 1

Michael P. Kasick, Priya Narasimhan
Electrical & Computer Engineering Department
Carnegie Mellon University

Kevin Atkinson, Jay Lepreau
School of Computing
University of Utah


Abstract: In the large-scale Emulab distributed system, the many failure reports make skilled operator time a scarce and costly resource, as shown by statistics on failure frequency and root cause. We describe the lessons learned with error reporting in Emulab, along with the design, initial implementation, and results of a new local error-analysis approach that is running in production. Through structured error reporting, association of context with each error-type, and propagation of both error-type and context, our new local analysis locates the most prominent failure at the procedure, script, or session level. Evaluation of this local analysis for a targeted set of common Emulab failures suggests that this approach is generally accurate and will facilitate global fingerpointing, which will aim for reliable suggestions as to the root-cause of the failure at the system level.

1  Introduction

When building a real-life distributed system, the immediate goals tend to center on creating a working system. Not only is proper error-reporting tangential to developing the core system, but frequently system designers do not know all of the possible errors, which ones will be frequent, or how to categorize them. As a result, many distributed systems are built with inadequate error-reporting mechanisms that unduly burden system operators. This can become particularly taxing in large-scale distributed systems, where component and communication failures can be the rule, not the exception.

As an example, operators of the Emulab network emulation testbed [7] at Utah received on average 82 machine-generated failure emails per day in April, 2006. Of these, a minority is uniquely indicative of infrastructure failures and, thus, is meaningful to operators. A second portion consists of user errors and diagnostic messages that Emulab operators use to help users proactively with problems and to improve the testbed infrastructure as a whole. However, the majority of failure emails redundantly confirm existing testbed problems or resource issues, and, thus, distract the operators' attention. The amount of human time and skill required to diagnose problems hinders Emulab's scalability, usefulness, and acceptability to other organizations that run Emulab testbeds. For such complex systems, one must provide an automated means for fingerpointing, i.e., diagnosing problems and tracing failures to their root-causes.

As with most large-scale distributed systems, Emulab exhibits complex interdependencies between resources, user interactions and system components. One challenge in fingerpointing is understanding how the pieces of the Emulab infrastructure fit together, when the majority of its code is understood only by its developers. Determining and categorizing the various error types, when errors are largely undocumented, is another problem. However, Emulab has its advantages for fingerpointing. First, as an ASP, Emulab can and does log most significant user interaction, and retains long-term historical data about failures and many of the root-causes. Second, all this occurs in a real-world, large-scale distributed setting involving multiple, concurrent users and experiments, as well as hundreds of hardware and software components. Third, we are developing and deploying new error-discrimination systems in a phased manner, allowing us to quantify their impact.

Through error-reporting and fingerpointing techniques, we seek to reduce operational cost by automatically and accurately diagnosing the majority of Emulab's day-to-day failures. We leverage the existing error-reporting systems to determine empirically which errors are the most frequent. We then target this set of errors in the development of a new error-reporting system that aims for greater accuracy and less maintenance. This more structured error-reporting serves as the first stage of what will be a global, event-driven root-cause analysis that fingerpoints problems with fine granularity.

2  Context: Emulab


The Emulab network emulation testbed is itself a large-scale distributed system. Statically, it currently consists of 490,000 lines of custom source code in 1900 files, plus components from elsewhere. The Utah site serves over 1300 users, manages 430 diverse local physical nodes, 740 distributed nodes in whole (RON) or in part (PlanetLab), dozens of switches and power controllers, thousands of cables, and six robots. Dynamically, it manages thousands of virtual nodes, dozens of active experiments, and thousands of “swapped out” experiments. Most of the system runs on two core servers with 64 daemons and periodic processes (37 custom, 27 standard), plus one daemon per active experiment. 12 more daemons run on each active test PC. Each time that a node is configured as a part of an experiment, the servers run about 40 scripts and the nodes run between 10 and 90 scripts, depending on type. We leverage the elabinelab facility, an implementation of the Emulab testbed within another Emulab testbed, for our initial experimentation.

A key Emulab function is to allocate and configure networks and nodes according to users' experimentation needs. Each experiment request consists of a description of the number and types of nodes, typically in a custom network topology. Emulab dynamically configures the nodes and networking layers accordingly. An emphasis on interactive use makes setup speed a priority, so the system is heavily parallelized and avoids conservative timeouts, leading to additional complexity in this step. Three fundamental swap-* procedures are involved:

Swap-in allocates the requested hardware nodes and configures Emulab's switching infrastructure to emulate the requested network topology. Once the configuration is readied, the user is granted root access to the allocated machines and exclusive use of the virtual network for the experiment's duration.

Swap-out tears down a previously swapped-in experiment, freeing the allocated nodes back into an available node-pool but maintaining the experiment configuration so that the experiment may be swapped-in again and continued at a later date.

Swap-modify allows a user to reconfigure a running or swapped-out experiment to add or remove nodes or modify the virtual network topology.

3  History of Error-Reporting/Analysis

The Emulab software originally reported errors by writing diagnostic messages to stderr, which was logged and emailed to both operators and the affected user upon a swap-* failure (swap-* procedures are the primary sources of important errors, and the bulk of this paper implicitly focuses on that area).


Category Clusters Messages
DB Software 13 2% 1485 60%
Hardware Error 19 2% 19 1%
Audit 41 5% 42 2%
Unix System Software 49 6% 60 2%
Informational 77 9% 82 3%
Emulab Software 189 23% 303 12%
Resource Shortage 205 25% 220 9%
User Error 221 27% 248 10%


Table 1: Breakdown of automated messages sent to testbed operators in a representative month, April 2006. A cluster is a group of messages in which each message is issued within 60 seconds of the previous.


As Emulab grew in size and gained popularity, the number of automatic failure emails became a significant cost in skilled operator time. Table 1 shows the statistics for a sample month, broken down semi-manually, although imperfectly. Note how large numbers of certain errors are temporally clustered, a key clue for both human and automated analysis. These statistics show that 82 automated emails, but only 27 clusters, were generated per day on average.

Each category in Table 1 contains messages relevant to testbed operators. Because of message redundancy, it is often unnecessary for testbed operators to analyze each message one-by-one. However, due to their volume, most of these messages are ignored outright. One goal of global fingerpointing is to reduce the number of these redundant messages while preserving enough of them to identify unique system-wide problems.

3.1  Initial Attempt at Fingerpointing

To reduce the volume of failure emails, we developed a more robust logging mechanism, tblog, for the post-processing and filtering of error messages. tblog consists of a Perl module that provides testbed scripts with an interface to an error-log database. Diagnostic messages from each script's stdout and stderr streams are automatically logged in this database with a unique swap-* session ID. tblog also allows scripts to write messages directly to the error-log database with optional additional context, such as the cause of the error.


Figure 1: Manual hinting vs. automated tblog post-processing of the script call-chain for a real failure on Emulab.


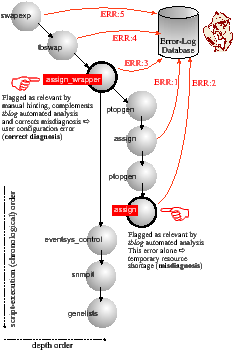
The context written to the error-log database allows for the post-processing and analysis of swap-* failures. During the post-failure cleanup phase, tblog tries to determine which of all of the errors generated in the current session are the most relevant to operators in diagnosing the failure's cause. tblog reconstructs the script call-chain for each reported error. Analogous to a call-stack backtrace, the script call-chain describes script-execution in both chronological and depth orders (see Figure 1 for a real example). tblog ascertains which script (assign in Figure 1), of those in the call-chain, recorded errors most recently at the greatest depth; this script and its associated errors are flagged as relevant. This approach works well in many cases because errors reported earlier chronologically (ERR:1) are often inconsequential to later errors (ERR:2) at a given depth. Errors reported at shallower depths (ERR:4–5) than the flagged scripts (ERR:3) are assumed to provide only summary or redundant information.

tblog has improved error discrimination and reduced the failure-message load. tblog identified 63% of all swap-* failure messages in April as not warranting operator attention so that operators could filter these messages out.

3.2  Lessons learned from the tblog Approach

Opaque Failure Messages:
tblog's human interpretable (rather than machine interpretable) failure messages are often vague or lacking in context details. While they may identify the error manifestation, the failure messages do not provide enough additional information for spatial correlation across multiple failures. Second, the failure messages themselves are cumbersome to parse. Strict message-matching rules can become outdated when failure messages are altered or updated; loose matching rules can lead to obfuscation when multiple unrelated failure messages are mistakenly traced to the same root-cause. Third, two scripts may, in fact, be generating the same error, but that error can manifest itself in the form of two different messages if the scripts are written by different authors. Thus, writing an error parser for the machine analysis of tblog-collected failure messages is impractical.

Because of the variety of Emulab failure messages and inconsistencies between them, these failure messages do not directly map to discrete error types. The only attempt to categorize the failure messages has been through tblog's root-cause assignment (canceled, hardware, internal, software, temp, user, and unknown). Unfortunately, these cause assignments are coarse categories that by themselves are not precise enough to facilitate global fingerpointing. Without discrete error types or fine-grained error categorization, (i) it is impossible to automatically generate even simple statistics concerning the number and frequency of different Emulab errors, and (ii) there is no discernible direction in which to drive global analysis.

Absence of Error Context:
Although tblog captures a general context (including time stamp, script name, etc.) for each error, the specific context (including relevant nodes, operating system images, and other experiment configuration parameters) surrounding different errors is sometimes not explicitly logged or propagated because tblog's opaque error messages often do not include these variables. In manual error-analysis, testbed operators must look up these variables from the experiment configuration or by examining the entire experiment log that includes informational and debug messages as well as “irrelevant” errors and warnings. Although human operators can locate and infer relevant parameters, these parameters must be incorporated with the error information in an automated global root-cause analysis engine.

4  Structured Error Reporting:
A New Approach

The lessons learned from tblog reveal the inadequacies of any similarly constructed error-reporting mechanism in a large-scale distributed system. These lessons also drive our requirements and our design for a new local error-analysis approach that would be much more suited for global fingerpointing.

4.1  Ingredients of a Solution

We have identified two requirements of a generalized error reporting system for facilitating global analysis.

Discrete Error Types:
All generated errors must be assigned a single specific error type. Error types should be well described so that there is no ambiguity behind the meaning of an error. While testbed operators may be able to infer the exact meaning of an error, machine analysis benefits from consistent and well-defined error input. Furthermore, discrete error types are easily queryable for gathering statistics; maintaining up-to-date statistics on relative error frequencies provides direction for global fingerpointing.

Error Context & Propagation:
Each discrete error type should be accompanied by any contextual information. Given that we are recording all of the error information (including context) in the error-log database, the context categories must be consistent. Global analysis can then perform context correlation across many errors of the same type, increasing fingerpointing precision.

The context must be captured at the time that the error is generated. As the script call-chain continues to execute or is aborted, any subsequent errors and their associated context must be grouped to form a cumulative error context for the scope of the local error-analysis domain (which happens to be a swap-* procedure in Emulab). The purpose of this accumulated context is to allow for its automated processing (inline or post-processed), which involves filtering out secondary or “me too” errors that are observed and deemed irrelevant within a single local analysis domain.

4.2  A Recipe for Emulab

In our adaptation of these two requirements to the Emulab system, we were able to utilize months of tblog-collected failure messages.

Implementing Discrete Error Types:
Although there did not exist a one-to-one mapping of failure messages to error types, many of the collected failure messages did suggest an appropriate type designation.

In identifying Emulab's discrete error types, we were unable to obtain full coverage of all errors. In fact, it is impossible to obtain 100% coverage as Emulab developers routinely add new features, leading to new failure scenarios. Instead, we extracted frequently observed errors, based on tblog-collected data, to serve as an initial target set.

Implementing Error Context & Propagation:
In choosing error contexts for each error type, we included fields that would meaningfully distinguish instances of a single error from each other. For example, in the instance of a node boot failure, it is meaningful to include both the hostname of the node that failed and the OS image that failed to boot.

In our local analysis, we distinguish between primary and secondary errors. A primary error might indicate that a certain procedure within a script failed, while a secondary error might indicate that the script itself failed. Secondary or “me too” errors often do not include any additional context as they only occur in the presence of a more relevant primary error. Because the entire set of unique secondary errors is significantly smaller than that of unique primary errors, by observing a secondary error with no corresponding primary error, we can infer that an unidentified primary error must exist. We then identify the primary error using tblog analysis and include it as a new error type in the target set.

Fortunately, the tblog analysis engine already provides Emulab with an error discovery and reporting mechanism within a single swap-* session. However, aiming for a simple, generalized reporting architecture applicable to other distributed systems, we developed a new reporting engine based on the manual assignment of static, numeric severity levels. The severity-level assignment has a two-fold purpose, (i) to distinguish between primary and secondary errors, and (ii) to assign relative importance to primary errors of different types.

4.3  Deployment in Production Environment

After a few weeks of evaluating and fine-tuning our new reporting engine in the elabinelab emulation environment, we submitted our new code for deployment in the Emulab production system. A deployment decision was made to enhance the original tblog framework with our new reporting mechanism to result in a new local analysis engine called tbreport.

While tbreport currently utilizes the severity-level mechanism, it is possible for it to leverage tblog's call-chain relevance analysis as described in Section 3.1.

5  Initial Results

One of the immediate benefits of the new tbreport system is our ability to collect a variety of meaningful statistics for each error type that are not available from the tblog opaque failure messages. Our observations in this section are derived from examining a week's worth of error data collected since the tbreport system was added to the production Emulab testbed. Although this data set is over too short a period of time to accurately reflect Emulab's long-term performance, it is certainly illustrative of the types and frequency of errors that we have seen in prior months.

In the following statistics, a fatal error is one that is at least partially responsible for a swap-* session failure. If multiple errors of the same type occur within a swap-* session, only one instance of that error is counted in the unique-per-session category.

From August 16-24th, 2006, we observed that:


Occurrences Error Type
31 26.3% assign_violation/feasible
24 20.3% assign_type_precheck/feasible
22 18.6% node_boot_failed
10 8.5% ns_parse_failed
7 5.9% assign_fixed_node/feasible
6 5.1% node_load_failed
5 4.2% over_disk_quota
4 3.4% invalid_os
3 2.5% cancel_flag
2 1.7% assign_mapping_precheck/infeasible
2 1.7% assign_type_precheck/infeasible
1 0.8% invalid_variable
1 0.8% snmp_get_fatal


Table 2: Unique-per-session errors grouped by error type. A feasible error refers to experiment requests that could be realized given enough free resources, and an infeasible error refers to experiment requests that could never be realized with the current testbed resources.


In addition, two-thirds of all unique-per-session errors consist of only three error types (see Table 2).

5.1  Resource-Shortage Failures

The first two errors listed in Table 2 are caused by Emulab resource shortages, usually due to a lack of nodes. The second error, assign_type_precheck, results from a user's attempt to swap-in a session when there are insufficient free nodes available to uniquely allocate each experiment node. Since the number of currently free nodes by machine type is listed on the Emulab Web Interface, ideally, this error is avoidable. In practice, users often attempt to swap-in experiments without checking node availability. Additionally, in rare cases, race conditions can occur when two experiments attempt to allocate the same set of free nodes. Statistics derived from the context associated with these failures illustrate the user demand: nearly half (48%) of all assign_type_precheck errors were due to insufficient nodes of a single type (pc3000) when users, on average, requested 10.3 more nodes than were currently available. By collecting statistics on resource demands when resource shortages occur, Emulab's administrators can target future hardware purchases to address experiment needs and reduce the frequency of these failures.

The most frequently observed testbed errors are of type assign_violation. An assignment violation occurs when there are enough nodes available to satisfy an experiment swap-in request, but the node assignment routine is unable to generate a complete experiment mapping due to violations of physical mapping constraints (i.e., oversubscribed bandwidth). Typically, the user is unable to predict whether an assignment violation might occur. Moreover, because the assignment algorithm is non-deterministic, it is possible that subsequent swap-in attempts will succeed even if there is no change to the testbed topology. As a result, users are often frustrated by assign_violation errors and repeatedly attempt to swap-in, in hopes of success.

From the assign_violation error context, we observed that a single user was responsible for 74.2% of all assign_violation errors. In fact, this particular user was responsible for 29.6% of all failed swap-* sessions mostly due to these assign_violation errors. When these statistics were brought to the attention of testbed operators, they recognized that this individual operated experiments that were unusually taxing on the assign algorithm, and discussed the possibility of improving the algorithm for this case. Therefore, the tbreport-collected statistics proved to be useful in tuning the assign algorithm to reduce error frequency.

5.2  Node-Boot Failures

The third most frequently observed testbed error is of type node_boot_failed. Unlike assignment errors that are typically caused by resource shortages, node_boot_failed errors can occur due to many underlying causes. These errors occur during the reboot phase after a node is loaded with an experiment OS image. In normal operation, the node will boot the experiment OS and launch a status daemon that reports that the node has successfully rebooted. If for any reason the status daemon does not launch, the node will not report success, and eventually, the swap-in procedure will time-out declaring a node_boot_failed error.

Since experiment configurations may specify a user-contributed OS image, it is more difficult (as compared to resource-shortage failures) to diagnose the root cause of node_boot_failed errors from examining a single-node, single-session swap-* error trace. Often, testbed users or operators will need to analyze the output of a serial console log to determine the problem. Two options exist for handling node_boot_failed errors in the single-node, single-session case. First, testbed operators may assume that the failed node hardware is faulty and remove it from the pool of free nodes until the hardware is later confirmed to be in working order. Second, operators may assume that the OS image was built incorrectly and return the failed node back in the pool of free nodes. Neither solution is ideal or necessarily correct; removing a good node can result in more resource-shortage errors, while leaving in a faulty node can result in more node_boot_failed errors. Currently, testbed operators assume the former approach when the standard Emulab-provided OS images fail to boot, and assume the latter approach when a user-contributed OS image fails to boot.

Because of the number of factors involved, analysis of a single node_boot_failed error in a single-node, single-session trace is insufficient for root-cause analysis. However, by comparing and correlating multiple instances of the node_boot_failed error in multiple sessions (and across multiple nodes), global domain analysis might reliably fingerpoint the culprit.


Figure 2: Analysis of single-node, single-session vs. multiple-node, multiple-session node-boot failures.


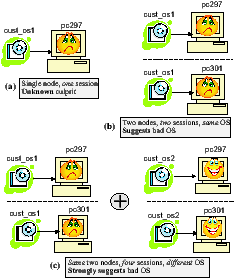
As an example, contrast a single node-boot failure within a single session to one across two or more sessions (see Figure 2). In the first case, if one node fails to boot one OS image, it is not discernible whether either or both are faulty. However, if two different nodes in two different sessions fail to boot the same OS image, we can suggest that the OS image, rather than the nodes, is likely to be faulty. In addition, if the nodes that failed to boot a specific OS image succeed in booting other OS images, then we can reliably infer that the specific OS image is faulty and that the nodes are not. Similar arguments can be used to fingerpoint a faulty node rather than the OS images.

This inter-session error-context correlation demonstrates our motivation for global analysis. With node_boot_failure errors being the third most common error type and representing nearly a fifth of all error cases, the statistics that we have gathered provide us with immediate direction for global analysis.

6  Looking Forward

Having deployed our new tbreport mechanism, our current work focuses on collecting error reports over a long-term period for a better analysis of error trends, and increasing error coverage as we discover instances of secondary errors with unknown primary errors. We also intend to exploit our tbreport-derived statistics to target problem cases for a global root-cause analysis daemon that would reliably fingerpoint error sources, at the system level, where manual analysis is currently required.

7  Related Work

Current root-cause analysis approaches mostly focus on using performance metrics to pinpoint faulty components on a request- or session-level basis.

Aguilera et al. [1] use message-level traces to ascribe performance problems to specific nodes on causal request paths. Magpie [2] captures the control-path and resource demands of application requests as they span components and nodes, and uses behavioral clustering to construct models that can be used for anomaly detection. Cohen et al. [4] use machine learning to identify system metrics that are most correlated with SLO violations, and extract indexable failure signatures for root-cause analysis. Kiciman et al. [5] determine the cause of partial failures by monitoring the flow of requests through the system and using historical behavior.

However, there may be hidden dependencies across nodes and sessions that are not directly related to the request call-graph. Recent efforts at Amazon.com [3] explore tools to help administrators monitor system health, understand system dependencies and suggest troubleshooting procedures for recurring problems. Closer to our work is Pip [6], a tool for discovering application bugs by analyzing actual system performance and comparing it to expected performance. Pip could be applied to Emulab at the global level by considering each swap-* session to be a task, and each swap-* error to be an annotated event. Expectations could be written for different global failure patterns and matched against them. However, our efforts were concurrent with Pip's development, and modifying the swap-* scripts to report errors was sufficient for our fingerpointing results.

8  Conclusion

This paper focuses on our current (tblog) and new local error-analysis (tbreport) strategies for Emulab. tbreport enhances Emulab code with structured error-reporting and context propagation, and has undergone preliminary evaluations in a production environment. We aim to continue to collect well-categorized failure statistics using tbreport and then leverage the resulting empirical evidence to implement global fingerpointing.

Acknowledgements

We thank our shepherd, Janet Wiener, for her comments that helped us to improve this paper. We thank Mike Hibler and Eric Eide for their feedback, and Kirk Webb, Russ Fish, and Leigh Stoller for their help with gathering and analyzing Emulab statistics.

References

[1]
Aguilera, M. K., Mogul, J. C., Wiener, J. L., Reynolds, P., and Muthitacharoen, A. Performance debugging for distributed systems of black boxes. In SOSP (Boston Landing, NY, Oct. 2003), pp. 74–89.

[2]
Barham, P., Donnelly, A., Isaacs, R., and Mortier, R. Using Magpie for request extraction and workload modelling. In OSDI (San Francisco, CA, Dec. 2004), pp. 259–272.

[3]
Bodik, P., Fox, A., Jordan, M. I., Patterson, D., Banerjee, A., Jagannathan, R., Su, T., Tenginakai, S., Turner, B., and Ingalls, J. Advanced tools for operators at Amazon.com. In HotAC Workshop (Dublin, Ireland, June 2006).

[4]
Cohen, I., Zhang, S., Goldszmidt, M., Symons, J., Kelly, T., and Fox, A. Capturing, indexing, clustering, and retrieving system history. In SOSP (Brighton, United Kingdom, Oct. 2005), pp. 105–118.

[5]
Kiciman, E., and Fox, A. Detecting application-level failures in component-based internet services. IEEE Trans. on Neural Networks 16, 5 (Sept. 2005), 1027–1041.

[6]
Reynolds, P., Killian, C., Wiener, J. L., Mogul, J. C., Shah, M. A., and Vahdat, A. Pip: Detecting the unexpected in distributed systems. In NSDI (San Jose, CA, May 2006), pp. 115–128.

[7]
White, B., Lepreau, J., Stoller, L., Ricci, R., Guruprasad, S., Newbold, M., Hibler, M., Barb, C., and Joglekar, A. An integrated experimental environment for distributed systems and networks. In OSDI (Boston, MA, Dec. 2002), pp. 255–270.

1
This material is based on research sponsored in part by the National Science Foundation, via CAREER grant CCR-0238381 and grant CNS-0326453.

This document was translated from LATEX by HEVEA.