
| ||||||||||||||||||||||||||||||||||||||||||||||||||||
WIESS 2000 Paper
[WIESS Tech Program Index]
HP Caliper—An
Architecture for Performance Analysis Tools
Robert Hundt Hewlett-Packard Company
robert_hundt@hp.com Abstract
HP Caliper is an architecture for software
developer tools that deal with executable (binary) programs. It
provides a common framework that allows building of a wide variety of
tools for doing performance analysis, profiling, coverage analysis,
correctness checking, and testing. HP Caliper uses a technology known
as dynamic instrumentation, which allows program instructions to be
changed on-the-fly with instrumentation probes. Dynamic
instrumentation makes HP Caliper easy to use: It requires no special
preparation of an application, supports shared libraries, collects
data for multiple threads, and has low intrusion and overhead. This
paper describes HP Caliper for HP-UX, running on the IA-64 (Itanium)
processor. It describes Caliper's architecture, dynamic
instrumentation algorithm, and the experiences gathered during its
implementation.
Introduction
The IA-64 processor's instruction
set architecture (ISA) offers an impressive set of architectural
features which explicitly create synergy between compilers and the
processor [10]. The IA-64 groups up to three instructions in bundles
for execution in parallel and can issue multiple bundles per clock.
The architecture provides 128 integer registers, 128 floating point
registers, 64 1-bit predicate registers, and 8 branch registers. Both
control and data speculation are supported, as well as predication to
eliminate branches, software pipelining of loops, and branch
prediction.
These processor features enable
powerful program optimizations. However, their efficiency depends on
the dynamic run-time behavior of a given program, which can only be
guessed by a static compiler. Additionally, modern software paradigms
emphasize distributed systems, component-based modularization and
object-oriented designs. This further prevents compilers from
optimization and analysis on a global scope.
Over the last years, the computing
community has developed a strong set of tools and methods used to
analyze and monitor run-time behavior of a program. Statistical
sampling and binary instrumentation are two of the major
techniques.
Statistical sampling is typically
performed by taking periodic snapshots of the program state, e.g.,
its instruction pointer (IP). Sampling is considered to be
light-weight, non-intrusive, and imprecise. It imposes low overhead
on a program's run-time performance and can be used for
time-critical experiments. However, measurements are statistical
samples and have errors. Without special hardware support, due to
super-scalar issues, deep pipelining, and out-of-order instruction
completion, a sampled IP may not be related to the instruction
address that caused a particular sampling event. Some architectures
introduce a varying offset to the IP at a particular sampling event
[2, 10].
The IA-64's performance
measurement unit (PMU) offers programmable CPU event counters, event
address registers (EAR), and a branch trace buffer (BTB). The PMU
supports a set of over 150 event types, allowing a wide range of
system analysis tasks [10], such as analysis of cache misses,
translation look-aside buffer (TLB) misses, or instruction cycles.
When such a hardware counter overflows, it is possible to precisely
link events to an instruction address with help of the event address
registers (EAR).
Dynamic binary instrumentation
allows program instructions to be changed on-the-fly and leads to a
whole class of more precise results. Measurements such as basic-block
coverage and function invocation counting are accurate. Since the
binary code of a program is modified, all interactions with the
processor and operating system may change significantly, for example
a program's cache and paging behavior. Instrumentation is therefore
considered to be intrusive. Due to additional instructions, execution
time can slow down anywhere from some percent to factors like 2x or
4x. Dynamic instrumentation, as opposed to static instrumentation, is
performed at run-time of a program and only instruments those parts
of an executable that are actually executed. This minimizes the
overhead imposed by the instrumentation process itself.
Tools based on dynamic
instrumentation require no special preparation of an executable, like
many other tools for performance analysis and tuning do. Such
treatment could be recompilation with a special compiler flag, or a
modified link process before or during program start. A good example
is profile-based optimization (PBO). There, a program must be
recompiled with a special flag to insert counting code in the program
and to output a trace profile at the end of the program run. Feeding
this profile back into the compiler allows combining of static
analysis and runtime information and to generate a highly optimized
application for a representative set of input data. This data
combination also requires another compiler flag to be used. PBO
generates efficient code, but is complicated to use, especially for
large-scale software systems. It has not been widely accepted by the
software industry.
HP Caliper (or Caliper for
short) integrates PMU supported sampling and fast dynamic
instrumentation. It offers a framework for performance analysis tools
for binary executables and requires no special preparation or
recompilation of these binaries. It supports shared libraries,
collects data for multiple threads and processes, and has low
intrusion and overhead. This paper describes HP Caliper for HP-UX,
running on the IA-64 (Itanium) processor. It describes HP Caliper's
architecture and public interfaces, presents the dynamic
instrumentation algorithm and details experiences gathered and
lessons learned during its implementation.
Related Work
This section describes related work
as characterized by Cmelik and Keppel [5]. They present a list of
over 45 hardware emulators, "decode-and-dispatch"
interpreters, "pre-decode" interpreters working on
intermediate representations, static cross compilers, and dynamic
cross compilers. These tools differ in support for kernel code, time
of instrumentation, requirements for debug information, and support
for signals and multithreaded programs.
Many tools try to generalize static
or dynamic instrumentation and create abstractions of machines, file
formats, compiler code layouts and optimization strategies. These
tools often come with additional generators for machine
abstractions.
Paradyn [9] is a performance
measurement tool for parallel and distributed programs. It includes
an abstract, machine independent, dynamic instrumentation API
(DynInst), and provides precise performance data down to the
procedure level.
The Parallel Tools Consortium
sponsors two related projects, the Performance API (PAPI) project and
the Dynamic Probe Class Library (DPCL), the latter being based on
Paradyn.
Spike [6] is a profile-directed
optimization system. It uses code-layout to improve cache behavior
and hot-cold optimization to minimize the number of instructions
executed on frequent paths through a program. Atom (Analysis Tools
with OM) is a tool based on Om [14]. Atom NT is a set of tools built
with the Spike library, including profilers, arc counters, and
simulators for cache and branch prediction units.
Some tools and libraries allow
static instrumentation of binary executables. EEL [11] is a
machine-independent library for editing executables and provides
abstractions which allow tools to analyze and modify binary
executables. Etch [13] is a tool which allows instrumentation of
Win32/Intel executables. Tools based on Etch include call graph
profilers and instruction execution analyzers. UQBT [4] is a
retargetable and "resourceable" binary translator.
Resourceable means that it accepts a binary from one of several
platforms as input, which is then transformed to an intermediate
representation and finally retargeted to several target
machines.
Rational's Purify, Quantify, and
PureCoverage [12] are systems which perform static instrumentation
for error detection, run-time performance analysis, and coverage
analysis. Intel's Vtune is a low-level CPU sampler which allows
detection of CPU bottlenecks and cache behavior.
HP's Aries [18] combines fast
code interpretation with dynamic translation in order to execute
PA-RISC applications transparently and accurately on IA-64 systems
running HP-UX.
Previous work at HP's dynamic
instrumentation lab includes a callback driven dynamic
instrumentation environment and dynamic optimizers for x86, PA-RISC,
and IA64. A transparent dynamic optimizer named Dynamo is under
development at the HP Laboratory in Cambridge.
HP Caliper
Architecture
HP Caliper is physically organized
as a shared object library with the Caliper API as its interface. A
tool built with HP Caliper runs as a Developer Tool Process,
controlling an Application Process via the operating
system's debug interface (e.g., ttrace on HP-UX or /proc on
Linux).
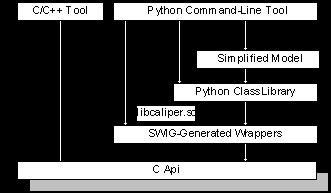
 Fig 1: HP Caliper
Architecture
Developer tools based on HP Caliper
are physically split into two parts, the user interface and the HP
Caliper shared object (libcaliper.so). User interfaces can be
stand-alone scripts or integrated development environments (IDE). HP
Caliper allows to inject an optional run-time library into the
application process to record information, react on application
events, and communicate with the developer tool.
The shared object is HP Caliper's
main component. It contains support code, collectors, the Caliper
API, and memory management routines. It integrates a Python
interpreter and provides a default C main function.
The HP Caliper API consists of a
set of C function interfaces to the main architectural blocks of HP
Caliper. The interfaces, although written in ANSI C, follow
object-oriented design principles and form a simple object model
consisting of Measurement sets, Events, Processes, Configuration,
Context and Collectors. These classes are described in the following
paragraphs.
Measurement sets enable
measurement specification and combination. Instrumentation-based
measurements include function coverage and counting, basic block
coverage and counting, arc counts, and call graphs. PMU- based global
performance metrics include control speculation miss ratio, data
speculation miss ratio, ALAT capacity miss ratio, data and
instruction cache miss ratios, TLB miss ratios, and more. Statistics
of branch mispredictions and branch taken ratios can be
obtained.
Event objects deal with
application and user events and handle event queues. Typical program
events include process creation and destruction, shared object
loading and unloading, timer expiration, PMU counter overflow, and
process termination.
Process is a set of
interfaces allowing creation of or attachment to a process as well as
handling of process related events, such as signals. It allows
controlling processes via the OS's debug interface (e.g., ttrace or
/proc).
Configuration permits to
parameterize HP Caliper and to set parameters such as initial size of
shared memory blocks.
Context allows HP Caliper to
scale to large applications by narrowing down measurements in both
time and space. A context's three dimensions are:
Address - to include or exclude modules (DLLs), functions and address ranges Time - to schedule measurements Event - to specify program actions for specific program events (e.g., fork / exec). A Collector is a tool built
into HP Caliper that performs a special kind of measurement, for
example, PMU sampling or instrumentation-based function counting.
Collectors use the infrastructure offered by HP Caliper. Each
collector adds an individual API to the HP Caliper API to interact
with the developer tool. On the application side, support code for
the instrumentation may be injected and each individual collector may
inject additional private code. Data and control transfers between HP
Caliper and an application use shared memory.
The Caliper Support Library
offers a framework of services and tools for dynamic instrumentation
and sampling. These services include:
encoding and decoding of machine instructions to an intermediate representation (IR) with automatic fix-up of IP-relative branches. handling of an executable's ELF file, code and data segments, debug and unwind information, and function tables. managing data exchange between HP Caliper and its monitored processes (e.g., for counters, events, or control instructions). controlling a process with the debug and performance measurement interfaces (perfmon()). A developer tool communicates with
HP Caliper via the Caliper API or via the integrated Python
interpreter. This Python interpreter performs multiple tasks. It
contains wrappers for all API functions and is used to interpret
initialization and configuration scripts. The interpreter acts as the
main interface for all command line tools and as the main shell for
the integrated debugger cdb (described later). It can also be
directly accessed from the graphical user interface and from the C
main function. Currently, Python can not be used to describe probe
code sequences at a high level.
The API resides in a set of C
header files, which are processed by SWIG [16] to generate Python
wrapper code. The interpreter and the wrappers are included in the HP
Caliper shared object. SWIG uses text templates to generate code and
some templates had to be changed to make SWIG usable on a 64-bit
processor with "new" data types like uint64_t.
The generated wrapper code is very
complex to use. Therefore, a Python class library was developed based
on the SWIG-generated interfaces. These classes are more intuitive
and serve as the main scripting interface to HP Caliper.
This programming model was also
felt to be too complex for simple and standardized tasks. This was
especially true for novice users, since knowledge of the Caliper API
and its object model was required. A further simplified model was
developed which only considers the most basic user control
requirements. In this model, only a few variables can be assigned
before a measurement starts, and all other details are hidden. For
example, these variables include the name of the application to be
monitored and the type of measurement to be performed.
Tools using HP Caliper can access
the C API, the Python SWIG-generated functions, the Python class
library, the simplified layer or operate HP Caliper from an IDE.
Other language interfaces, such as C++ or Java, can be added on top
of the C API.
A small and simple driver is
sufficient in order to perform useful work with the HP Caliper shared
object. All such a command-line driver does is analyzing its
parameters in order to find arguments specifying a script file and
finally running this script.
 An arc counter standalone tool is
written in roughly 20 lines of Python code. (The following code
snippet is simplified for clarity):
#!./caliper
import caliper, os,
sys
try:
# Create process and load
executable
test_exec =
os.path.abspath(sys.argv[1])
proc =
caliper.process()
proc.load(test_exec,
sys.argv[1:],
["PATH=."])
# Create context
context =
caliper.context(proc)
# Create collector:
arc_counter
arc_count =
caliper.arc_count(context)
# Run the
measurement
establish_measurement()
# Retrieve counters and
generate report
fout = open(test_exec +
".pbo", "w");
arc_count.report(fout)
fout.close()
except:
A control file in the simplified
model looks like:
# specify
applicatioin
application =
"a.out"
# specify output
file
pbo_out =
"flow.dat"
# run collector
collect(pbo)
Dynamic
Instrumentation
This section explains HP
Caliper's dynamic instrumentation algorithm. It briefly discusses,
why it can be characterized as a lazy algorithm before it finally
outlines the experiences gathered during its implementation and
testing.
One of the major benefits of
dynamic instrumentation, as opposed to static instrumentation, is
scalability. According to the 80:20 rule (in a typical program, 80
percent of the runtime is spent in 20 percent of the code), only a
small fraction of an executable system has to be instrumented in
order to detect the most significant parts of a program.
Dynamic instrumentation can be
performed in a variety of ways. The two strategies we considered for
generating probe code were to either make use of trampolines
(out-of-line), or inline and relocate probe code
(in-line).
As an example, an out-of-line
instrumentation strategy may perform code transformations like the
following in order to perform function counting. A given function
foo's entry point may look like this in IA-64 assembly:
foo::
alloc r33=ar.pfs,0,11,1,0
addl r9=-2944,r1
addl r8=-2936,r1
foo'::
. . .
The out-of-line strategy will
instrument foo's entry point with a long branch to a trampoline
that executes the original instruction, plus some additional code to
update an invocation counter.
foo::
nop.m
brl trampoline
foo'::
. . .
trampoline::
// save state, create free register
rx
. . .
// execute original
instructions
alloc r33=ar.pfs,0,11,1,0
addl r9=-2944,r1
addl r8=-2936,r1
// perform additional tasks
// update a counter for this
function
movl rx, addr-of-counter
fetchadd [rx], 1
// restore state
. . .
// return to original code.
brl foo'
There are, of course, many
possibilities for encoding, reaching, and returning from the actual
trampoline code. Care must be taken for code with branch instructions
in the first bundle of a function. Trampoline code and original code
may be farther apart than the 25-bit encoded relative address offsets
of the IA-64 allow. Therefore, long branches have to be
used.
This strategy has several
advantages. If all of the probe code is placed out-of-line and the
instrumented instructions branch to it and back, then the counting
code will not cause any wrinkles in the address space of the original
application. Thus, all branches would continue to reach their
designated targets. It is also easy to combine multiple
instrumentations simply by cascading trampolines.
The other major strategy for probe
code generation is to inline and relocate code. The above code
snippet for function foo would then be transformed into the
following:
foo_instrumented::
// modified alloc instruction
to
// generate free register
alloc r33=ar.pfs,0,12,1,0
// perform additional
tasks,
// update a counter for this
function
movl r45, addr-of-counter
fetchadd [r45], 1
addl r9=-2944,r1
addl r8=-2936,r1
This strategy leads to more compact
code, less intrusion, and better performance. It does, however, come
at a price.
Insertion of probe code changes the
relative offsets in a code stream and requires lookup of indirect
branches (in a translation table) whose target cannot be determined
by the instrumenter. Combining different instrumentations and probe
code is not as easy as it is in the well-defined, sand-box style
trampoline approach.
Susan L. Graham, et. al. [8]
investigated the relative overhead associated with the inline and
out-of-line instrumentation strategies and found the overhead to be
34% for inline and 112% for out-of-line strategies. The
transformation overhead is computed as the run-time of all code that
is added to the application in order to support the primary probe
code, without including the probe code itself. The benchmark included
spec programs such as compress, gcc, li, sc, espresso, and
more.
The use of long branches had to be
minimized for another reason. The first versions of the IA-64 only
emulate the long branch, which causes additional run-time performance
impacts. A trampoline-based instrumentation approach with out-of-line
branches made heavy use of long branches and was therefore
disregarded in favor of the current in-line approach. Preliminary
measurements on HP-UX showed that the overhead of a long call branch,
compared to a short call branch, is approximately 100 to 300 cycles.
This number was considered to be small for an emulated instruction
and permitted us to use the long branch instruction
"occasionally" in the algorithm.
The inlining relocation method is
faster even without considering the extra cost of an emulated long
branch instruction. This justified our algorithmic decision in the
light of an upcoming, hardware-supported long branch
instruction.
Algorithm
HP Caliper's approach works at
the granularity level of functions, which are always instrumented as
a whole. Probes are inlined into functions and instrumented functions
are relocated.
The dynamic instrumentation
algorithm performs the following five steps, which are encapsulated
in the Caliper API:
1. Attach and Inject: HP
Caliper identifies an executable or an already running process. It
attaches to a process using the HP-UX ttrace system call. The process
stops and transfers control to HP Caliper, which injects code into
the process which allocates shared memory and optionally adds
run-time libraries for dynamic instrumentation.
2. Function Discovery:
Function entry points are identified by analysis of the unwind
information tables (sometimes called exception tables), the procedure
lookup tables, and the symbol table. Unlike a debugger, HP Caliper
does not depend on debug information in order to perform this step.
The analysis may still miss some function entry points because of a
lack of unwind information and symbolic information. However, these
functions are discovered dynamically. Whenever a call target cannot
be found in the internal function dictionary during instrumentation,
a break is inserted at the target address of a call branch, assuming
it to be a function entry point.
3. Static Break Insertion:
Every function's entry point is patched with a break
instruction.
4. Run under Dynamic
Instrumentation: Control is transferred back to the process. The
process runs until it hits one of the inserted break instructions at
the entry point of a function. Since the process is controlled by
ttrace, control transfers to HP Caliper and the instrumentation
process begins at the current function.
The function is analyzed for
instrumentability, probe codes are inlined into the function,
IP-relative references are updated, counters are created, and an
instrumented version of the function is moved to shared memory. The
original function's entry point is patched with a long branch
instruction to its instrumented version. Break instructions are
inserted at function external IP-relative branches, whose targets
have not yet been instrumented or have not been identified by
function discovery.
After instrumentation, control
transfers to the instrumented function, which continues to run until
it hits the next break instruction. Control will again transfer to HP
Caliper and the dynamic instrumentation process is
resumed.
5. Output: Upon process
termination or user request, control again transfers to HP Caliper.
Statistics, counters, and other measurement results are now retrieved
and output into one of the integrated, collector-specific formats or
via user-defined, script-based output routines.
This dynamic instrumentation
algorithm could rightfully be characterized as a lazy instrumentation
algorithm. If a program were to consist of only one, presumably huge,
function F, the algorithm would instrument the whole program
at once after reaching F's entry point. No code
transformations that depend on information only available at run-time
are performed.
Programs consisting of only one
function, however, are not a standard case in today's computing
environments, right the opposite is true! The instrumentation
sequence also depends on the dynamic control flow of a program and
can be changed interactively or via the definition of context. We,
therefore, continue to use the term "dynamic
instrumentation" to describe this algorithm.
Without further explanation we
would like to mention another property of this algorithm, the
possibility to mix instrumented and non-instrumented code without
hurting program correctness.
Experiences
This section describes the most
important experiences gathered and lessons learned during
implementation and debugging of this algorithm for HP-UX.
The IA-64 contains a high
performance register stack engine (RSE) which helps to minimize the
cost of creating a call frame and a function call by maintaining a
separate register stack. If a programming model requires consistent
unwinding of the stack, e.g. during a C++ exception, both program
stack and register stack have to be unwound.
For every region in a program,
unwind information is generated and stored in the text segment for
fast access. The presence of unwind information is a requirement by
the IA-64 runtime software architecture [10]. If code motion happens
during instrumentation, the unwind information must be dynamically
updated. This is no easy task, since regions get modified by probe
code inlining. Unwind information updating is not yet fully resolved
and blocks HP Caliper from being used for analysis of C++ programs
which make use of C++ exceptions.
Compilers frequently translate a
C/C++ switch statement into an indirect branch based on a branch
table located in the code segment. HP's compilers place branch
tables in a read-only data section of the text segment. It is
generally impossible for a binary code analyzer to decide whether a
given address contains data (such as an entry of a branch table) or
real code. Some algorithms exist to identify branch tables and, for
some code generation schemes, this problem can always be solved
[3,17].
HP Caliper uses compiler-generated
annotations residing in an executable's ELF file to identify these
tables. If a branch table has been identified, the table entries are
patched so they point to their corresponding instrumented target
addresses. Whenever an indirect branch is executed based on an
unmodified branch table, it will go to a function's
non-instrumented version. Although the program maintains correctness,
the resulting counter values become imprecise.
Because of this, HP Caliper's
precision depends on the presence of annotations. Annotations are
linked to the unwind information for a given region and as long as
the executable contains unwind information, the corresponding
annotations can be found.
The foremost requirement for binary
instrumentation is, of course, to preserve the program semantics at
any given time. Probe code needs free registers and earlier
approaches required the compiler to reserve registers for special use
of a post link-time tools. This is again a topic of a recent
discussions in the industry and certainly is a most convenient
approach. However, the compiler group soon experienced register
pressure and, consequently, this approach was skipped.
HP Caliper now uses a staged method
to find free registers. Free registers are first identified with the
assistance of compiler generated annotations. If no annotations are
found, free registers are created by increasing the number of stacked
output registers of a function by modifying a function's dominating
alloc instruction. This will fail if the function doesn't have an
alloc instruction, has multiple alloc instructions or because the
alloc instruction already allocates all the stacked registers. In
such a case, explicitly spilling/filling to the program stack is
necessary.
Multithreaded applications
presented a new kind of challenge for HP Caliper. Insertion of an
instruction (e.g., a long branch instruction), turned out to be more
complicated than expected. The IA-64 bundle size is 16 bytes, but
load and store instructions only operate on a maximum of 8 bytes.
This means that two store instructions are necessary to update a
bundle. In multithreaded applications, there are two potentially
hazardous scenarios. It is possible that a thread could hit a bundle
while being in the middle of it's update process, thus executing a
half-deployed instruction with an invalid instruction template field,
which will result in a signal. Or, a thread could have been stalled
on slot 1 or slot 2 of a bundle, waking up on a changed instruction,
again resulting in incorrect program behavior.
The latter scenario has been solved
in HP Caliper using a sequence of update steps. The first problem
requires the installation of a signal handler for invalid template
exceptions. This has not been implemented yet.
To date, HP Caliper simply halts
all threads in the target application while performing an instruction
update. While guaranteeing correct program behavior, this method
slows down execution speed, especially on multi-processor systems.
For this reason it will later be changed to a method with full
support for multithreading.
The IA-64 supports call shadows
where two branches are located in one bundle as in this
example:
nop.m 0
(p6) br.call.dptk.few
.-0x150
br.call.sptk.few .-0x410;; //
shadowed
If the predicate register p6 is set
to 1 then the first branch instruction is executed. Since branch
targets and return address are always full bundle addresses on the
IA-64, the second branch will never be executed.
If this instruction sequence is
instrumented and counting code is inserted, then the original
instructions get dispersed across multiple bundles, changing the
implicit logic of the call shadow that supressed the second branch.
Thus, HP Caliper performs an additional search for call shadows and
alters the instrumentation sequences accordingly.
Break instructions are used in a
similar, but conflicting way by both HP Caliper and debuggers, making
it impossible to debug a HP Caliper-controlled application. Therefore
we integrated debugging functionality into HP Caliper and named the
driver for this functionality cdb (Caliper Debugger). This feature
became invaluable for identifying program flaws, invalid probe code
sequences, kernel bugs and forgotten stop bits all over the
instrumented code.
Cdb makes use of the integrated
Python interpreter to display a prompt, to parse commands, and to
perform actions accordingly. It supports insertion of break points,
single stepping, disassembly of original and instrumented code,
dumping of data and registers, and more. HP Caliper allows falling
back to a cdb prompt whenever an unexpected situation or signal
occurs.
Scripting languages such as Python
typically have powerful support for socket communications of some
kind. It was easy for us to offer a remote interface to cdb. This
proved to be valuable during debugging of applications which expect
input from stdin via redirection. The implementation of this remote
functionality is concise and simple.
HP Caliper also has some
limitations. Instrumentation does not work with dynamically generated
code, with programs that internally change between little-endian and
big-endian or with programs that use IP-aware signal handlers. It is
also possible to create assembler code sequences where
instrumentation will fail, for example code performing label
arithmetic. However, such sequences are rarely used, if at
all.
At the time of this writing, HP
Caliper is able to successfully instrument the first ten Spec2000
benchmark programs (164.gzip, 175.vpr, 181.mcf, 197.parser,
168.wupwise and more) to perform function coverage analysis, function
counting and arc counting on IP-relative call branches as well as
hazard checking for predicates
Case Study: Predicate Hazard
Checking
Predicate hazard checking is an
interesting application of the HP Caliper framework and is presented
here as a case study.
The HP compiler optimization group
developed an algorithm where instructions are placed in the same
issue group, although they may have a resource conflict, as in the
following bundle with a read-after-write conflict:
nop.m
(p35) addl r14=0x40784634,r0 // write
r14
(p36) ld4.s r15=[r14] // read
r14
The instructions, however, are
predicated. If it can be guaranteed that the predicates are never 1
at the same time, then this is a powerful optimization
technique.
In order to verify the algorithm,
the optimization group uses a static tool to read in ELF executables
and to output potential hazards as tuples <hazard address,
predicate register, predicate register>. Hundreds and thousands of
potential hazards are indicated by the static tool. This information
is then manually checked against disassembled code and run through
other static analyzers.
Still, there had to be some form of
dynamic verification. If one single occurring hazard was found, it
was proven that the algorithm had a flaw for a given input
stream.
In order to support our compiler
optimization team, we wrote a collector which reads in the output of
the static hazard analyzer and instruments functions containing
potential hazards. The probe code sequences check whether or not two
indicated predicate registers are both set to one at a questionable
address and increase a counter for this hazardous case. If a single
counter has a value of one or greater, an actual hazard has been
found.
Implementing this collector was a
straightforward operation, because all major building blocks like
counter management, function discovery, probe code generation,
insertion and handling of break instruction were already in place.
The tasks to perform for hazard checking were more or less to define
an input format and reader for the hazard file and the layout and
implementation of the probe code sequences. We have been able to
identify hazards and helped the optimizer group to improve their
algorithms.
Future Work
HP Caliper will be ported to Linux
on IA64 processors and to HP-UX on PA-RISC.
What are the IA-64 specific
features used by HP Caliper that will complicate porting it to
PA-RISC? The ISA of both processors is fairly similar and the success
of HP's Aries emulator running PA-RISC applications on IA-64
demonstrates this. There are however two main problem
areas:
There is no PMU or equivalent hardware on PA-RISC. It is therefore expected that HP Caliper for PA-RISC will focus on binary code instrumentation. HP Caliper exploits two instructions unique to the IA-64, the long branch instruction brl and the memory access synchronizing fetchadd instruction for counter updates. For both instructions there is no equivalent on PA-RISC, and workarounds for their usage must be developed. No problems caused by operating
system dependencies are expected. Although the debug and perfmon
interfaces of HP-UX and Linux differ, their capabilities are both
similar and powerful enough to allow HP Caliper to be
ported
In order to fully support analysis
of C++ programs making use of exceptions, the dynamic updating of
unwind information will be developed soon.
An optional Caliper Agent
above the Caliper API is under development. This agent routes API
calls between the developer tool and the HP Caliper shared object,
enabling a HP Caliper for distributed systems. The agent uses remote
procedure calls (RPC) based on code generated from Caliper's API
header files.
More tools will be developed on top
of the instrumentation framework. In particular, these will include
basic block related tools and API checkers such as a memory leak
detection tool and a pthread correctness checker. Caliper's design
will also change slightly to enable dynamic loading of
collectors.
One of the more interesting
challenges for the future is dynamic code transformation, e.g.,
optimization. Light- weight sampling will identify hot traces and
dynamic instrumentation will optimize a program using this
information. The optimizations may further adapt themselves as the
characteristics of input data sets change.
Acknowledgements
HP Caliper is the result of a
strong team effort within HP. Thanks to Dave Babcock, Eric Gouriou
and German Rivera for their contributions. Special thanks to Umesh
Krishnaswamy, Vinodha Ramasamy and Thomas Lofgren for their
additional feedback and help during my writing of this
paper.
I would also like to thank the
anonymous reviewers for their invaluable feedback.
References
[1]
[2]
[3]
[4]
[5]
[6]
[7]
[8]
[9]
[10]
[11]
[12]
[13] Ted Romer et al.
"Instrumentation and Optimization of Win32/Intel Executables
using Etch", Usenix Windows NT Workshop 1997
[14]
[15]
[16] SWIG--Simplified Wrapper
and Interface Generator, Dave Beazley et al., University of Utah,
Open Source Project at https://www.swig.org
[17] M. Weiser "Program
Slicing". IEEE Transactions on Software Engineering,
SE-10(4):352-257, July 1984
[18]
|
|
This paper was originally published by the USENIX Association in the
Proceedings of the First WIESS Workshop,
October 22, 2000, San Diego, California, USA
Last changed: 23 Jan. 2002 ml |
|
