| ||||||||||||||||||||||||||||||||||||||||||||||||||||
|
WIESS '02 Paper
[WIESS '02 Tech Program Index]
Enhancements for Hyper-Threading Technology in the Operating System Seeking the Optimal Jun Nakajima Software and Solutions Group, Intel
Corporation Venkatesh Pallipadi Software and Solutions Group, Intel
Corporation Abstract Hyper-Threading
Technology (HT) is Intel®s implementation of Simultaneous Multi-Threading
(SMT). 1. Introduction1.1. Overview of HTHyper-Threading Technology (HT) is Intel®s implementation
of Simultaneous Multi-Threading (SMT) ([9],[10]).
One logical processor can utilize excess resource bandwidth that is not consumed by the other logical processor, allowing the other task to make progress. This way, both the overall utilization of execution resources as well as the overall performance of software applications in the multi-tasking/multi-threading environment increases. Logical processors share nearly all other resources on the physical processor, such as caches, execution units, branch predictors, control logic, and buses. HT is not expected to make a given single-threaded application to execute faster when executing alone, but when two or more unrelated applications are executing under HT, the overall system throughput can improve due to HT. See [5] for details. 1.2. General HT enhancements in the Operating SystemThis section describes the typical enhancements, to explain the implications of HT to the OS. Following is a summary of enhancements recommended in the OS. Detection of HT The OS needs to detect both the logical and processor packages if HT is available for that processor(s). hlt at idle loop The IA-32 Intel® Architecture has an instruction call hlt (halt) that stops processor execution and normally allows the processor to go into a lower-power mode. On a processor with HT, executing hlt transitions from a multi-task mode to a single-task mode, giving the other logical processor full use of all processor execution resources; see [5] for the details. pause
instruction at spin-waits The OS typically uses synchronization primitives,
such as spin locks in multiprocessor systems. The pause is
equivalent to rep;nop for all known Intel® architecture prior
to Pentium® 4 or Intel® Xeon processors. The instruction in
spin-waits can avoid severe penalty generated when a processor is spinning on a
synchronization variable at full speed. ·
Special handling for shared physical resources MTRRs
(Memory Type Range Registers) and the microcode are shared by the logical processors
on a processor package. The OS needs to ensure the update to those registers is
synchronized between the logical processors and it happens just once per processor
package, as opposed to once per logical processor, if required by the spec. Preventing excessive eviction in
first-level data cache Cached data in the first-level data cache are
tagged and indexed by virtual addresses. This means two processes running on a
different logical processors on a processor package can cause repeated evictions
and allocations of cache lines when they are accessing the same virtual address
or near in a competing fashion (e.g. user stack).
The original Linux kernel, for example, sets the same value to the initial user stack pointer in
every user process. In our enhancement, we offset the stack
pointer simply by a
multiple of 128 bytes using the mod 64, i.e. ((pid%64) << 7) of the unique process ID to resolve this
issue. Scalability issues The current Linux, for example, is scalable in most cases, at least up to 8 CPUs. However, enabling HT means doubling the number of processors in the system, thus it can expose scalability issues, or it does not show performance enhancements when HT is enabled. Linux (2.4.17 or higher) supports HT, and it has all the above
changes in it. We developed and identified the essential code (about just 1000 lines
code) for those changes (except
scalability issues) based on performance measurements, and then improved the code with
Linux community. Appendix locates the relevant lines for the changes in Linux 2.4.19 (the latest tree as of writing). Those changes or requirements should be applicable to an OS in general when supporting HT, although some of them might need to be re-implemented for the target OS. 1.3. Basic scheduler optimizations for HTThis section describes the basic scheduler related enhancements for HT. Processor-c Since the L2 cache is shared in a processor package, however, the hit (or miss) ratio can depend on how the other logical processor uses the L2 cache as well. If the current process on a processor consumes the L2 cache substantially, it can affect the processes running on the other logical processors. Therefore, to avoid performance degradation caused by cache thrashing between the two logical processors, we need to monitor and minimize such L2 cache misses in a processor package. Note that excessive L2 cache misses also can affect the entire
system, causing significant traffic on the system (front-side) bus. Page coloring (for example, see [4]) could reduce occurrence of severe impacts on two different processes or threads caused by competitive eviction of L2 cache lines in a processor package. If two different processes access their own data very frequently, and the pages associated with the data happen to have the same color, the possibility of competitive eviction of L2 cache lines can be higher, compared to the case where page coloring is implemented. The same discussion is applicable to the threads in a multi-threaded application. Although there are some patches are available for page coloring in Linux, we havent measured the benefits of page coloring for HT. HT-Aware idle handling This enhancement in the scheduler significantly improves performance when the load is relatively low. For the scheduling purposes, the OS needs to find idle CPUs, if any. On HT systems, however, the processor package is not necessarily idle even if one of the logical processor is idle; the other may be very active. Therefore, the scheduler needs to prioritize real-idle (both logical processors are idle) over half-idle (one of them is idle), when dispatching a process to a logical processor to obtain higher performance. This attribute also helps to avoid the situation where two processes run on a processor package but the other package is completely idle in a 2-way SMP system. However, this kind of situation cannot always be prevented because the OS cannot predict when a particular process terminates. Once this situation occurs, the scheduler usually does not resolve it. Scalability of the scheduler
The Linux original uses a single global run queue with a global
spin lock. This scheduler works well for most cases, but there are some
scalability issues especially handling a large number of processes/threads. The
O(1) scheduler from Ingo Molnar is proposed to resolve such issues, and it uses
per-CPU run queue and a spin lock for each, and
locking is not required as long as the CPU manipulates its own run queue. 2. Related worksWe discuss how the existing techniques can contribute to performance enhancements of HT systems. In this paper, we assume that processes are scheduled in a time-sharing fashion. 2.1. Performance Monitoring CounterThe work [1] is interesting in that it combined the hardware monitoring counters and program-centric code annotations to guide thread scheduling on SMP, to improve thread locality. Some findings show that some workloads achieved speedup almost entirely through user annotations, and for some long-lived ones speedup is gained by preserving locality with each thread. We need to run a process for some time, to get the information of its workload. Such users annotation (including processor binding) would be helpful. We use hardware performance monitoring counters (simply performance monitoring counter, hereafter) to get such micro-architectural information. See [1] for general and detailed description and benefits of performance monitoring counters that are available on various architectures. The major benefit of using performance monitoring counters is to allow software to obtain detailed and specific information at runtime without impacting the performance. Usually, performance monitoring counters are used to tune applications and the OS. There are some tuning tools that use them for the Intel® architectures, such as VTune [3], for example.
We dont see conflicts with such tools and the scheduler,
although the number of performance monitoring counters available will be reduced.
2.2. Symbiotic
Jobscheduling
We share the issues to resolve with the symbiotic jobscheduler
([6], [7]): ·
Jobs in an SMT processor can conflict with each other on various
shared system resources. ·
The scheduling has to be aware of the SMT requirements to find the optimized
utilization of execution resources. However, the target system and the methodology is quite different: ·
We dont attempt to make a running set of jobs that
will be coscheduled, by discovering efficient schedules in a processor on the fly. Instead, we attempt to detect
interference or
conflicts with the execution resources in SMP systems consisting of multiple SMT, i.e. HT processors, and to balance the load among such processors. Therefore,
uni-processor
(UP)
systems are not our target. We believe the programmer/developer can tune their
application better in the UP case using proper performance tuning tools. · We dont require modifications to the OS scheduler in the kernel that needs to support SMP systems as well. Inventing a new scheduler only for SMT can generate maintenance and QA issues in a commercial OS. Instead, we provided a user-mode daemon that monitors hardware events in the processors, to detect such conflicts with the execution resources. 2.3. Load balancingIn the multiprocessor environment, a typical load metric employed by the OS scheduler at load balancing time is the length of the run queue(s). This is generic and effective when keeping fairness of the processes that are run in a time-sharing fashion, because the processes on a processor with a shorter run queue can have more chances to run. At the same time the length of the run queue does not reflect the load of the processor or processor package, because the workload or the execution resources utilized at runtime can vary from process to process. 3. Advanced HT Optimizations in the SchedulerIn this section we discuss advanced HT optimizations in the scheduler. As such, we are evaluating their effectiveness gathering data from various workloads. 3.1. MotivationWhen HT is enabled, the number of the processors looks doubled to the OS, because each of them (logical processor) has architectural state as a processor, and BIOS reports as such. In general a multi-threaded application that scales well and is optimized on SMP systems should be able to benefit on systems with HT. In the multiprocessor environment, however, there can be process placement issues, because the two logical processors in a processor package share the execution resources. Note - For the following illustrations we have
used 164.gzip of SPEC-CPU2000 (referred as INT) as the integer
operation intensive benchmark, 177.mesa of SPEC-CPU2000 (referred as FP)
as the floating-point intensive benchmark and 197.parser of SPEC-CPU2000
(referred as L2C) as the L2 cache intensive benchmark. See [12]
for details. The
floating-point execution unit, for example, is one of the limited execution
resources in a processor package. If we run two processes of an
integer-intensive program (INT) and two of floating-point intensive program
(FP) on a 2-way (4way HT) machine, binding them to the processor package, we
see significant performance difference depending process placement (see Another example of a critical execution resource is L2 cache unit. If we
run two processes of an integer-intensive program (INT) and two of a program
(L2C) that consumes L2 cache lines intensively, we also see visible performance difference
depending on
process
placement
(see Table 2). To explain the benefits of HT, we also run the test case with HT
disabled as well. The ( and ) indicate a processor package with HT enabled, and [ and ] a
physical processor with HT disabled.
(INT, INT) · Two INT programs are bound to a processor package, and two FP programs are bound to the other processor package. HT is enabled, and the system looks a 4-way SMP. [INT, INT] [FP, FP] means, ·
Two INT programs are bound to a processor, and two FP programs
are bound to the other processor. HT is disabled, and the system looks a
dual-processor system. The two programs are not run at the same time in a processor, but in a TSS
fashion.
Table 1
Table 2: Average time (sec.) to complete (INT, L2C) Total Time means the sum of the average time (in second) to complete each program (4 of them). As we in both Table 1 and Table 2, · Performance is always better when HT is enabled (about 17% in Table 1 and 13% in Table 2). This is because HT is utilizing the execution resources more by running the two logical processors in a processor packages. ·
For HT, combining different workloads is better
(about 12% in Table 1 and 6% in Table 2). This is because such different workloads
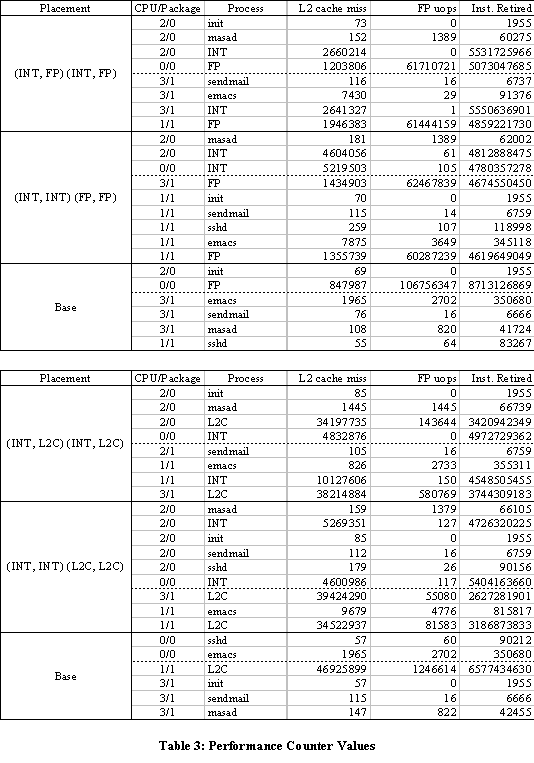
tend to have less interference with the execution resources. Table 3 shows values in the hardware performance
monitoring counters for the cases in Table 1 and Table 2. The samples were
taken in a 5-second period when the test cases were run. Table 4 lists
the placements in the Table 1, Table 2, and Base (HT enabled) as well, where a single
instance of FP or L2C runs at full-speed with the other processor package
idle. For each, it includes the number of L2 cache misses, floating-point uops
(decoded IA-32 floating-point instructions) retired (actually executed), and
instructions retired. CPU/Package means the logical CPU ID and the processor package that it belongs to. Note that the process
masad is our user-mode micro-architectural scheduling assist daemon, and we
used it to control placement of the INT and FP or L2C processes. Also note
that the execution resources used by the process is negligible. Table 4 summarizes Table 3 per processor
package, providing the number of the L2 cache misses, FP uops retired, and the
ratios for those events per instruction retired (processor package 0 or 1 in
Base was omitted because only a single instance of the program was
run.).
Notice the following things for the FP test case: ·
The total instructions retired are more in (INT,
FP) (INT, FP) than the others. This implies this setup achieves higher
overall throughput than the other cases. ·
The number of FP uops in (INT, INT) (FP, FP) is
outstanding in the processor package 1. And it is more than the one in Base. The above observation suggests that FP execution
resources are causing over-subscription or interference between the FP
processes. The above discussion applies to the L2C test as
well. See Table 3 and Table 4: ·
One of the processor packages has a higher number of the
total instructions retired, but the other one has significantly lower (5.815E+09) with (INT, INT) (L2C, L2C). ·
The number of L2 cache misses is outstanding in the
processor package 1 with (INT, INT) (L2C, L2C). The above observation again suggests that L2C execution
resources are causing over-subscription or interference between the L2C processes. The problem above happens with practical
multi-threaded applications, and in fact it is a generic SMP issue as well.
Inktomi Traffic Server, for example, can be tuned by setting CPU
affinity. Performance
is measured on a 2-way SMP (4-way with HT) machine by request rate
(req/sec) within 1600 ms response time. Since the threads in the
application can
run any processor, they occasionally run on the same processor package, and
showing worse (unacceptable) response time (1638.08 ms). In many cases, a
typical technique is to bind the processes or threads of interest to CPUs. In
case of HT, we need to bind such processes or threads to a processor package or
a set of logical processors. If we set CPU affinity, binding the thread to each
processor package, we see better performance with shorter response time
(1436.12 ms).
It is true that the same problem occurs with in the SMP environment as well, but resolving the issue is more difficult in the HT environment. In the HT environment, each of the net threads is actually running on a logical processor in a processor package. And we need to migrate the currently running one to another logical processor in the other processor package (i.e. process migration), rather than one in the run queue as in the SMP case. In the SMP environment, even if the two instances of the net thread are in the same CPU, at most one is running and the other one must be on the run queue. In other words, a scheduler with a proper load balance mechanism should be able to handle this case relatively easily in the SMP environment. We have used limited number of
processes for the illustrations here. However, this kind of problem can occur
in heavily loaded system too, if the currently running processes on two logical
processors of a package use similar kind of execution resources. To understand and resolve those issues, we need to look at the micro-architecture level, because the amount of execution resources and dependencies are micro-architecture specific. In other words, the severity of the problem above can vary from micro-architecture to micro-architecture, even though the architecture implemented is equivalent. In addition, its barely possible to tell which and how execution resources are used to execute a given instruction, as long as we are looking at the instruction/architecture level. 3.2.
Manual B
|
 |
· The user sometimes has difficulty identifying the optimal placement as long as he or she looks at the instruction level, rather than the micro-architecture level.
· The scope of a particular application is static and local, and the assumption can be wrong when the other system activities, such as interrupts or swap handling, are active at runtime.
· The micro-architecture can change, and the optimal process/processor binding can also change because of that. If the user needs to run the same system on processors with a newer or different micro-architecture, the system may need different process/processor binding. The load calibration technique discussed in Section 4.1 attempts to solve this problem.
These issues are common between SMT and MP systems (including MP systems
of SMT processors), the impacts caused by a wrong setup or tuning could be more exposed in SMT, mainly because the hardware threads
(i.e. logical processors in the OS) are not necessarily physically independent. If the system in Section 3.1 were a usual 4-way
SMP machine, the total would be same for any process placement in the both Table 1 and Table 2.
The problems above can happen especially when a process/thread is bound to a CPU(s) statically. If we can adjust such affinity at runtime, i.e. reset affinity accordingly, we can avoid such problems. This motivated us to employ the micro-architectural information or hardware performance monitoring counters at runtime when adjusting or tuning placement of the processes on the processors/processor packages. Since we know static binding can provide fairly reasonable performance, we dont believe we need to change affinity very frequently. Rather, we attempt to detect wrong placement that causes performance degradation, and to resolve such a situation.
The other benefit of this approach is that we can provide such a load balancing policy as a user-level program if:
· Getting/setting of CPU binding is available for either a process or software thread, depending on the unit scheduled by the OS, and
· Per-process or per-thread hardware event counts from hardware performance monitoring counters are available. A device driver can provide this information. Some OS maintains the threads in a process in the kernel whereas a thread in Linux, for example, is implemented as a process and the kernel has no idea about the mapping between threads and processes.
The benefits of having user-level policy are significant:
· Extending the load-balancing algorithm in the OS does not solve the case where two very active processes are stuck in a processor package, because it does not migrate the currently running processes.
·
The users can tune the system more effectively for
various workloads if we clarify how it works as a distinct entity, rather than
providing a blalock
box in the scheduler.
· The scheduler in the OS can be architecture independent especially when it needs to support multiple architectures. Thus it is not good idea to change it for a particular architecture for various reasons (performance impacts, verification, maintenance, etc.)
· The kernel usually does not use floating-point operations except for very limited case. Such a program would need to process a number of large values (from performance monitoring counters). It would be efficiently written with floating-point operations available.
The next section explains our proposal to do this optimization
using a user-mode
level monitoring daemon.
As we discussed our requirements for the OS in 3.3, the Micro-Architectural Scheduling Assist (MASA) should be available if the OS provides the generic requirements. In the following section, we discuss the methodology.
Since the micro-architecture implements the architecture of the processor, it can vary even for a same processor family in details, such as the numbers of execution units, or size of L1/L2 caches. Since our purpose to monitor utilization of limited and shared execution resources for HT, we define load metrics to evaluate utilization of those resources, based chiefly on the Intel® XeonTM processor family.
A load metric is an abstracted performance monitoring counter in a sense, and it is defined as a formula using a set of performance-monitoring event counters, focusing on events on a particular micro-architectural resource(s). Since the events monitored by the performance monitoring counters are typically very detailed and specific, it is comprehensive and efficient if we combine them as a functional unit. In addition, we can reduce the differences among the performance monitoring counters that can be micro-architecture specific, but can vary from architecture to architecture. A performance monitoring counter is incremented when an event specified occurs. We define the following load metrics based on the micro-architecture of the Intel® Pentum® 4 or Intel® XeonTM Processors [2]:
· The number FP operations executed. This represents load against FP Move and FP Execute unit.
· The number of cache and TLB related activities. L1/L2 cache misses, TLB misses. We are interested in more in the local impacts, rather than the system-wide ones.
· The number of memory load/store operations. This represents load against Memory Load and Store unit.
· The number of bus activities. Access to main memory, traffic for cache coherency, DMA operations, etc.
The /proc/pmc is a read-only file, and it provides information on the number of events measured by hardware performance monitoring counters. We developed the driver for the purpose of this project. Upon read, it prints the information after the last read, then resets the counters. For each process, it lists PID (process id), command name (the one seen in the ps command, for example), CPU ID (on which it is located), processor package ID, and performance event counters. For each logical processor, it also lists the accumulated event counts.
MASA calculates the following loads, reading the performance event counter information from the PMC driver.
For a process, process load is calculated against its load metrics, based on the performance monitoring counters. Thus process load is not a linear value, but multi-dimensional one. Those bare values read from the performance monitoring counters maintained in the per-process data structure in the OS, and the PMC driver reads and reset those values.
CPU load represents the accumulated load against that logical processor, calculated by counts against the load metrics. Like a process, it is not linear value, but multi-dimensional one. Since there are many activities other than the ones for processes, such as interrupt, exception handling (especially, page fault), we dont calculate CPU load as the sum of process loads on it. Instead, we keep the performance monitoring counters running, and we update CPU load and reset the counters at context switch time. Those bare values read from the performance monitoring counters are maintained in the per-CPU data structure in the OS, and the PMC driver reads and reset those values.
We need to evaluate the load to estimate the impact, especially when we migrate a process from a processor package to another, for the purpose of load balancing. We need to simplify the calculation and make it effective. There are two options for that:
Option 1 Use a linear function converting a multi-dimensional value to a linear one. The issue with this evaluation is that we lose information when converting a multi-dimensional value to a linear one, especially which execution resources are used most for that process. It is possible that two different workloads can have a similar range of load under this evaluation. And they can have different impacts on the processor package because they utilize different set of execution resources
Option 2 Check one load metric at a time. This is more effective, but we need to determine the order to check.
The question with this option is the order in which we check
imbalance at load balancing time. To set priority on the load metrics, we use
what we call load calibration. Load
calibration determines the ratio of performance impacts caused by sharing a
particular execution resource(s) for each load.
Example:
Run a typical floating-point intensive program on a logical processor in a processor package. Run the same program on the other logical processor, and measure the performance degradation (time) (ΔT0) and the increased load (ΔL0) associated with the floating-point load metric. The ratio ΔT0/ΔL0 basically provides relative impact of using floating-point execution resources.
Run a typical L2 cache intensive program on a logical processor in a processor package. Run the same program on the other logical processor, and measure the performance degradation (time) (ΔT1) and increased number of events (ΔL1) associated with the cache load metric.
The ratio ΔT0/ΔL0 : ΔT1/ΔL1
for example, indicates relative impacts of utilizing the executions
resources associated with those load metrics. The load calibration technique
can handle the variations of micro-architectures for a particular architecture,
because we measure the actual impacts by running typical programs on the
system. The micro-architectural scheduling assist determines the priority of
load metrics at its initialization time.
Assuming we use the two programs FP (i.e. 177.mesa of SPEC-CPU2000) and L2C (197.parser of
SPEC-CPU2000)
for load
calibration
and 5-second
samples reflect the load, we can use the data in Table 3.

First we need to
get the performance of the Base cases (solo-run), and then run the test
cases binding two instances of FP or L2C to a processor package (coupled-run)
with the other processor package idle. For each run, we measure time (in sec.)
and the event counts of FP uops and L2 cache misses.
From the data in Table 6, we can calculate ΔT0/ΔL0
: ΔT1/ΔL1 : = 1.03. This means an L2C cache
miss event has slightly higher impacts. However, the above calculation is an
example only, and we need to use pure benchmarks for this purpose.
If we use this data and look at Table 4, we realize that the processor package 1 has significantly high load (7.369E+07) in the (INT, INT) (L2C, L2C) test case.
The basic method for resolving load imbalance between two packages (with the lowest and highest load) is:
1. Detect interference with execution resource(s) in a processor package.
We use an execution resource limit measured at load calibration time. It is the value measured at solo run. An execution resource limit is the maximum number of the hardware events (per second) associated with a particular execution resource. For example, the execution resource limit for L2C is 46925899/244 = 192319 from Table 6. Note that it is an example to show how to calculate, and it may vary.
2. If found, find the processor packages with the lowest and highest load.
3. Look for a process to migrate, or two processes to swap in those processor packages, to equalize the loads as much as possible.
We employed swapping processes among processor packages rather than simple process migration, because of more choices when equalizing the loads. Since the process swapping mechanism can handle the process migration mechanism as well, we use process swapping hereafter.
In general we need to project the future load of the processors when migrating a process from a processor to another at load balancing time. Assuming that a process continues on the current workload, we can estimate the impact on the new processor that the processes are swapped. Its possible, however, that we can choose a wrong process at process swapping time, causing fluctuations.
We avoid unnecessary fluctuations by checking if the projected load after swapping does not exceed the execution resource limit for every execution resource.
MASA is a user-level program, and it requires the performance monitoring counters (PMC) driver (described below) that provides information of hardware monitoring counters. The following is a summary of the steps taken by the program:
1. Read the device file /proc/pmc implemented by the PMC driver, to get information of the performance monitoring counters for the last period.
2. Calculate process load for the existing processes, and calculate CPU load, and processor package load accordingly. Load of a processor package is given simply by adding the CPU load of the two logical processors in that package.
3. If we detect imbalance between the CPU loads in a processor package, for example, the case where one CPU has more than one outstanding process, but the other has none. This kind of situation can happen as new processes are spawned.
We calculate (sum of package loads)/(4 ´ N) where N is the number of the CPUs in the system (4 is an ad hoc number obtained by experiments). If a process has load more than this value, then we increment the counter for the CPU.
If any imbalance is detected, migrate one of the outstanding processes to the other CPU. Sleep for a specified time to refresh the performance counters, and go back to Step 1. Otherwise,
4. Begin with the top priority load metric:
a. Check interference with the load, by checking if the load exceeds the execution resource limit. If not detected, then check the next load metric in the priority order. Go back to Step 4. Otherwise (if detected),
b. Find the processor packages with the highest (max_load) and lowest CPU (min_load) load in the system with respect to the current load metric.
c. If the imbalance is less than 25%, then jump to Step b (25% is an ad hoc value obtained by experiments). The imbalance is calculated by:
imbalance = (max_load
min_load) / 2
d.
If load imbalance is found, swap the processes that equalize
the loads of the two processor packages with max_load
and min_load, as much as
possible by setting processor affinity. It uses sched_setaffinity() by
providing the PID (process id) and the CPU mask (on which CPU the program must
run) for them.
If load imbalance is not detected or no processes to swap are found for this load metric, then go back to Step 4 for the next load metric. If all the load metrics are check, sleep for a time period specified (5 sec. by default), and go back to Step 1.
Note that migration can be suppressed by a command option to the program, and the program only logs such an event.
We made a prototype of MASA, and reached the same performance as the set up manually bound using full knowledge of the workload (using processor affinity statically), reducing performance variations. At this point, we are using information only on floating-point execution resources and L2 cache load and store misses.
To verify the MASA mechanism works for various workloads, we simultaneously executed four shells of the following shells, each of which executes the programs from SPEC-CPU2000 sequentially:
· Shell_0 164.gzip, 176.gcc, 186.crafty, 252.eon, 254.gap, and 256.bzip2.
·

Shell_1 175.vpr, 181.mcf, 197.parser, 253.perlbmk, 255.vortex, and 300.twolf.
· Shell_2 168.wupwise, 172.mgrid, 177.mesa, 179.art, 187.facerec, 189.lucas, and 200.sixtrack.
· Shell_FP repeats 177.mesa 7 times to have the same duration as the other shells.
· Shell_L2C repeats 197.parser 5 times to have the same duration as the other shells.
Shell_0 and Shell_1 are based on CINT2000 (for measuring and comparing compute-intensive integer performance), and the benchmark programs (12 of them) are split into these two shells one by one. Some of require large data areas.
Shell_2 is based on CFP2000 (for measuring and comparing compute-intensive floating-point performance), and the benchmark programs (7 of them) are picked alternatively i.e. one every two in the list. In reality, such floating-point intensive programs tend to use large data as well, and thus have higher L2C misses.
Note that obviously the SPEC-CPU2000 benchmarks are not intended to run this way, and thus our performance is not relevant to actual SPEC-CPU2000 performance. We measured the results from two test cases where the four shells are run in parallel on a system has dual Intel® XeonTM :
Test Case1 Shell_0, Shell_1, Shell_2, and Shell_L2C
Test Case 2 Shell_0, Shell_1, Shell_2, and Shell_FP
Table 7 shows the results without and with MASA enabled for the test cases, and Table 8 summarizes the results. The results are the average of three runs of each of the test cases (w/o and w/ MASA), and the numbers are the time to complete the benchmarks (in second). The time period for sampling used MASA is 5 seconds. Table 8 also shows the number of process migration during the test case, and they are applicable only to the cases with MASA. Test Case 1, for example, caused process swapping 51 times due to imbalance with respect to L2 misses, and 13 times due to imbalance with respect to FP uops. Since we placed higher priority on imbalance with L2 cache misses based on load calibration, we tend to see higher swapping rates for L2 misses.
At this point, we dont see visible overhead with running MASA mainly because it checks relatively infrequently (once per 5 sec. or, at most once per 1 sec.). Since our purpose is to detect and resolve severe load imbalance caused by execution resource contentions, we dont believe we need more frequent monitoring.
|
Test
Case |
Total
(w/o MASA) |
Total (w/ MASA) |
Gain
(%) |
# of Swapping |
|
Test
Case 1 |
11036 |
10717 |
2.9 |
51 (L2 miss) 13 (FP uops) |
|
Test
Case 2 |
9322 |
8743 |
6.2 |
54 (L2 miss) 20 (FP uops) |
Table 8: Summary of Table 7
In a single processor package, HT enables the execution resources in a processor package to be used more efficiently. Excess resource bandwidth from one logical processor can be used to make progress on the other and increase overall utilization of the processor execution resources. In the multiprocessor (or multi-processor-package) environment, the OS can utilize the CPU execution resources among the processor packages with optimal placement of the processes, if it can monitor and balance the load of the execution resources utilized at runtime.
MASA uses the information from the hardware monitoring counters to evaluate the load of process packages and processes. We implemented a prototype of MASA, and the data shows that it improves performance by 6% for the workloads from SPEC-CPU2000, especially for floating-point intensive case. We still need to evaluate the effectiveness of MASA by running various applications, and to improve the algorithm, exploiting more load metrics.
I/O interrupt handling can be handled in the same fashion. At
this point, the mechanism of I/O interrupt routing is primitive (typically done
by the chipset and interrupt controller) and we believe that it can be improved
by using the micro-architectural scheduling assist when deciding to which
processor/package particular interrupts are routed at runtime.
We would like to thank the anonymous reviewers for their useful comments. We thank Sunil Saxena and Asit Mallick for their support.
References
[2]
Hinton, G; Sager, D; Upton, M; Boggs, D; Carmean, D;
Kyker, A.; Roussel, P. The Microarchitecture of the Pentum® 4 Processor, Intel
Technology Journal, 2002. http://developer.intel.com/technology/hyperthreaad
[3] Intel® Vtune Performance
Analyzer, http://www.intel.com/software/products/vtune/vtune60/
Intel®
Vtune Performance Analyzer, http://www.intel.com/software/products/vtune/vtune60/
[11] B. Weissman, Performance Counters and State Sharing Annotations: A Unified Approach to Thread Locality, Proc. of the 8th Int. Conf. Architectural Support for Programming Langurage and Operating Systems, pp. 127 138, 1998.
[12]
SPEC CPU2000, http://www.spec.org/osg/cpu2000/
This appendix
describes the changes for supporting HT in Linux 2.4.19 (www.kernel.org) kernel. Those changes or requirements should be applicable to an OS in general when supporting HT, although some of them might
need to re-implemented for the target OS.
· fs/binfmt_elf.c (line 141 line 155): Linux sets a constant value to the initial user stack pointer for every process. We adjust the pointer using the PID to minimize L1 cache eviction (see 1.2).
· kernel/sched.c (line 265 line 279): Prioritize an idle package (both logical CPUs are idle) over an idle CPU, because the other logical CPU may not be idle, but busy. The variable smp_num_siblings maintains the number of the logical CPUs in a package. It is 2 for the Intel® XeonTM processor family at this point.
· arch/i386/kernel/setup.c (line 2404 line 2452): Detection of HT, and setup of mapping between the logical CPUs and the processor package, or the array cpu_sibling_map[], which contains the other logical CPU number given the current CPU number as the index.
· arch/i386/kernel/acpitable.c (entire file): ACPI (Advanced Configuration & Power Interface, see http://www.acpi.info) table parsing. When HT is enabled, the number of the logical CPUs is reported in the ACPI table, not the MPS (Multi-Processor Specification, see http://www.intel.com/design/intarch/MANUALS/242016.htm, for example) table. The OS needs to look at the ACPI table for HT.
· arch/i386/kernel/semaphore.c (line 270, line 283): PAUSE instruction rep; nop. This change is useful for generic IA-32 Intel® Architecture SMP systems as well.
· arch/i386/kernel/mtrr.c: The code used when if the target CPU is MTRR_IF_INTEL. Since the MTRRs (Memory Type Range Register) resources are shared in a processor package, and update to MTRRs must be atomic. In Linux, it was possible that two logical CPUs in processor package update MTRRs simultaneously and changed those registers inconsistently.
· arch/i386/kernel/microcode.c (line 76, line 252 line 299): The current Linux updates the micro code simultaneously on every CPU sending Inter-Processor Interrupt (IPI). Since the micro code resource is shared by the logical CPUs in a processor package, the update should be done one time. To ensure that the update happens only one time for each processor package rather than for each logical CPU, the spin lock
microcode_update_lock is used to make the update atomic. Otherwise we see a race condition.
· include/asm-i386/spinlock.h (line 62): No change required. Original code already had had this code (PAUSE instruction).
· include/asm-i386/system.h (line 318): No change required. Original code already had had this code (hlt instruction for the idle loop).
|
This paper was originally published in the
Proceedings of the
2nd Workshop on Industrial Experiences with Systems Software,
December 8,
Boston, MA, US
Last changed: 6 Nov. 2002 aw |
|

 By
utilizing the process-level or thread-level parallelisms in applications, twice
as many (hardware) threads can be dispatched and executing concurrently using
the execution resources in a processor package.
By
utilizing the process-level or thread-level parallelisms in applications, twice
as many (hardware) threads can be dispatched and executing concurrently using
the execution resources in a processor package.