Alma Riska
Seagate Research
Pittsburgh, PA 15222
Erik Riedel
Seagate Research
Pittsburgh, PA 15222
Traditionally, various venues have been explored to obtain insight on storage system workloads, in general, and disk drive workloads, in particular. Among most popular ones, are a growing set of benchmarks designed by either individual companies or consortiums such as the TPC [17] and SPC [16]. In addition, efforts have been placed to instrument the operating system to trace the IO activity at various levels of the storage hierarchy, such as the file system level and the device driver level [2,20]. Examples of traces obtained through such instrumentation can be found collectively at the SNIA trace repository [15]. In addition to instrumenting the operating system, a non-invasive approach to capturing live IO workloads is using a SCSI or IDE bus analyzer [9].
The main characteristic of the above techniques to trace the IO activity is that they apply on individual systems that have either been instrumented or fitted to collect the traces. Usually the trace collection goes on for a limited amount of time, in particular if the systems are production ones. Nevertheless, the amount of information that these type of traces contain helps enormously with the understanding of the fine-grained operation of the IO subsystem. The main drawback of such trace collection techniques is associated with the generality of the scenario captured by the traces. The concern is that the collected traces would fail to capture some critical application scenario that affects the efficiency and applicability of the design.
In this paper, we present a way to gain some general insight on disk drive workloads over an entire family of drives rather than disks deployed in individual systems. Disk drives continuously monitor their operation and log their activity in a set of attributes. Examples of these attributes include the total amount of bytes read and written in the drive, the total number of seeks performed, the total number of drive spin-ups, and the total number of operation hours. This set of attributes amounts to a few kilobytes of data and is updated only during disk drive idle times.
When disk drives operate in the field, it is difficult to obtain such information, unless the system is instrumented to do so. However, if a disk drive is returned back to the vendor, because of an issue, then this set of logged attributes can be read off the drive. At Seagate, upon return, a disk drives undergoes the Field Return Incoming Test, which collects such data. The result of the test is a rich set of data that can be used to draw conclusions on the workload that disk drives experience in the field.
In this paper, we focus on two data sets. The first one includes approximately 200,000 drives from the Cheetah 10K family and the second one includes approximately 110,000 drives from the Cheetah 15K family. Our analysis consists of extracting only usage and workload characteristics across one drive family1. We construct average behavior and worst case scenarios by building the empirical distributions of the average amount of bytes read, written, and seeks completed per unit of time. We obtain more details on drive workloads by further classifying the drives into subsets based on their age and/or capacity.
We observe that the average behavior of a drive family is variable, as expected. Yet the workload variability is more pronounced during the first month of life than afterward. We also note that the majority of drives completes more data writing than reading during their lifetime. Most importantly, the disk drives are lightly utilized, although about 10% of them seem to experience high utilization. Generally, the Cheetah 15K drives complete more work and experience less variation in behavior than the Cheetah 10K drives.
The extracted workload characteristics from our analysis can be used to guide the design of features that intend to improve overall drive operation, including reliability, performance, and power consumption.
The rest of the paper is organized as follows. In Section 2, we present a high level description of the data sets included in our evaluation. Section 3 presents the analysis of the logged attributes such as number of spin-ups, amount of bytes read and written, and number of completed seeks. We present related work in Section 4. We conclude with Section 5, which summarizes our work.
It is a known fact that IO workloads are application dependent and different applications utilize the storage subsystem differently [13,4]. However analysis of live workloads [9] indicates that there are high level IO characteristics that remain invariant through different applications and across different computing environments such as enterprise, desktop and consumer electronics. For example, idleness and burstiness characterize the majority of disk drive workloads, while READ/WRITE ratio, workload sequentiality, arrival rate, and service process are largely environment specific. Because traditionally, different hardware devices target different operation environments, then at least the environment-dependent characteristics can be understood by analyzing an entire family of drives. For example, the Cheetah 15K family of drives, is used in high-end storage systems, where performance and reliability are the most important metrics of quality. Analysis of a large set of drives from this family allows one to draw conclusions on the work that these drives are exposed to.
While obtaining detailed information on the operation of an entire family of drives is unrealistic, we obtain high-level workload information by analyzing the logged cumulative attributes that are extracted from the returned drives during the Field Return Incoming Test. Specifically, we focus on the attributes that record the amount of bytes READ, WRITTEN, and seeks completed over the entire lifetime of a drive. The latter is measured in hours and is also recorded in an attribute. Per drive, we can estimate the average amount of data READ, WRITTEN, or seeks completed per unit of time. As a result, for each drive we have only one value per attribute.
Because the information per drive is limited to the average behavior, we cannot draw conclusions on the burstiness of workload in general, i.e., over time workload behavior. Nevertheless, because we have a large set of drives (about 1% of all shipped drives from a given family), then it becomes possible to construct empirical distributions that allow us to understand the overall behavior of the entire family of drives.
In Table 1, we give the size of our two data sets. In our analysis, we further partition the drives into two subsets according to their age; into drives that have been in the field less than a month (i.e., age less than 720) and drives that have been in the field more than a month (i.e., age more than 720). The reason for this categorization is to have a rough separation of drives that have experienced in the field only activities that are associated with the integration (i.e., drive installation in a cabinet, RAID initialization, and population of the drive with data) from the drives that have experienced every day activities (i.e., reading, writing new and old data) in addition to the integration.
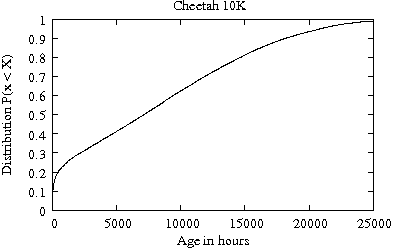
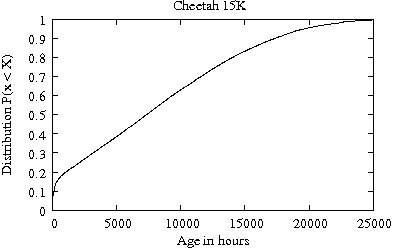
Using the age attribute, we construct the empirical cumulative distribution of the age of the drives in our data sets. We show the results in Figure 1. While about 20-25% of the drives are less than one month old at the time they were returned, we note that the rest of the drives in our data sets have been in the field for as long as three years (i.e., corresponding to the period these specific families of drives have been shipping to customers). The distribution shows that at least 50% of the drives have been in the field for more than a year, which provides confidence that the conclusions that we draw for the drives in the field are supported from a long period of operation.
The main concern associated with the data set is its source. The workload information comes from drives that have been returned back because of issues with their operations. As a result, the data set is not a random subset of drives from the entire family. Because it is believed that the drives that work more fail earlier, one may argue that the workload experienced by these drives may be heavier that the average workload in the field. We cannot prove either the existence of bias or the independence in the selection of the data set. Yet, we are confident that the results presented here represent tight upper bounds of the average workload behavior of the drives for a given family, because in our analysis we include only drives that experience non-essential faulty behavior, i.e., the drive still can access most of the data and its logs.
In this section, we analyze the attributes recorded in our data sets and derive conclusions on the work and the traffic mix that is experienced by the drives in the field.
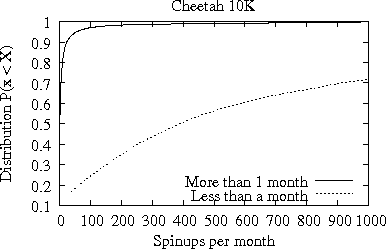
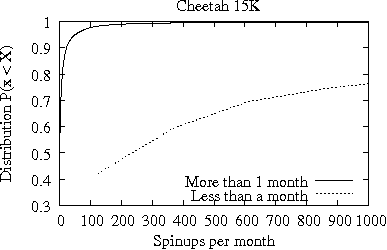
One of the attributes in the data set is the number of times the drives have been powered up/down in their lifetime, i.e., the spin ups. We show the empirical cumulative distribution of spin ups per month in Figure 2. We use the age categorization given in Table 1 to show that the integration part of the drive's lifetime is significantly different from the operation part. While the number of spin ups during the first month of life is measured in hundreds and thousands (the dotted line in each of the plots of Figure 2), the average number of spin ups for older drives is significantly smaller. This is a clear indication that disk drives of high-end families such as Cheetah 10K and 15K are expected to be operational 24/7 and rarely get shut down, expect during the early-life period.
|
The most important attributes extracted during the Field Return Incoming test are of number of bytes READ and the number of bytes WRITTEN during the lifetime of a drive. These attributes indicate the amount of data requested from the drives and it provides information on the average amount of work processed by the drive. In Table 2, we give the average amount of bytes READ and WRITTEN per hour and the respective coefficient of variation2 for the Cheetah 10K and 15K families and both age-based categories of drives.
As expected, the average amount of work per hour demanded by the drives is approximately two times larger during the integration process than in the field. The average amount of bytes READ and WRITTEN per hour is less than 200 MB, when drives have been more than one month in operation, and between 300 to 400 MB when drives have been less than one month in the field. Overall, throughout their life, drives are expected to be only moderately utilized, because the maximum amount of data that can be transferred per hour is much larger that the averages shown in Table 2. Furthermore, during the first month of life, drives write more than they read for both families of drives, which is also associated with the character of the integration process that drives go through.
However, the values of the coefficient of variation in Table 2 indicate that across both data sets the average values of bytes READ and WRITTEN are highly variable (i.e., the CV values are larger than 1, which corresponds to the standard variability of the well-behaved exponential distribution). Actually during the first month of life the variability in the amount of data requested is much higher than during the rest of the drive's life.
As indicated earlier in this section, because our data set is large, the empirical distribution of the amount of bytes READ and WRITTEN per unit of time, is expected to closely represent the distribution of the average amount of data requested across an entire family of drives. Most importantly, this distribution would allow us to understand the worst case scenarios with regard to the utilization of drives.
|
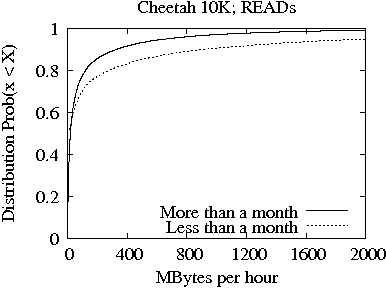
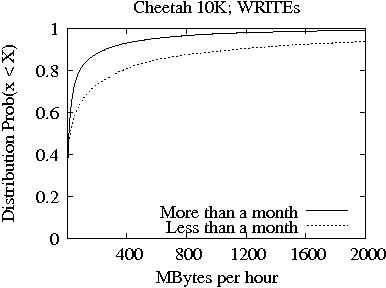
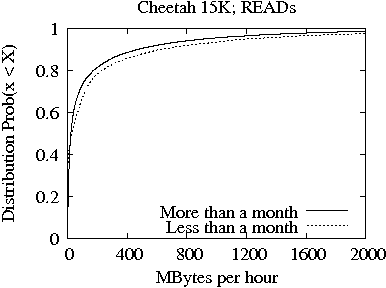
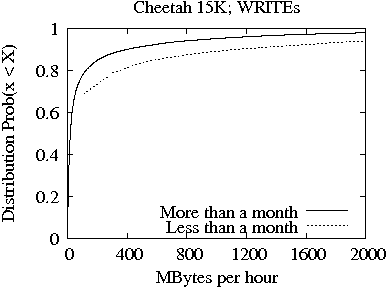
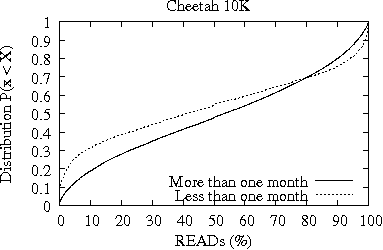
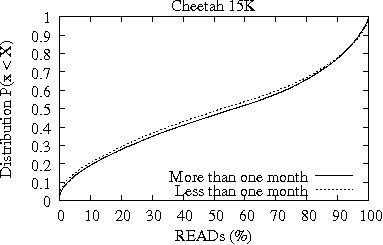
In Figures 3 and 4, we present the distribution of bytes READ (top plot) and WRITTEN (bottom plot) per hour for the Cheetah 10K and 15K families, respectively. In each plot, we show two lines which correspond to the two age-based drive categories from Table 1 (i.e., drives less and more than one month old at time of return), respectively. Consistent with the results from Table 2, the distributions clearly show that there is significant difference between the amount of bytes READ and WRITTEN per hour during the first month of operation and later on. Yet, the differences between the two age-based drive categories are less pronounced in the Cheetah 15K family (Figure 4) than in the Cheetah 10K family (Figure 3).
|
The median of the distributions shown in Figures 3 and 4 is between 15-20MB of data READ or WRITTEN per hour, which indicates that the majority of drives would be only slightly utilized over the course of their life. Nevertheless, the distribution of Figure 3 for the more than one month old Cheetah 10K drives shows that only 3% of drives consistently READ or WRITE more than 1 GB of data per hour during their entire life. For the Cheetah 15K drives, there are 5% of drives with more than one month of life that READ or WRITE more than 1 GB of data per hour throughout their life. As a result, we conclude that the drives of the Cheetah 15K family experience more work than the drives of the Cheetah 10K family.
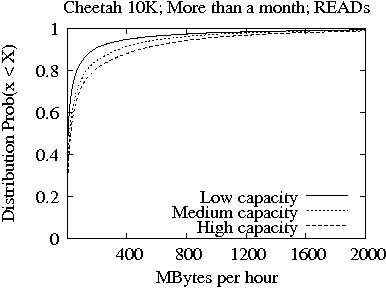
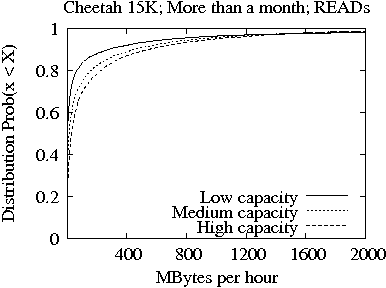
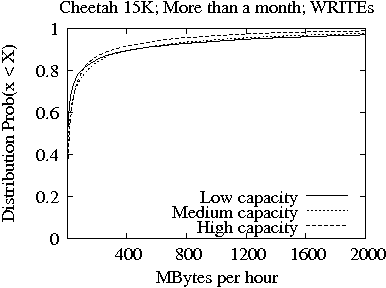
In our data set, we can identify the capacity level of the drives based on the number of platters in the drive. We classify the drives as having (a) low capacity if they have one platter, (b) medium capacity if they have two platters, and (c) high capacity if they have four platters. We focus only on the set of drives with more than one month of operation and construct the same distributions as the one showed in Figures 3 and 4. We show the results in Figures 5 and 6, respectively. The main observation is that while the amount of MB reads per hour is larger for larger drive capacities, the amount of MB written per hour is more or less the same for all capacity-based categories of drives. This allows us to conclude that the larger capacity drives are installed in systems where more data is accessed per unit of time than in the systems where the low capacity drives are installed.

|
Comparing Figure 6 with Figure 5, we note that the drives of the 15K family are characterized by heavier tails in the distribution of MB read or written per hour. In particular, the smaller the capacity of drives, the heavier the tail. This observation enforces that 15K drives are installed in system with high performance requirements. In particular the low capacity drives are operating in environments with high demands.
|
In Figure 7, we explicitly plot the empirical cumulative distribution of the ratio of bytes READ vs. bytes WRITTEN for the two families of drives and the two age-based categories. The plots show that for the 10K family of drives, during the first month of life there is more writing than reading, which indicates that drives are integrated into systems where considerable amount of data is stored a priory. In contrary, for the 15K family of drives, there is the same distribution of the READ/WRITE ratio for both age-based categories which indicates that the data stored on the drives is written there during the lifetime of the drives.
|
Both plots in Figure 7 indicate that the portion of drives with more than 50% WRITEs, in average, is higher than the portion of drives with more than 50% READs, in average. As a result, we conclude that the workload at the disk-drive level is expected to be WRITE oriented. This is an important characteristic when it comes to designing new features that enhance reliability and performance at the disk drive level, because most of them depend on the WRITE portion of the IO traffic [11,3].
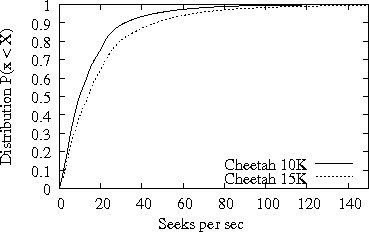
While the amount of data transferred is an indicator of the work requested from the disk drive, the number of completed seeks is an indicator of the number of requests that are served by the disk drive. The utilization of the disk drive is associated more closely with the number of seeks (i.e., requests) than the bytes transferred, because the head positioning overhead that often dominates disk service times is associated with the number of requests (seeks) than bytes per request. In Figure 8, we present the empirical cumulative distribution of the average number of completed seeks per second of operation for the two families of drives and only for the category that includes drives that have been in the field for more than a month.
|
Figure 8 shows that the drives of the 15K family do complete in average more seeks per second than the drives of the 10K family. Nevertheless, the plots show that only 10% of 10K and 15K drives complete in average 30 seeks per second and 40 seeks per second, respectively, during their lifetime. Given that a seek may take in average 5 ms, it means that this 10% of drives is significantly utilized. For this percentage of drives, the user requests utilize the drives more than 50% (when rotation latency and data transfer latency are taken into consideration). As a result, we conclude that about one tenth of the drives have limited idleness and consequently limited room to deploy any advanced features that aim at enhancing drive's reliability, performance, and/or power consumption [11,3,6].
Mainly, IO workload characterization has dealt with high-end multi-user computer systems [8,13,20], because of the criticality of the applications they support and the data they store, including commercial databases, scientific data and applications, and Internet services. The file system behavior is evaluated in detail across various environments in [12]. The file system workload in personal computers is characterized in [21] and particularly for Windows NT workstations in [18]. A general view of the block-level workloads is given in [9,10], where IO traces from enterprise, desktop, and consumer electronic systems are evaluated. In addition to capturing live workloads via system instrumentation, there have been efforts also to devise techniques that generate representative synthetic IO workloads [19] despite the many challenges associated with them [4].
Using this information, we were able to extract the average performance of a drive family which commonly is associated with a specific set of computing environments. We also constructed the distributions of the observed attributes to understand the worst case scenario with respect to the load seen by the drives in a family. Furthermore, we categorized the drives by age and by capacity and evaluated the specific differences and commonalities of these sub-families.
We concluded that the disk drive workload varies significantly during the first month of life, when they are integrated in the storage systems in the field. After that, the variability in drive workloads across a family reduces. Yet, drives are lightly utilized and only about 10% of them experience consistent moderate utilization throughout their lifetime. Furthermore, we also observed that more drives WRITE more than they READ. Overall, these characteristics can be used to devise effective techniques and features in the drive that aim at enhancing drive reliability, performance and power consumption.
This document was generated using the LaTeX2HTML translator Version 2002-2-1 (1.71)
Copyright © 1993, 1994, 1995, 1996,
Nikos Drakos,
Computer Based Learning Unit, University of Leeds.
Copyright © 1997, 1998, 1999,
Ross Moore,
Mathematics Department, Macquarie University, Sydney.
The command line arguments were:
latex2html -split 0 -show_section_numbers -local_icons -no_navigation main.tex
The translation was initiated by Alma Riska on 2008-11-11