Black-Box Performance Control for High-Volume Non-Interactive Systems
Chunqiang Tang1, Sunjit Tara2,
Rong N. Chang1, and Chun Zhang1 1 IBM T.J. Watson Research Center
2 IBM Software Group, Tivoli
Abstract
This paper studies performance control for high-volume non-interactive
systems, and uses IBM Tivoli
Netcool/Impact-a software product in the IT monitoring and
management domain-as a concrete example. High-volume non-interactive
systems include a large class of applications where requests or processing
tasks are generated automatically in high volume by software tools rather than
by interactive users, e.g., data stream processing and search engine index
update. These systems are becoming increasingly popular and their performance
characteristics are radically different from those of typical online Web
applications. Most notably, Web applications are response time sensitive,
whereas these systems are throughput centric.
This paper presents a performance controller, TCC, for throughput-centric
systems. It takes a black-box
approach to probe the achievable maximum throughput that does not saturate any
bottleneck resource in a distributed system.
Experiments show that TCC performs robustly under different system
topologies, handles different types of bottleneck
resources (e.g., CPU, memory, disk, and network),
and is reactive
to resource contentions caused by an uncontrolled external program.
Performance control for online interactive Web applications has been a
research topic for years, and tremendous progress has been made in that
area [2,10,23,28]. By
contrast, relatively little attention has been paid to performance control
for a large class of increasingly popular applications, where requests or
processing tasks are generated automatically in high volume by software tools
rather than by interactive users. Many emerging stream processing
systems [1] fall into this category, e.g., continuous
analysis and distribution of news articles, as in Google
Reader [11] and System S [19].
Moreover, almost every high-volume interactive Web application is supported
behind the scene by a set of high-volume non-interactive processes, e.g., Web
crawling and index update in search engines [7], Web log
mining for portal personalization [22],
video preprocessing and format conversion in YouTube,
and batch
conversion of rich-media Web sites for mobile phone
users [3].
Beyond the Web domain, examples of high-volume non-interactive
systems include IT monitoring and management [15],
overnight analysis of retail transaction logs [5],
film animation rendering [14],
scientific applications [6],
sensor networks for habitat monitoring [20],
network traffic analysis [26], and video
surveillance [8].
The workloads and operating environments of these high-volume non-interactive
systems differ radically from those of session-based online Web applications.
Most notably, Web applications usually use response time to guide performance
control [2,23,28], whereas
high-volume non-interactive systems are throughput centric and need not
guarantee sub-second response time, because there are no interactive users
waiting for immediate responses of individual requests. Instead, these
systems benefit more from high throughput, which helps lower
average response time and hardware requirements.
This paper studies performance control for high-volume non-interactive
systems, and uses IBM Tivoli Netcool/Impact [16]-a software
product in the IT monitoring and management domain-as a concrete example.
Today's enterprise IT environments are extremely complex. They often include
resources from multiple vendors and platforms. Every hardware, OS,
middleware, and application usually comes with its own siloed monitoring and
management tool. To provide a holistic view of the entire IT environment while
taking into account dependencies between IT components, a federated IT Service
Management (ITSM) system may use a core event-processing engine such as
Netcool/Impact
to drive and integrate various siloed software involved in
IT management.
An IT event broadly represents a piece of information that need be processed
by the ITSM system. For instance, under normal operations, transaction
response time may be collected continuously to determine the service quality.
Monitoring tools can
also generate events to report problems, e.g., a
database is down.
When processing an event,
the event-processing engine may interact with various third-party
programs,
e.g., retrieving customer profile from a remote database
and invoking an instant messaging server to
notify the system administrator if a VIP customer is affected.
When a major IT component (e.g., core router) fails, the rate of IT events may
surge by several orders of magnitude due to the domino effect of the failure.
If the event-processing engine tries to process all events concurrently,
either the engine itself or some third-party
programs working with the engine may
become severely overloaded and suffer from thrashing.
In this work, the purpose of performance control is to dynamically adjust the
concurrency level in the event-processing engine so as
to maximize throughput while avoiding
fully saturating either the engine
itself or any third-party program working with the engine,
i.e., targeting 85-95% resource utilization (as opposed to 100%) even
during peak usage.
The main difficulty in achieving this goal is caused by the diversity and
proprietary nature of the multi-vendor components used in a federated ITSM
system. For practical reasons,
we can only take a black-box approach and cannot rely on
many assumptions presumed by existing performance control algorithms.
We cannot aggressively maximize performance without considering resource
contention with external programs not under our control. Therefore, we cannot
use greedy parameter search [25].
We cannot assume a priori knowledge of system topology (e.g., three-tier),
and hence cannot use solutions based on static queueing models [23].
We cannot assume knowledge of every external
program's service-level objectives (as
in [18]), or knowledge of every component's performance
characteristics, e.g., through offline profiling as in [24].
Therefore, we cannot directly adopt these methods based on
classical control theory.
We cannot assume the ability to track resource consumption of every component,
or a prior knowledge of the location or type of the bottleneck.
Therefore, we cannot adopt solutions
that adjust program behavior based on measured resource utilization level.
We have no simple performance indicators to guide
tuning, such as packet loss in TCP [17] or response
time violation in interactive Web applications [2].
The discussion below assumes that the number of worker threads in the
event-processing engine controls the concurrency level.
We explore the relationship between throughput and the event-processing
concurrency level to guide performance tuning (see
Figure 1). With too few threads, the throughput
is low while system resources are underutilized. As the number of threads
increases, the throughput initially increases almost linearly, and then
gradually flattens, because the bottleneck resource is near saturation. Once
the bottleneck saturates, adding more threads actually decreases
throughput because of the overhead in managing resource contention. Finally,
using an excessive number of threads causes thrashing, and the throughput
drops sharply.
Figure 1:
Basic idea of throughput-guided concurrency control (TCC). The symbols
- show the controller's operation sequence.
If memory is the bottleneck resource, the throughput may follow the dotted
line and then suddenly move into thrashing without a gradual transition.
This figure is further explained
in Section 3.1.
We refer to our controller as TCC (throughput-guided
concurrency control). Intuitively, it works as
follows. Starting from an initial
configuration, it tentatively adds some threads (transition
in Figure 1), and then
compares the throughput measured before and after the change. If the
throughput increases "significantly", it keeps adding threads (transitions
), until either the
throughput starts to decline or the improvement in throughput becomes marginal
(transition ).
It then successively removes threads
(transitions ), until the
throughput becomes a certain fraction (e.g., 95%) of the maximum throughput
achieved during the exploration. The purpose is to reach a stable state that
delivers high throughput while not saturating the bottleneck resource.
We address several challenges to make this basic idea practical. Because the
exact shape of the thread-throughput curve in Figure 1
varies in different environments, a robust method is needed to determine when
the throughput "almost" flattens. If the controller adds threads too
aggressively, it may cause resource saturation and gain unfair advantages when
competing with an uncontrolled external program. Another challenge is to make
quick control decisions based on noisy performance measurement data, e.g.,
abnormal long pauses caused by Java garbage collection.
Our solutions to these challenges are described in Section 3.
Our controller is flexible. It takes a black-box approach to
maximize throughput
while trying to avoid saturating the bottleneck resource.
It makes few
assumptions about the operating environment. It need not know system
topology, performance characteristics of external programs, resource utilization
level, or exactly which resource is the bottleneck. It can handle
both hardware (e.g., CPU, memory, disk, or network) and software (e.g.,
database connection pool) bottleneck resources.
Because of its flexibility, it may be broadly applied to
high-volume non-interactive systems [1,6,7,19,20,22,,,26].
We have implemented TCC and integrated it with IBM Tivoli
Netcool/Impact [16]. The Netcool suite [15] is a
set of software products that help implement a federated ITSM system, and
Netcool/Impact is the streaming event-processing engine of the Netcool suite.
Experiments demonstrate that TCC performs robustly under different system
topologies, handles different types of bottleneck resources, and is reactive
to resource contentions caused by an uncontrolled external program.
The remainder of the paper is organized as follows. Section 2
provides an overview of Netcool/Impact. Sections 3
and 4 present and evaluate TCC, respectively. Related work is
discussed in Section 5. Section 6
concludes the paper.
Our performance controller is generic, and its current implementation can
actually be configured to
compile and run independent of the Netcool/Impact product. To make
the discussion more concrete, however, we choose to present it in the context
of Netcool/Impact. Netcool/Impact is a mature product with a large set of
features. Below, we briefly summarize those features most relevant to our
discussion.
We simply refer to
Netcool/Impact as NCI.
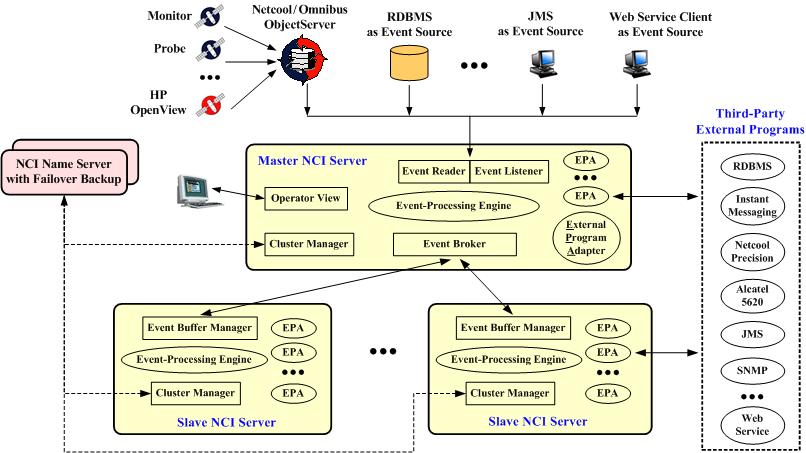
Figure 2:
A radically simplified architecture diagram
of Netcool/Impact (NCI). IT events flow from top to bottom.
NCI adopts a clustering architecture (see Figure 2).
The "master NCI server"
is the data fetcher and load balancer. Its "event reader"
pulls IT events from various sources, while its "event listener" receives
events pushed from various sources. It processes some events in its local
"event-processing engine", and dispatches the rest to the "slave NCI
servers"
for load balancing. The "NCI name server" manages members of the cluster.
If the master fails, a slave will be converted into master.
The "event-processing engine" executes user-supplied programs written in the
Impact Policy Language (IPL). IPL is a proprietary
scripting language specially designed for event processing,
emphasizing ease of use for system administrators. With the help of various
built-in "external program adapters", IPL scripts can easily integrate with
many third-party programs.
Each NCI server (master or slave) uses a pool of threads to process events and
runs a performance controller to determine for itself the appropriate thread
pool size. When an event arrives, the NCI server goes through a
list of admin-specified matching rules to identify the IPL script that will be
used to process the event. The event waits in a queue until an
event-processing thread becomes available, and then the thread is dispatched
to interpret the IPL script with the event as input.
In a large IT environment, monitoring events (e.g., CPU utilization reports)
are generated continuously at a high rate even under normal operations. Some
events are filtered locally, while the rest are collected in realtime, e.g.,
to the Netcool/OMNIbus ObjectServer [15],
which buffers events and feeds them to
the master NCI server in batches, e.g., one batch every five seconds. Events
are not sent to the master individually for the sake of efficiency.
Similarly, a slave NCI server fetches events in batches from the master.
Because events are fetched in batches, an NCI server often holds a large
number of unprocessed events. If the server tries to process all of them
concurrently, either the server itself or some third-party programs working
with the server will become severely overloaded and suffer from thrashing.
Moreover, it needs to carefully control the concurrency level of event
processing so that it achieves high throughput while sharing resources with a
competing program in a friendly manner.
Our performance control goal is to maximize event-processing throughput while
avoiding saturating NCI or any third-party program working with NCI.
Even during peak usage, the utilization level of the bottleneck resource
should be controlled, e.g., between 85% and 95%, instead of 100%.
We must avoid saturating the master NCI server because it hosts other services
such as "operator view" (see Figure 2), which provides a
customizable dashboard for administrators to look into the details of IT
events.
In addition, we must avoid saturating third-party programs
working with NCI, because they may
serve clients other than NCI, including interactive users.
In light of today's complex and heterogeneous IT environments, the success of
the NCI product to a great extent owes to its common adapter platform that
helps integrate various distributed data sources and siloed monitoring and
management tools. Because of the diversity and proprietary nature of these
third-party external programs working with NCI, we can only take a black-box
approach and cannot rely on many
assumptions that are presumed by existing performance control
algorithms (as those listed in Section 1) .
This section presents our controller TCC in detail. We start with a
description of TCC's state transition diagram, and then use queuing models to
analyze TCC and demonstrate that it can achieve high resource utilization. We
then derive the friendly resource sharing conditions for TCC. We also present
a statistical method that minimizes measurement samples needed for making
control decisions. Finally, we put all the pieces together to guide the
selection of TCC's parameters.
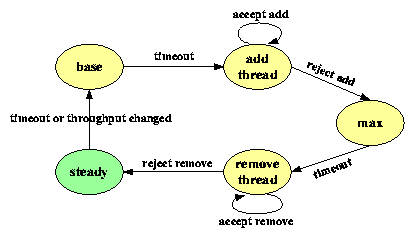
Figure 3:
Simplified state-transition diagram of TCC.
TCC operates according to the state-transition diagram in
Figure 3. Most of the time, it stays in the "steady"
state, using a constant number of threads to process events
that continuously
arrive in batches.
The number of threads is optimal if those
threads can drive the bottleneck resource to a high utilization level
(e.g., 85-95%) while avoiding fully saturating it.
Periodically, TCC gets out of the steady state to explore whether a better
configuration exists. It moves into the "base" state and reduces the number
of threads by w%,
which will serve as the exploration
starting point in Figure 1.
(How to select parameters such as w%
will be discussed in Section 3.5.)
TCC stays in the
"base" state for a short period of time to measure the event-processing
throughput. It then increases the number of threads by p% and moves into
the "add-thread" state. If this p% increase in threads helps improve
throughput by q% or more, it stays in the add-thread state and repeatedly
add threads by p% each time. Eventually, the
bottleneck resource is near saturation so that a p% increase in threads no
longer gives a q% or more increase in throughput. It then moves into the
"max" state.
TCC takes more measurement samples in the "max" state in order to calculate a
more accurate baseline throughput. It then moves into the "remove-thread"
state to repeatedly removes threads by r% each time so long as the
throughput does not drop below 95% of the highest throughput achieved during
the current tuning cycle.
When the throughput finally drops below the 95% threshold, it adds back
threads removed in the last round, and moves into the steady
state. It stays in the steady state for a relatively long period of time,
using an optimal number of threads to process events. It restarts the next
round of exploration either after a timeout or when the throughput changes
significantly, which indicates a change in the operating environment.
If memory is the bottleneck, throughput may follow the dotted
line in Figure 1, and then suddenly moves into thrashing
when TCC adds threads. TCC will detect the decline in throughput, revoke the
threads just added, and continue to remove more threads until the throughput
becomes 95% of the measured maximum throughput. This prevents the system
from moving into thrashing.
In this section, we use queuing models to demonstrate that, for common event
processing scenarios, TCC can achieve high resource utilization (and hence
high throughput) while avoiding resource saturation. The discussion below
assumes that TCC uses the default configuration: p=25%, q=14%, and
w=39%. (Section 3.5 discusses parameter
selection.)
Our queueing models assume
the ITSM system consists of one NCI server and some third-party external
programs.
We are interested in system behavior when it continuously processes a block of
events and we assume no threads remain idle due to the lack of input
events.
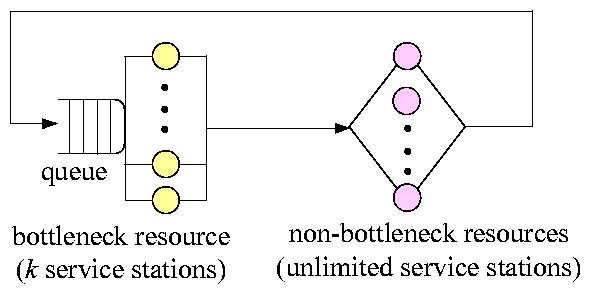
(a) Machine-repairman model
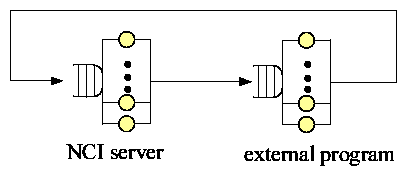
(b) Event-escalation model
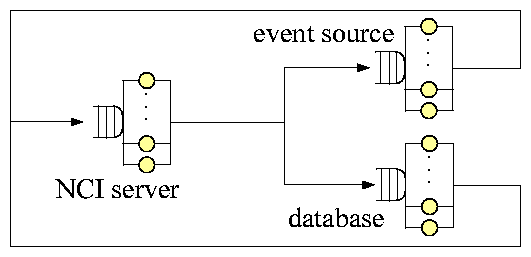
(c)
Event-enrichment model
Figure 4:
Using queueing models to analyze TCC. These closed
models can be solved by
mean value analysis [12].
(a) Machine-repairman model
(b) Event-escalation model
(c)
Event-enrichment model
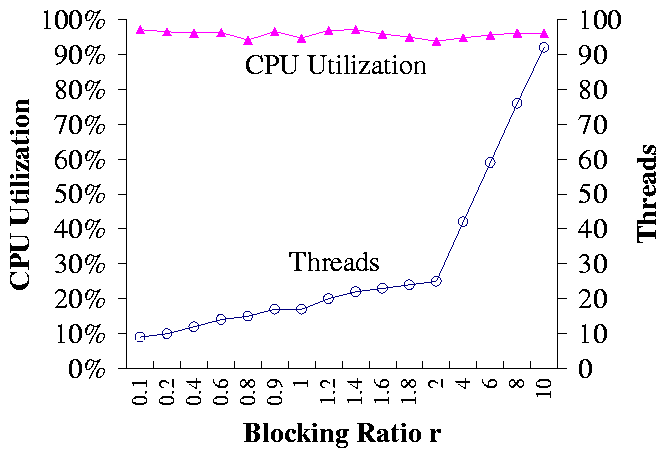
Figure 5:
Performance of TCC under different queueing models. Note that
the x-axis increases nonlinearly.
The first model we use is the machine-repairman
model [12] in Figure 4(a). This model
assumes that the ITSM system has a clearly defined bottleneck resource, whose
utilization level is much higher than that of the other resources. Even if
the bottleneck is fully saturated, the other resources are still
underutilized. Therefore, the queueing delays of the non-bottleneck resources
can be approximately ignored.
We use machine-repairman
model's delay station to represent the sum of the service
times of all non-bottleneck resources. As the delay station can abstractly
represent multiple distributed resources, real systems of different topologies
(e.g., 3 machines or 7 machines) can be represented by this single model, so
long as they have a clearly defined bottleneck. Many real
systems do satisfy this requirement.
The machine-repairman model can predict event-processing throughput
and resource utilization level under different thread
configurations [12]. We modified our implementation
of TCC to take throughput numbers from the model instead of a live system.
This allows us to systematically evaluate TCC under a wide range of
hypothetical workloads.
Figure 5(a) shows the number of threads recommended by TCC
and the corresponding CPU utilization level.
Here we assume that the CPU of the NCI server
is the bottleneck resource, and it has 8 CPUs. CPU utilization is
affected by the blocking ratio r, which is defined as the service time
ratio of the delay station to the bottleneck resource. As r increases, each
thread blocks longer at the delay station, and hence more threads are needed
to drive up CPU utilization. As r varies, TCC is able to adjust the
number of threads accordingly to keep high CPU utilization while avoiding
complete saturation.
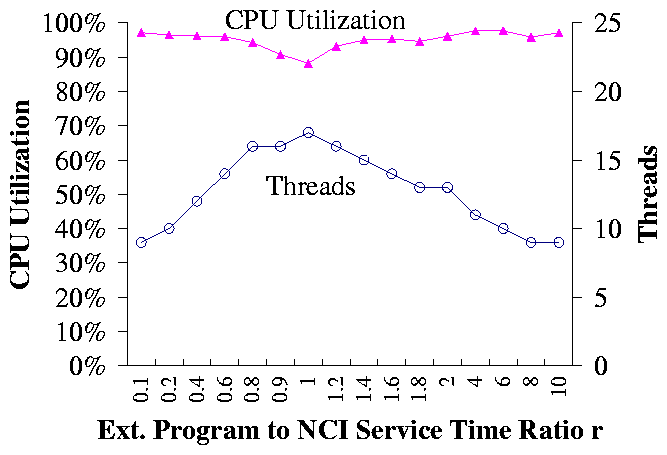
Figure 4(b) shows the event-escalation model, where the NCI
server processes an event and then invokes an external program, e.g., an
instant messaging server. This model differs from the machine-repairman model
in that it does not assume the queueing delays of the non-bottleneck resources
are negligible.
Figure 5(b) shows the performance of TCC when both machines
have 8 CPUs. The x-axis is the service time ratio r of the external
program to the NCI server. The y-axis is the CPU utilization of the
bottleneck resource. The bottleneck is the NCI server if r < 1, or the
external program if r > 1. The lowest utilization 88% occurs when r=1,
i.e., when the utilization levels of two machines are identical. In this
case, more threads are needed to simultaneously drive both machines to high
utilization.
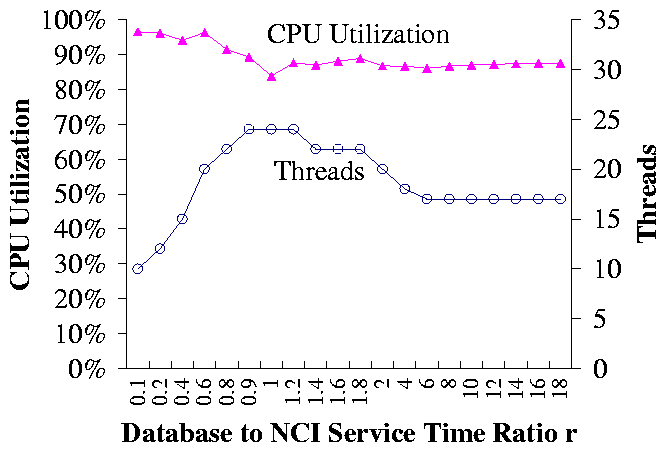
Figure 4(c) shows the event-enrichment model, where the NCI
server processes an event, enriches it with data fetched from an external
database, and writes it back to the event source. This is a widely used
topology in real deployments. Figure 5(c) shows the
performance of TCC when each of the three machines has have 8 CPUs. The
x-axis is the service time ratio r of the database to the NCI server. The
database and the event source have the same mean service time. The y-axis
is the utilization of the bottleneck. The lowest utilization 85% occurs when
r=1, i.e., when the utilization levels of the three machines are identical.
Results in Figure 5
show that TCC can drive the bottleneck resource to high
utilization under different workloads and deployment topologies.
On the other hand, TCC may underutilize resources in
some cases, e.g., when processing
one event goes through a large number of servers whose utilization levels are
identical (i.e., r=1). To reduce resource waste in this worst case, one
might be tempted to make TCC more aggressive in adding threads. However, this
would also make TCC less friendly in resource sharing.
Below, we derive the conditions for friendly
resource sharing and demonstrate that, with a proper configuration, TCC
shares resources in a friendly manner with an uncontrolled
competing program. Moreover,
multiple instances of TCC also share resources in a friendly
manner. We begin our discussion with the basic two-NCI-server scenario.
Suppose two NCI servers independently execute TCC. If each server has its own
internal bottleneck that limits its throughput, TCC will independently drive
each server to almost full utilization. A more challenging case is that a
shared bottleneck resource limits the throughput of both NCI servers, e.g., a
shared database. Below, we will show that, when the shared bottleneck is
saturated, the two NCI servers take turns to reduce their
threads until the bottleneck resource is relieved of saturation.
Suppose the bottleneck resource is fully saturated, two NCI servers X and
Y are identical, and they currently run x0 and y0 threads,
respectively, where x0 � y0. A TCC tuning cycle consists of the tuning
steps starting from the base state and finally settling in the steady state.
We use i to number TCC's tuning cycles in increasing order, and assume X
and Y take turns to execute in the tuning cycles, i.e., if X executes in
cycle i, then Y will execute in cycle i+1. Let xi and
yi denote the numbers of X and Y's threads at the end of tuning cycle
i.
Theorem 1
If TCC's parameters p, q, and w satisfy Equations (1)
and (2) below,
then X and Y will take turns to reduce their threads
(i.e., y0 > x1 > y2 > x3 �)
until the bottleneck is relieved of saturation.
q
>
p(p+1)
p+2
(1)
w
�
1 - (
p
q
-1)2
(2)
Moreover, if TCC's parameters satisfy (1) and (2), a TCC
instance shares resources with an external competing program in a friendly
manner.
Proof sketch:
Suppose X is in the process of tuning its configuration, and just
finished increasing its threads from [x/(1+p)] to x. When X uses
x threads to compete with Y's y0 threads, X's throughput is f(x,y0) = [x/(x+y0)] C, where C is the maximum throughput of the
bottleneck. TCC keeps adding threads so long as every p%
increase in threads improves throughput by q% or more.
Therefore, X continues to add more threads if and only if
f(x, y0)
f(
x
1+p
, y0)
� 1 + q ,
(3)
which is equivalent to
x � ([p/q] - 1) y0.
Let [^y] denote the upper bound of this condition:
^
y
= (
p
q
- 1)y0 .
(4)
Suppose X runs no more than [^y] threads in the base
state. (This assumption holds if (2) holds.)
X keeps adding threads so long as its current number of threads is no more
than [^y]. Hence, when X stops adding threads, its final number
x1 of threads falls into the range
^
y
< x1 � (1+p)
^
y
.
(5)
X ends up with fewer threads than Y if (1+p)[^y] < y0.
From (4), this condition is equivalent to (1).
When X uses x1 threads to compete with Y's y0
threads, X's share of the
bottleneck is bounded by
Now suppose Y executes TCC after X settles with x1
threads. Y first reduces its threads by w% in the base state.
Following (4), we define
^
x
= (
p
q
-1) x1 .
(7)
If Y's base state has no more than [^x] threads, i.e., if
(1-w)y0 �
^
x
,
(8)
then we can follow (5) to obtain the bound of Y's final
number y2 of threads when Y stops adding threads:
^
x
< y2 � (1+p)
^
x
.
(9)
From (4), (5), and (7), we know that
(8) holds if (2) holds.
TCC's default parameters are p=25%, q=14%, and w=39%, which satisfy
(1) and (2).
Therefore, it follows from (5)
and (9) that y0 > x1 > y2. This reduction in
threads continues as X and Y repeatedly execute TCC, until the bottleneck
is relieved of saturation.
Following the approach above, one can also show that TCC shares resources in a
friendly manner with an external competing program that generates a constant
workload at the shared bottleneck resource. In the face of competition, TCC
dynamically adjusts the number of processing threads so that it consumes
about 4449% of the bottleneck resource. This range is obtained by
substituting the default parameters (p=25% and q=14%)
into (6). By contrast, if one uses a configuration that does not
satisfy (1), TCC's consumption of
the bottleneck resource could be unfairly high, e.g., reaching
8083% for the configuration p=25% and q=5%.
The analysis above focuses on the base state and the add-thread state. The
remove-thread state removes threads to avoid saturation, which makes TCC even
more friendly in resource sharing. Therefore, Theorem 1
holds if the remove-thread state is taken into account.
\blacksquare
With a proper configuration, a TCC instance shares resources
in a friendly manner with an external
competing program, and two TCC instances also share
resources in a friendly manner. Three or more instances of TCC share
resources in a friendly manner only if they execute in a loosely synchronized
fashion, i.e., they move out of the steady state into the base state roughly
at the same time. When the shared bottleneck is saturated and multiple TCC
instances attempt to add threads at the same time, they will observe
little improvement in throughput and gradually remove threads until the
bottleneck is relieved of saturation. A detailed analysis is omitted here.
In an NCI cluster, the master can serve as the coordinator to enforce loose
synchronization. Using loosely synchronized execution to enforce friendly
resource sharing has also been proposed in Tri-S [27], although
its application domain is TCP congestion control.
TCC repeatedly adds threads so long as every p% increase in threads
improves throughput by q% or more. Let C1 and C2 denote the
configurations before and after adding the p% threads, respectively. (This
section uses the add-thread state as example. The remove-thread state can be
analyzed similarly.) In a noisy environment, throughput is a stochastic
process and accurate measurement is challenging. On the one hand, the
throughput of a configuration can be measured more accurately if TCC stays in
that configuration longer and takes more measurement samples. On the other
hand, we want to minimize the measurement time so that TCC responds to
workload changes quickly.
We formulate the issue of accurate performance measurement as an optimization
problem. The optimization goal is to minimize the total number of samples
collected from configurations C1 and C2, and the constraint is to ensure
a high probability of making a correct control decision.
It turns out that the number of samples needed to make a reliable decision is
proportional to the variance of event-processing time (i.e., more samples are
needed if the system is volatile), and inversely proportional to the
throughput improvement threshold q (i.e., more samples are needed if we want
to tell even a small performance difference between two configurations).
Below, we present our statistical approach for performance measurement, our
method for handling unstable event arrival rate, and our heuristic for
filtering out large noises
caused by extreme activities such as Java garbage collection.
We use subscript i to differentiate the two configurations Ci, i=1,2.
For configuration Ci, let random variable Xi denote the inter-departure
time between the completion of event processing. Denote mi and
si2 the mean and variance of Xi. Suppose we take ni samples of
Xi, denoted as Xij, 1 � j � ni, and these samples are
independent and identically distributed.
Denote [`(Xi)] the
sample mean of Xij.
According to the central limit theorem,
regardless of the distribution of Xi,
[`(Xi)] is approximately normally distributed, [`(Xi)] ~ N(mi, si2/ni).
Let Y=[`(X1)]-[`(X2)],
which represents the performance difference between C1 and C2.
Assuming [`(X1)] and [`(X2)] are independent,
Y is also approximately normally distributed,
Y ~ N(my, sy), where
my
=
m1 - m2
(10)
sy2
=
s12
n1
+
s22
n2
.
(11)
The mean throughput of configuration
Ci is 1/mi. TCC continues to add threads if
the throughput ratio [1/(m2)] / [1/(m1)] � 1+q, where q
is the throughput improvement threshold.
Considering (10),
this is equivalent to
my � m�, where
m� =
q
1+q
m1.
(12)
We want to collect a minimum number of samples, n=n1+n2, so
that the variance sy2 in (11) is small enough
and we can state with high confidence either
Prob { Y � m�} � 1 - a or Prob { Y < m�} � 1 - a holds. Here 1-a is
the confidence level (0 < a < 0.5). However, in the worst case
when my=m�, both Prob{ Y � m�} and
Prob{ Y < m�} are always 0.5, no matter how many
samples we collect. This precludes us from deciding whether
C2 is significantly better than C1. We use an
indifference zone [L,H] to handle the case when my � m�.
L
=
(1-b/2) m�
(13)
H
=
(1+b/2) m�
(14)
Here b is a small constant, e.g., b=0.1.
Now we want to collect just enough samples so that
at least one of the two conditions below holds:
Prob { Y � L }
�
1 - a, or
(15)
Prob { Y � H }
�
1 - a .
(16)
TCC adds more threads if only (15) holds, or if both
(15) and (16) hold but Prob { Y � L } � Prob { Y � H }.
Let
Z ~ N(0,1),
and
Prob{ Z � Z1-a} = 1 -a. Combining (15) and (16), we have
sy �
1
Z1-a
max
(H - my , my -L) .
(17)
Combing (11) and (17), the problem
of minimizing the total number of measurement
samples can be formulated as the optimization
problem below.
Minimize
n = n1 + n2
Subject to
sy2 =
s12
n1
+
s22
n2
�
� �
�
max
(H - my, my -L)
Z1-a
� �
�
2
(18)
n1, n2
>
0
(19)
Solving this problem using Lagrange multipliers, we obtain the minimum number
of samples we need:
^
n
1
=
s1(s1+s2)
� �
�
Z1-a
max
(H - my, my -L)
� �
�
2
(20)
^
n
2
=
s2(s1+s2)
� �
�
Z1-a
max
(H - my, my -L)
� �
�
2
.
(21)
Both [^n]1 and [^n]2 have the largest value when
my =
H+L
2
= m�.
(22)
When collecting samples for C1, we have no data for C2 and hence my
is unknown. We have to make the conservative assumption in
(22). As C1 and C2 are close, we assume s1 � s2. With these assumptions, (20) is simplified as
(23) below. (Note that it is possible to run C1 and C2 back
and forth in an interleaving fashion in order to accurately estimate my
rather than conservatively using (22) for my, but
this would complicate TCC's state machine in Figure 3.)
^
n
1
= 8
� �
s1 Z1-a
H-L
� �
2
.
(23)
Finally, combining (12), (13),
(14), and
(23), we
have
^
n
1
= 2 Z1-a2
� �
1
b
� �
2
� �
1+
1
q
� �
2
� �
s1
m1
� �
2
.
(24)
The minimum number of samples for C2
can be derived from
(18) and (23):
^
n
2
=
(s2 Z1-a)2
� �
�
max
(H - my , my - L)
� �
�
2
-
(H-L)2
8
.
(25)
When collecting samples for C2, we have data for both C1 and C2, and
hence can estimate my from (10).
Our method does not rely on any assumption about the exact distribution of
Xi, but needs to estimate the mean mi and variance s2i, as
they are used in (24) and (25). TCC estimates
them by taking n*i initial samples from configuration Ci, and then
uses the sample mean m*i and sample variance S2i to replace
mi and s2i. In practice, we observe that sometimes the
event-processing engine experiences long pauses caused by extreme activities
such as Java garbage collection or startup of a heavy external program. For
example, on a fragmented large heap, Java garbage collection can take as long
as 20 seconds.
These
long pauses are not an inherent part of the variance in service time, but they
make the calculated sample variance S2i (and accordingly [^n]i)
unusually large.
We address this issue by filtering out abnormally large samples. Empirically,
we find that abnormal samples caused by long pauses are rare, and discarding
the top 1% largest samples is sufficient to filter them out.
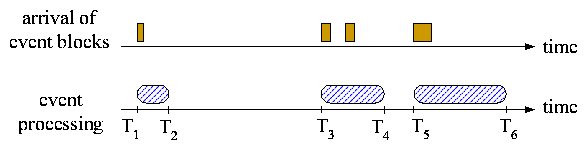
Another challenge is to handle the periodical, bulk-arrival pattern of IT
events.
After processing one block of
events, an NCI server remains idle until the next block arrives. TCC excludes
this idle time from throughput calculation (see
Figure 6), because the low throughput in this case is
caused by the lack of input events rather than by a sub-optimal thread
configuration.
Figure 6:
TCC excludes idle time from throughput calculation. Suppose n events are
processed in this example. The throughput is calculated as [n/((T2 -T1) + (T4-T3) + (T6-T5))] instead of [n/(T6 - T1)]. This method
discounts the influence of an unstable event arrival rate and helps TCC
operate robustly.
Recall that TCC reduces threads in the base state by w%, and then
repeatedly add threads so long as every p% increase in threads improves
throughput by q% or more. Now we put together the results in
Sections 3.2, 3.3, and 3.4 to guide
the selection of these parameters.
Equations (1) and (2) are the conditions for friendly
resource sharing.
Suppose p's value is already determined. Using queueing models such as
those in Figure 4, it can be shown that, relative to p, q
should be as small as possible in order to achieve maximum throughput.
Therefore, for a given p, we choose for q the smallest
value allowed by (1). Once p and q are determined, we
choose for w the smallest value allowed by (2), because a small
w keeps more threads in the base state and
allows TCC to finish an exploration cycle more quickly.
Table 1 lists the appropriate values of q and w for
different p.
p
10%
15%
20%
25%
30%
35%
40%
45%
50%
q
5.4%
8.2%
11.5%
14%
17%
20.5%
24%
27%
31%
w
28%
32%
33%
39%
42%
50%
56%
56%
63%
Table 1: Appropriate values of q and w for a given p.
The next step is to choose a configuration in Table 1. This
table as well as (1) and (2) shows that both q
and w increase as p increases. Equation (24) suggests
that a large q is preferred, because it allows TCC to make a control
decision with fewer measurement samples.
On the other hand, we prefer a small w, as it keeps more threads in the
base state.
Moreover, we prefer a moderate p,
because a large p has a higher risk of moving the system into
severe thrashing
in a single tuning step, whereas a
small p may require many tuning steps to settle in a new steady state
after a workload change. To strike a balance between all these
requirements, we choose (p=25%, q=14%, w=39%) as our default
configuration.
In the remove-thread state, TCC repeatedly removes r% threads until the
throughput becomes a certain fraction (e.g., 95%) of the maximum throughput
achieved during a tuning cycle. The remove-thread state does fine tuning and
we use r=10% by default.
We have implemented TCC in Java and integrated it with
IBM Tivoli
Netcool/Impact [16]. We have evaluated TCC under a wide range
of workloads.
Experiments demonstrate that an NCI cluster
is scalable, and TCC can handle various types of bottleneck resources.
We also compare TCC with revised versions of TCP Vegas [4].
Unless otherwise noted, each machine used in the experiments has 5GB memory
and two 2.33GHz Intel Xeon CPUs, running Linux 2.6.9. All the machines are
hosted in an IBM BladeCenter,
where the network round-trip time
is only 90ms. The network delay of a large enterprise's IT
environment can be much longer, e.g., varying from 1ms to 100ms when the
database with customer profiles is managed at a central remote site for
security reasons.
To evaluate the effect of network delay, in some experiments, the messages
between two machines go through a software router that allows us to introduce
message delays in a controlled manner.
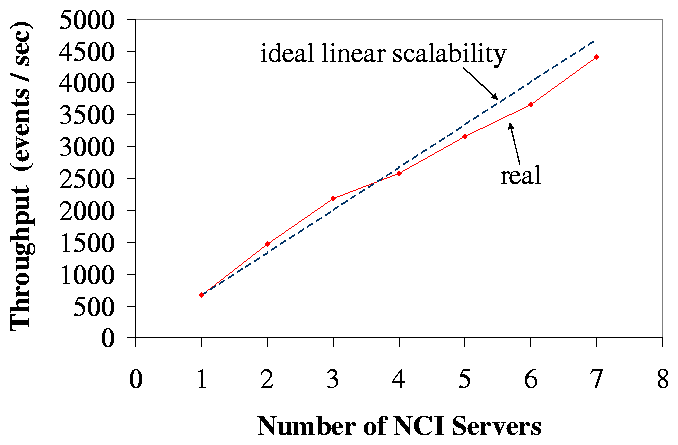
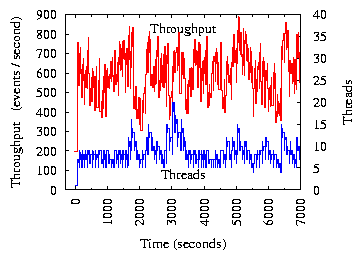
Figure 7 shows the scalability of an NCI cluster running TCC,
when executing an event-enrichment policy that is widely used in real
deployments. The topology of this experiment is shown in
Figure 4(c). The event source is Netcool/OMNIbus ObjectServer
7.1 [15]. We developed a tool to automatically feed IT events to
ObjectServer, from which the master NCI server fetches events. The external
database is MySQL 4.1.12. When processing one event, an NCI server does some
local analysis, fetches service contextual information from MySQL, adds it
into the event, and finally writes the enriched event back to ObjectServer.
In this setup, MySQL caches all data in memory and
NCI servers are the bottleneck.
In Figure 7, the NCI cluster shows almost linear scalability,
because the NCI servers fetch events in batches, and the slave NCI servers
directly retrieve data from MySQL and write events back to ObjectServer
without going the master. In addition, the linear scalability is also due to
another
algorithm we designed to dynamically regulate the event-fetching rate
and event batch size so that the event-processing pipeline moves smoothly
without stall. This feature is
beyond the scope of this paper.
In the rest of the experiments, we study the detailed behavior of TCC. These
experiments use the event-escalation topology in Figure 4(b), in
which the NCI server processes an event and then invokes an external program
through its HTTP/XML interface for further processing. Below, we simply refer
to this external program as the "Web application" and its hosting machine as
the "Web machine." The IPL script executed by the NCI server is specially
designed so that we can control its service time on the NCI server.
Similarly, the service time of the Web application can also be controlled.
Both service times follow a Pareto distribution p(x) = k[(Ck)/(xk+1)], where k=2.5. We adjust C to control the
service time.
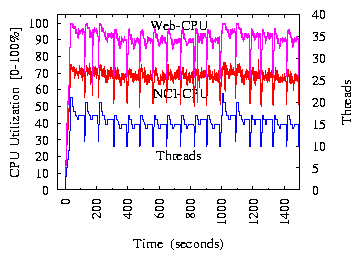
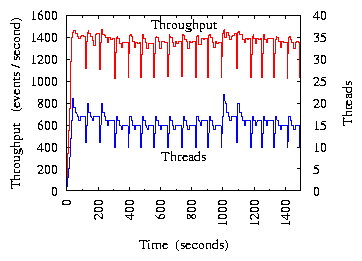
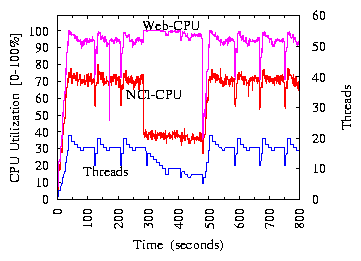
(a) CPU Utilization
(b) Throughput
Figure 8:
The Web machine's CPU is the bottleneck.
Figure 8(a) shows the CPU utilization ("NCI-CPU" and
"Web-CPU") and the number of threads in an experiment where one NCI server
works with the Web application. The x-axis is the wall clock time since the
experiment starts. In real deployments, after processing one block of events,
the NCI server remains idle until the next block arrives. This experiment
generates IT events in such a way that the NCI server never becomes idle.
Otherwise, the CPU utilization would drop to 0 during repeated
idle time, making the figure completely cluttered. We conducted separate
experiments to verify that the idle time between event blocks does not change
TCC's behavior, because TCC excludes the idle time from
throughput calculation (see Figure 6).
In this experiment, the mean service time is 1ms for NCI and 1.3ms for the
Web application. (Note that the actual
service times are random variables rather
than constants.) Therefore, the Web machine is the bottleneck. The messages
between the NCI server and the Web application go through the software router,
which adds about 5ms delay in round trip time. The curves show periodical
patterns. Each period is a complete tuning cycle during which TCC starts
from the base state and eventually moves back to the steady state. In real
deployments, TCC operates in the steady state for a relatively long period of
time before it starts the next round of exploration. In this experiment, TCC
is configured to stay in the steady state for only about 50 seconds.
Otherwise, the curves would be mostly flat.
During the first tuning cycle in Figure 8(a), TCC
exponentially increases the number of threads.
At time 85 seconds, it moves into the steady state for the first
time with 17 threads. During latter tuning cycles, the steady-state threads
vary between 15 and 17. This oscillation is due to noisy measurement data.
Regardless, TCC avoids saturating the bottleneck resource, and the Web
machine's CPU utilization stays around 90%.
Figure 8(b) shows event-processing throughput, which
closely follows CPU utilization in Figure 8(a). This is
because throughput is proportional to the utilization of the bottleneck
resource (i.e., CPU in this experiment). Due to space limitation, below we
omit throughput figures and focus on bottleneck resource utilization.
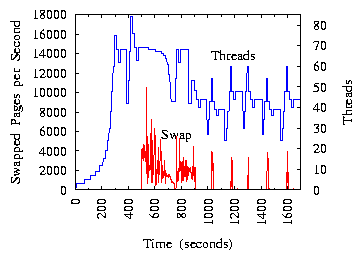
The experiment in Figure 9 evaluates how TCC works with
memory bottleneck and how it recovers from
memory thrashing. This experiment uses
machines with relatively more CPUs and less memory in order to trigger memory
thrashing-each machine has eight 3.2GHz Intel Xeon CPUs and 1GB memory. The
mean service time is 8ms for NCI and 1ms for the Web application. The message
delay is set to 50ms. Initially, the NCI server's CPU is the bottleneck, and
TCC uses 69 threads in the steady state to drive its utilization to 95%.
At time 496 seconds, the NCI server starts to invoke another API of the Web
application, which consumes a large amount of memory on the Web machine. In
total, 69 concurrent threads consume more than 1GB physical memory and
immediately drive the Web machine into memory thrashing.
Figure 9 reports the Web machine's page swaps
monitored through /proc/vmstat. At time 496 seconds, the free memory drops
sharply from 934MB to 19MB, page swaps increase from 0 to 4,000 pages/second,
and the event-processing
throughput drops from 1,011 events/second to 58 events/second. TCC
detects this radical throughput change and restarts thread exploration. By
time 945 seconds, TCC reduces steady-state threads down to 44. The Web
machine becomes completely free of page swapping, its free memory rises to
106MB, and the throughput increases to 625 events/second. The tuning cycles
are relatively long because the throughput is extremely low during memory
thrashing and TCC needs time to collect samples.
After time 1,000 seconds, when TCC periodically re-explores new thread
configurations, it increases the number of threads beyond 50, and causes page
swapping to happen again (see the repeated spikes on the "Swap" curve after
time 1,000 seconds).
TCC observes that adding threads actually decreases
throughput. It then removes threads and avoids thrashing.
This experiment demonstrates that TCC can not only recover from memory
thrashing but also avoids moving into thrashing.
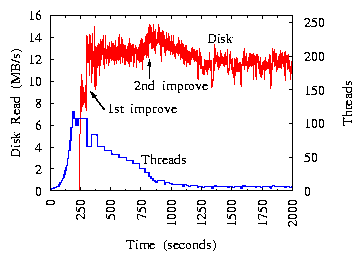
Figure 10:
The Web machine's disk is the bottleneck. Removing threads actually improves
disk throughput.
The experiment in Figure 10 evaluates how TCC works with a disk
bottleneck. Each machine used in this experiment has eight CPUs. The mean
service time is 1ms for NCI and 2ms for the Web application. The message delay
is set to 20ms. Initially, the Web machine's CPU is the bottleneck, and TCC
uses 107 threads in the steady state to drive its utilization to 95%.
At time 247 seconds, the NCI server starts to invoke another API of the Web
application, which performs random search in a 60GB on-disk database. Now the
bottleneck shifts to the Web machine's disk. The
Web machine's CPU utilization drops from
95% to 5%, while the amount of data read from disk (monitored through
/proc/diskstats) increases from 0 to 9MB/s. At time 305 seconds, TCC
enters the base state and reduces threads from 107 to 66. With fewer threads,
the disk throughput actually increases from 9MB/s to 12.5MB/s ("1st
improve" in the figure). Note that the disk throughput is proportional to
the event-processing throughput. When TCC reduces the number of threads down
to 22 at time 816 seconds, the disk throughput further increases to 14MB/s
("2nd improve" in the figure). TCC continues to remove threads to
avoid saturation. Eventually it stabilizes around 7 threads in the steady
state, and the Web machine's CPU utilization is only 1.5%.
This experiment demonstrates that TCC can radically remove
unnecessary threads (from 107 down to 7) when disk is the bottleneck, and disk
can actually achieve higher throughput with fewer threads.
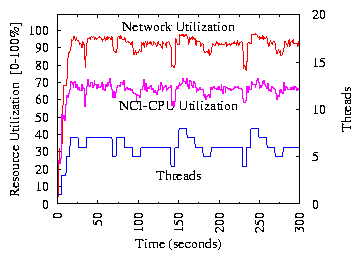
For the experiment in Figure 11,
the NCI server exchanges a
large amount of data with the Web application when processing events. The
mean service time is 1.5ms for NCI and 1ms for the Web application. There is
no extra message delay between machines. The NCI server has higher CPU
utilization than the Web machine, but the bottleneck of the whole system is
network. Even if CPUs are still underutilized, TCC stops adding threads
when the network bandwidth utilization reaches around 92%. Note that TCC
works by observing changes in event-processing throughput, without even
knowing which resource is actually the bottleneck.
Figure 12:
An external program competes for the bottleneck resource, which is the Web
machine's CPU.
The experiment in Figure 12 evaluates TCC's response to an
external program that competes for the bottleneck resource. The mean service
time is 1ms for NCI and 1.3ms for the Web application. The Web machine is
the bottleneck. The message delay is set to 5ms. At time 286 seconds, an
external program is started on the Web machine to compete for CPU.
During the tuning cycle between time 293 and 368 seconds, TCC reduces
steady-state threads from 17 to 10, and the Web
machine is relieved of 100% saturation starting from time 341 seconds. The
tuning cycle between time 406 and 441 seconds further reduces steady-state
threads from 10 to 8. The external program terminates at time 477 seconds,
and the Web machine's CPU utilization drops sharply from 95% to 49%.
During the following tuning cycle between time 483 and 553 seconds, TCC
quickly increases steady-state threads from 8 to 17, and drives the Web
machine's CPU utilization back to 95%. This experiment demonstrates that TCC
shares resources with a competing program in a friendly manner,
and responds quickly
when the bottleneck's available capacity increases.
Figure 13:
Two competing NCI servers work with the Web application.
The latter is the shared bottleneck.
The experiment in Figure 13 runs two NCI servers to share
the Web application. The mean service time is 1ms for NCI and 1.5ms for the
Web application. The Web application is the shared bottleneck that limits the
throughput of both NCI servers.
This experiment introduces no extra message delays between machines.
Server X starts first and quickly drives the throughput to as high as
1,100 events/second
(see the throughput spike around time 0). After server Y starts,
X and Y
share the bottleneck resource in a friendly manner. Their throughput oscillates around
550 events/second and their steady state oscillates around 8 threads.
Sometimes one server mistakenly increases its threads beyond its fair share
(due to noisy measurement data), which causes the other server to also
increase its threads in order to get its fair share (see the thread
spikes around
time 3,000 seconds). However, the friendly resource
sharing logic built in TCC ensures
that the competition does not escalate, and they gradually reduce their
threads back to the normal level.
To our knowledge, no existing controllers are
designed to maximize the throughput of general distributed systems
while not saturating the bottleneck resource. The
closest to TCC is TCP Vegas' congestion avoidance algorithm [4].
It computes the difference D between the actual throughput and the expected
throughput, and increases the concurrency level if D is small, or decreases
the concurrency level if D is large. The expected throughput is calculated
as the product of the concurrency level and a baseline throughput. The
baseline throughput is defined as the throughput achieved when the concurrency
level is one and the network is completely free of cross traffic. A key
challenge is to estimate the baseline throughput when cross traffic exists.
TCP Vegas is designed for and works well in the network domain, but it
critically relies on an assumption that does not hold in general distributed
systems-it assumes a processing unit's service time is constant. Because of
this assumption, TCP Vegas can use [1/minRTT] to approximate the
baseline throughput, where minRTT is the minimum round trip time of packets.
By contrast, the service time of a server in a general distributed system is
inherently a stochastic process. For instance, the service time of a database
query may vary over time, depending on the size of the database and the cache
status. As a result, the actual baseline throughput for a general distributed
system can be much lower than [1/minRTT].
A complete redesign of TCP Vegas to work for general distributed systems would
require (1) a method to estimate the baseline throughput when servers' service
times are stochastic processes and there exists cross traffic; (2) proving
that the new algorithm shares resources with uncontrolled competing
programs in a friendly manner; and (3) demonstrating that the new algorithm can achieve high
resource utilization under typical topologies of distributed systems. The
first task is especially challenging, and our initial study suggests that a
satisfactory solution might not exist at all. We leave it as
future work.
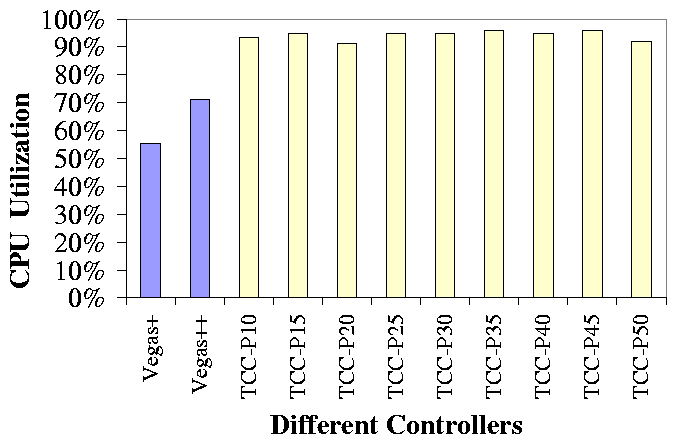
Figure 14:
Comparison of different controllers.
In Figure 14, "Vegas+" is our revised version of TCP Vegas.
It runs in NCI at the application layer, and controls the number of event
processing threads. It adjusts the concurrency level after measuring a stable
throughput. In Vegas+, minRTT is the minimum response time of event
processing. In this experiment, the mean service time is 1ms for NCI and 2ms
for the Web application. The network delay is set to 25ms. The Web machine is
the bottleneck, and Vegas+ can only drives its CPU utilization to 55%.
Vegas++ in Figure 14 is an enhanced version of Vegas+. It uses
an accurate baseline throughput measured offline in a controlled environment
that is free of cross traffic. Vegas++ is not a practical online algorithm,
but we use it to study the potential of TCP Vegas. Vegas++ improves the
utilization of the bottleneck from 55% to 70%, which is still far from
ideal. Vegas+ and Vegas++ use the parameters of TCP Vegas as recommended
in [21]. The resource utilization may be improved by tuning
these parameters, but the challenge is to prove that, with the new parameters,
the algorithm is still friendly in resource sharing.
Vegas+ and Vegas++ are not full redesigns of TCP Vegas, as they do not solve
the three challenging redesign tasks described above.
Our initial study suggests that those tasks might not have a satisfactory
solution at all.
Here we use Vegas+ and Vegas++ to emphasize that the problem TCC
solves is challenging, and no prior solutions can be easily adapted to solve
the problem.
The other bars in Figure 14 show the performance of TCC under
different configurations in Table 1 of
Section 3.5. For instance, TCC-P25 is TCC's default
configuration (p=25%, q=14%, w=39%), and TCC-P10 is (p=10%,
q=5.4%, w=28%). With the different configurations, TCC consistently
drives the bottleneck resource utilization to 90-95%, showing that our
guidelines in Section 3.5 for choosing TCC parameters are
effective. Moreover, our guidelines ensure that TCC with these configurations
is friendly in resource sharing.
Performance control has been studied extensively for many applications,
including Web server [28], search
engine [2], storage [18], and
scientific applications [25].
To our knowledge, no existing work uses a black-box approach to maximize the
throughput of general distributed systems while trying to avoid saturating the
bottleneck resource.
TCP Vegas [4] is the
closest to our algorithm, and a detailed discussion is provided in
Section 4.8.
Most existing algorithms [2,23,28]
use a manually-configured and system-dependent response time threshold to
guide performance control. If the threshold is set too high, the system will
be fully saturated; if the threshold is set too low, the system will be
underutilized.
We broadly classify existing controllers into four categories.
Each category has an enormous body of related work, and we only review some
representative ones.
The first category considers performance optimization as a search problem in a
multi-dimensional parameter space. For instance, Active
Harmony [25] uses the simplex method to perform the
search.
Existing methods of this category aggressively maximize performance without
considering resource contention with an uncontrolled external program.
Moreover, running multiple instances of the controller
may result in severe resource saturation as each controller instance attempts
to consume 100% of the shared bottleneck resource.
The second category uses classical control theory [13]
to regulate performance. It requires the administrator to manually set a
performance reference point. The system then adjusts itself to stabilize
around this reference point. If we apply this method to Netcool/Impact, the
reference point would be achieving 90% bottleneck resource utilization.
However, a straightforward implementation would require Netcool/Impact to
monitor the resource consumptions of all third-party external programs working
with Netcool/Impact, which is impractical in real deployments because of the
diversity and proprietary nature of the third-party programs. Moreover,
existing methods of this category are not sufficiently "black-box" and
require information not available
in Netcool/Impact deployment environments. For
example, Triage [18] assumes knowledge of every
resource-competing application's service-level objectives, and the method
in [24] assumes knowledge of every component's performance
characteristics obtained from offline profiling.
The third category uses queueing theory [12] to model
a system with a fixed topology, and takes actions according to
predictions given by the model.
For instance, Pacifici et al. [23] use
online profiling to train a machine-repairman model, which is used
to guide flow control and service differentiation.
The fourth category includes various heuristic methods.
SEDA [28] adjusts admission rate based on the
difference between the 90-percentile response time and a manually-set target.
Like TCP Vegas, Tri-S [27] is also designed for TCP congestion
control and requires estimating a baseline throughput.
MS Manners [9] regulates low-importance processes and
allows them to run only if the system resources would be idle otherwise. It
also needs to establish a baseline progress rate.
We presented TCC, a performance controller for high-volume
non-interactive systems, where processing tasks are generated automatically in
high volume by software tools rather than by interactive users, e.g.,
streaming event processing and index update in search engines.
TCC takes a black-box approach to maximize throughput while trying to avoid
saturating the bottleneck resource.
We used analysis to guide the selection of its parameters, and
designed a statistical method to minimize measurement samples needed for making
control decisions. We implemented TCC and integrated it with IBM Tivoli
Netcool/Impact [16]. Experiments demonstrate that TCC
performs robustly under a wide range of workloads. TCC is flexible as it
makes few assumptions about the operating environment. It may be applied to a
large class of throughput-centric applications.
Acknowledgments
We thank Zhenghua Fu, Yaoping Ruan, other members of the Netcool/Impact team,
the anonymous reviewers, and our shepherd Edward Lazowska for their valuable
feedback.
L. Bouillon and J. Vanderdonckt.
Retargeting of Web Pages to Other Computing Platforms with VAQUITA.
In The Ninth Working Conference on Reverse Engineering
(WCRE'02), pages 339-348, 2002.
A. Chervenak, I. Foster, C. Kesselman, C. Salisbury, and S. Tuecke.
The data grid: Towards an architecture for the distributed
management and analysis of large scientific datasets.
Journal of Network and Computer Applications, 23(3):187-200,
2000.
R. Collins, A. Lipton, T. Kanade, H. Fujiyoshi, D. Duggins, Y. Tsin,
D. Tolliver, N. Enomoto, and O. Hasegawa.
A System for Video Surveillance and Monitoring.
Technical Report CMU-RI-TR-00-12, Robotics Institute, Carnegie Mellon
University, 2000.
M. Karlsson, C. Karamanolis, and X. Zhu.
Triage: Performance differentiation for storage systems using
adaptive control.
ACM Transactions on Storage, 1(4):457-480, November 2005.
A. Mainwaring, D. Culler, J. Polastre, R. Szewczyk, and J. Anderson.
Wireless Sensor Networks for Habitat Monitoring.
In Int'l Workshop on Wireless Sensor Networks and Applications,
pages 88-97, 2002.
G. Pacifici, W. Segmuller, M. Spreitzer, M. Steinder, A. Tantawi, and
I. Whalley.
Managing the Response Time for Multi-tiered Web Applications.
Technical Report RC23942, IBM Research, 2006.
P. Padala, K. G. Shin, X. Zhu, M. Uysal, Z. Wang, S. Singhal, A. Merchant, and
K. Salem.
Adaptive control of virtualized resources in utility computing
environments.
In EuroSys, pages 289-302, 2007.
Z. Wang and J. Crowcroft.
A new congestion control scheme: slow start and search (Tri-S).
ACM SIGCOMM Computer Communication Review, 21(1):32-43, 1991.