Remote Profiling of
Resource Constraints of Web Servers Using
|
Unexpected surges in Web request traffic can exercise server-side resources (e.g., access bandwidth, processing, storage etc.) in undesirable ways. Administrators today do not have requisite tools to understand the impact of such “flash crowds” on their servers. Most Web servers either rely on over-provisioning and admission control, or use potentially expensive solutions like CDNs, to ensure high availability in the face of flash crowds. A more fine-grained understanding of the performance of individual server resources under emulated but realistic and controlled flash crowd-like conditions can aid administrators to make more efficient resource management decisions. In this paper, we present mini-flash crowds (MFC) – a light-weight profiling service that reveals resource bottlenecks in a Web server infrastructure. MFC uses a set of controlled probes where an increasing number of distributed clients make synchronized requests that exercise specific resources or portions of a remote Web server. We carried out controlled lab-based tests and experiments in collaboration with operators of production servers. We show that our approach can faithfully track the impact of request loads on different server resources and provide useful insights to server operators on the constraints of different components of their infrastructure. We also present results from a measurement study of the provisioning of several hundred popular Web servers, a few hundred Web servers of startup companies, and about hundred phishing servers.
As Web-based applications on the Internet grow in popularity, their providers face the key challenge of determining how to provision server-side resources to provide consistently good response time to users. Ideally, these resources, such as processing and memory capacity, database and storage, and access bandwidth, should be provisioned to deliver satisfactory performance under a broad range of operating conditions. Since an operator's ability to predict the volume and mix of requests is often limited, this can be difficult. Hence, large providers who can afford it typically resort to over-provisioning, or employ techniques such as distributed content delivery or dynamic server provisioning, to minimize the impact of unexpected surges in request traffic. Smaller application providers may trade-off robustness to large variations in workload for a less expensive infrastructure that is provisioned for the expected common case.
This approach still leaves operators without a sense of how their application infrastructure will handle large increases in traffic, due to planned events such as annual sales or Web casts, or unexpected flash crowds. While these events may not occur frequently, the inability of the infrastructure to maintain reasonably good service, or at least degrade gracefully, can lead to significant loss of revenue and dissatisfied users. Without comprehensive stress testing that would likely disrupt service, there is no way for providers today to observe the performance of their sites under heavy load in a controlled way to inform their preparation for unexpected traffic increases.
In this paper, we present the design, implementation and evaluation of a new profiling service that helps operators better understand the ability of their Internet applications to withstand increased request load. Our miniflash crowd (MFC) mechanism sheds light on bottlenecks in the application infrastructure by quantifying the number and type of simultaneous requests that affect response time by taxing different parts of the server set-up. Using the service, an application provider can compare the impact of an increase in database-intensive requests versus an increase in bandwidth-intensive requests. The operator could then make better decisions in prioritizing additional provisioning, or take other actions (e.g., introduce request shaping).
The MFC technique is based on a phased set of simple, controlled probes in which an increasing number of clients distributed across the wide-area Internet make synchronized requests to a remote application server. These requests attempt to exercise a particular part of the infrastructure such as network access sub-system, storage sub-system, or back-end data processing subsystem. As the number of synchronized clients increases, one or more of these resources may become stressed, leading to a small, but discernible and persistent, rise in the response time. Inferences can now be made about the relative provisioning of the resources. The number of clients making simultaneous requests is increased only up to a set maximum – if no change in the response time is observed, we label the application infrastructure as unconstrained. Such a conservative approach allows MFC to reveal resource constraints while limiting its intrusiveness on the tested sites.
The MFC technique can be thought of as a “black-box” approach for determining the resource limitations of a Web server, or for uncovering performance glitches, vulnerabilities, and configuration errors. The salient features of the approach are: (i) light-weight requests that have minimal impact on, and involvement from, production servers; (ii) use of real, distributed clients that test the deployed application infrastructure while accurately reflecting client access bandwidth and the effects of wide-area network conditions; and (iii) ability to work with a broad range of Web applications with little or no modification, while providing some tunability to run more application-specific tests.
We validate the effectiveness of MFC in tracking server response times using synthetically generated response time curves (i.e., as a function of the request load). We also study the ability of MFC to exercise specific server resources by running experiments against a real Web application in a controlled lab setting.
Beyond the MFC technique itself, a principal contribution of the paper is an application of the MFC service to a top-50 ranked commercial site and three university sites with the active cooperation of the site operators. The operators gave us the server logs for the experiments – we ascertained that MFC requests were well-synchronized and studied the impact of background traffic on MFC. The operators confirmed MFC's non-intrusive nature and found it very useful in uncovering new (or confirming suspected) issues with their infrastructure.
The lab-based experiments and experiments on cooperating sites demonstrate the usefulness of applying MFCs to production Web applications. They also show that the granularity of information that black-box testing can reveal is limited. MFCs are able to isolate resource constraints at a “sub-system” level, such as the storage subsystem and database access subsystem, which includes both hardware and software components of the sub-systems. However, providing finer-grained information to pinpoint if the constraint is due to a hardware limitation or software misconfiguration within the subsystem is difficult. This may require operator input and some site-specific changes to the MFC approach.
We also applied MFC to characterize a large number of production Web sites, classified according to their assigned ranking by a popular Web rating service [19]. Our empirical results show a high degree of correlation between a site's popularity and it's ability to handle a surge of either static, or database-intensive requests. Bandwidth provisioning is less well-correlated, however, with many less-popular sites having better provisioned access bandwidth than might be expected. Finally, we also present a preliminary study of the application of MFCs to other special classes of Web sites, including startup companies and sites belonging to phishers.
Although our initial application of MFCs focuses on determining how unexpected request surges affect perceived client performance, the approach can be useful in a number of other scenarios. MFCs could be used to perform comparative evaluations of alternate application deployment configurations, e.g., using different hosting providers. By tuning the request arrival pattern of clients, MFCs can be used to evaluate the impact of different request shaping mechanisms.
Section 2 describes the MFC design and implementation, and several practical issues. In Section 3, we discuss our validation study. We report on our experience running MFC with cooperating commercial and academic sites in Section 4. We describe the results of a large-scale study of production sites in Section 5. In Section 6, we discuss some extensions to MFC. We discuss related work in Section 7 and conclude in Section 8.
In this section, we describe the design and implementation of the Mini-Flash Crowd (MFC) approach. First, we discuss the key design requirements and the challenges in meeting these requirements. We then present an overview of MFC's operation. Finally, we discuss implementation details and key practical issues.
Our goal is to develop a mechanism that gives application providers useful information about the limitations of their server resources. The foremost requirement from such a mechanism is that it should accurately reflect the application's performance under realistic load conditions; i.e., the information should be representative of a real flash-crowd like situation. While laboratory load testing is no doubt useful, it is difficult to re-create all of the dependencies of an Internet-facing live deployment in the lab. Traditional benchmarking approaches or load generation tools (e.g., [24]) used to test Web applications in controlled LAN settings cannot reveal effects of wide-area conditions or characteristics of the actual Internet connectivity of the clients (e.g., speed, location, diversity etc.). More importantly, such laboratory-based experiments cannot help operators assess the impact of access infrastructure - e.g., how the bandwidth limits the performance of clients under overload, and how bandwidth-imposed constraints compare against constraints on other server-side resources.
Second, the mechanism must be tunable to tailor the characterization to specific operational goals. Some applications (e.g., software binary distribution) may be tolerant to large increases in response time. Others may be more sensitive to small increases in response time; for instance, it may be important to know that a 10% increase in volume of search queries caused a search engine's response time to increase by 250ms.
Finally, the approach must be automatic. It must require minimal (if any) input from operators about the specifics of the application and infrastructure. This requirement is crucial to deploy MFC as a generic network service that any content provider can sign up for and use. This requirement can be relaxed when server operators cooperate in running experiments.
The above requirements raise two challenges. First, it is challenging to develop a generic request workload that can remotely exercise specific resources or sub-systems on production server infrastructures. Second, it is difficult to exercise tight control on the load imposed on the application infrastructure so as to not cause an undesirable impact on the regular request workload at the server. Such tight control is particularly difficult to achieve when using a set of distributed clients whose requests may be affected unpredictably by the wide-area.
We use two simple insights to address these challenges. First, to exercise specific server resources, we issue concurrent requests for a particular type of content. For example, to exercise a server's network connection, we can make concurrent requests for “large” objects hosted at the server (e.g., binary executables, movie files). As we show later, this simple approach can help us isolate the impact to the granularity of server sub-systems, which include both hardware and software components of the sub-systems. To minimize the need for server-side input and to ensure generality of the approach, we crawl the content hosted on the server and automatically classify it into different content categories, using heuristics such as file name extensions and file sizes. Second, to achieve tight control over the load on the server sub-systems, we schedule client requests in a centrally coordinated manner using measurements of the network delay between each client and the target server.
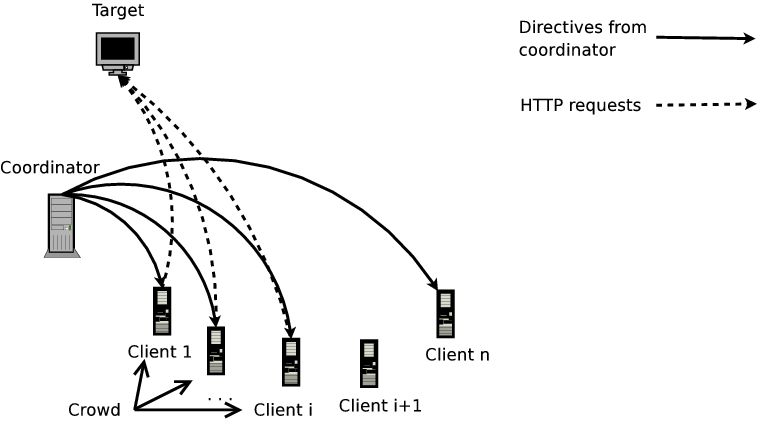
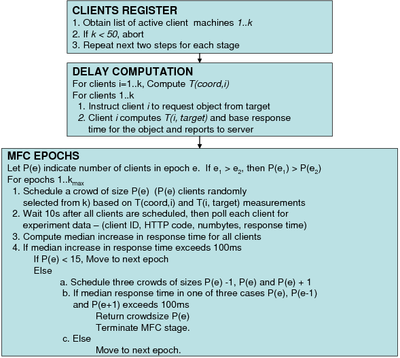
The MFC setup has a single coordinator orchestrating an MFC on a target server (Figure 1). At the coordinator's command, a specified number of participating clients send synchronized requests to the target server. The clients log the response times for their requests and send this information to the coordinator. The coordinator uses the feedback from clients to determine how to run the MFC, to infer resource constraints, and to stop the MFC. The MFC experiment consists of an optional profiling step followed by several probing or measurement phases.
The profiling stage precedes an MFC run against a non-cooperating server, and is optional for cooperating servers. In this stage, the coordinator crawls the target site and classifies the objects discovered into a number of classes based on content-type, for example, regular/text (txt, HTML files), binaries (e.g., .pdf, .exe, .tar.gz files), images (e.g., .gif, .jpg files), and queries.
The discovered objects are also classified into two categories based on the reported object sizes (obtained by issuing a HEAD request for files and GET request for queries): Large Objects and Small Queries. These categories are selected for their expected impact on specific server resources or sub-systems (more details below).
The Large Objects group contains regular files, binaries, and images greater than 100KB in size. We identify URLs that appear to generate dynamic responses (queries) and select queries that generate a response under 15KB. These constitute the Small Queries group. Note that a small query is not necessarily a “form”, but an URL with a “?” indicating a CGI script.
After the profiling step is completed, the coordinator runs the MFC experiment in stages. In each stage, the MFC makes a varying number of synchronized requests for objects from a specific request category.
In the Large Object stage, clients request the same large object simultaneously, primarily exercising the server's network access bandwidth. We use a fairly large lower bound (100KB) on the size of the Large Object to allow TCP to exit slow start and fully utilize the available network bandwidth. Since we request the same object, the likely caching of the object reduces the chance that the server's storage sub-system is exercised.
In the Small Query stage, each client makes a request for a unique dynamically generated object if available; else all clients request the same dynamic object. Since such queries often require interactions and computations using a back-end database, we expect that this stage will affect the back-end data processing sub-system and possibly the server CPU. We use a small upper bound (15KB) on the response size so that the network bandwidth remains under-utilized.
Finally, in the Base stage, clients make a HEAD request for the base page hosted on the target servers (e.g., index.html or index.php). This provides an estimate of basic HTTP request processing time at the server.
(a) Coordinator (b) Client
Each stage of a MFC experiment consists of several Epochs. In epoch k, the coordinator directs Nk participating clients to issue concurrent requests of a given category to the target. Clients participating in epoch k constitute a crowd. The coordinator determines the particular object Oi,k that client i should request in an epoch k. The coordinator runs each MFC stage for a preset maximum number of epochs kmax.
Before Epoch 1, each participating client i measures the base response time for downloading the objects Oi,1,…,Oi,kmax from the target. Clients make these measurements sequentially so that they do not impact each other's base response time estimates.
At the end of each epoch, each client reports the normalized response time (observed response time for the request − base response time for the same request) to the coordinator. Successive epochs are separated by ∼ 10s. Based on the clients' response times for requests in epochs 1..i, the coordinator either terminates the stage, or moves to epoch i+1. The coordinator uses the following simple algorithm to decide the next step:
1. Check: For the Base and the Small Query stages, if the median normalized response time reported by the clients in epoch i is greater than a threshold θ, the MFC enters a “check” phase. We use the median to counter the impact of noise on the response time measurements. If the median normalized response time is Xms, this implies that at least 50% of the clients observed an Xms increase in their response time for the request.
The goal of the check phase is to ascertain that the observed degradation in response time is in fact due to overload on a particular server sub-system, and not due to stochastic effects. To verify this, coordinator creates three additional epochs, one numbered “i-” with Ni − 1 clients, and the other numbered “i+” with Ni + 1 clients, and a third epoch which is a repeat with Ni clients. As soon as the median normalized response time in one of these additional epochs exceeds θ, the coordinator terminates the MFC experiment, concluding that a limitation has been found within the sub-system. If there is no visible degradation in any of the additional epochs, the check fails and the MFC progresses to epoch i+1.
Recall that the Large Object stage is designed to exercise the server's outgoing access link bandwidth. However, depending on where the MFC clients are located relative to the target, the paths between the target and many of the MFC clients may have bottleneck links which lie several network hops away from the target server. In such cases, the median increase in response time may reflect an increase in the load on the shared network bottlenecks, and not necessarily on the server's outbound access link. To counter this, we require that a larger fraction of the clients (specifically, 90% of them) observe >θ increase in the response time in the Large Object stage.
In general, for any MFC stage, we can infer sub-system resource provisioning more accurately by relying on the 90th percentile as described above. However, it has a downside relative to using the median: we may now have to load the server's resources a bit longer before drawing an inference. As a trade-off between the requirement to be unobtrusive and the goal to accurately infer the constraints, we use the 90th percentile only for the Large Object stage, and use the median for other stages.
2. Progress: If there is no perceptible increase in the target's response time, or the check phase fails, the coordinator progresses to the next epoch where a larger number of clients participate. To ensure that the target does not face sudden load surges, the coordinator increases the size of the crowd by a small value (we choose this to be 5 or 10 in our experiments).
3. Terminate: If the check phase succeeds, or the number of participating clients exceeds a threshold, the coordinator terminates the experiment. In the latter case, the coordinator concludes that no limitations could be inferred for the particular resource or sub-system.
In a given epoch, the load on the target server is proportional to the number of concurrent requests it is serving, which directly determines the server's response time. An important requirement is that when k clients participate in an epoch, the number of concurrent MFC requests at the server is ≈ k. One can imagine implementing a distributed synchronization protocol among the clients that can guarantee this property, but this introduces a lot of complexity. Instead, we rely on simple techniques that achieve reasonable synchronization by leveraging the centralized coordinator to schedule client requests.
To ensure synchronization, the coordinator issues a command to the clients at the beginning of the experiment to measure the round-trip latency to the target server. Client i then reports the round-trip delay Titarget to the coordinator. The coordinator also measures its round-trip delay to each client Ticoord. Using these measurements, the coordinator schedules client requests so that they arrive at the server at roughly the same time T. Note that the actual HTTP request arrives at the server roughly at the same time as the completion of the 3-way SYN hand-shake. To synchronize client request arrivals, the coordinator issues a command to client i at time T − 0.5 * Ticoord − 1.5 * Titarget. Assuming that the latency between the coordinator and the clients has not changed since the initial latency estimate, client i will receive this command at time T−1.5*Titarget; at this time, client i issues the request specified in the command by initiating a TCP hand-shake with the server. Again, assuming client-target latency does not change, the first byte of client i's HTTP request will arrive at the target at time T. Since an MFC experiment spans only a few minutes, we believe that assuming that network latencies are stationary over this time-span is reasonable [26].
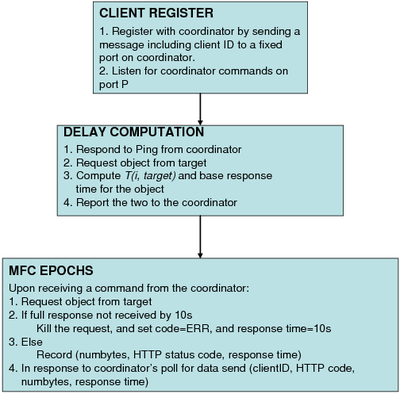
We have implemented the MFC approach as described above. We use hosts from PlanetLab as the MFC clients. Our coordinator runs on an off-the-shelf Linux host located at UW-Madison. Figures 2(a) and (b) provide additional details of the functioning of clients and the coordinator. While these largely reflect the discussion in Section 2.2, a few points are worth noting.
Before conducting an MFC experiment, the coordinator checks if at least 50 distinct clients are available to run the experiment (see Figure 2(a)). The coordinator does this by verifying if at least 50 clients respond sufficiently quickly (within 1s) to a probe message. If not, the experiment is aborted. This check is important because with a small number of participating clients, we cannot claim that the MFC captures realistic wide-area conditions faced by generic Web clients accessing the target server. Ideally, we should also factor in the geographic locations of the clients, i.e., ensure that the active clients are well spread out. Our current implementation does not enforce this requirement.
Note that in order for the median and the 90th percentile response time measurements in an epoch to be statistically significant and robust to noise, we need a sufficient number of clients to be participating in the epoch in the first place. We choose this number to be 15. Thus, for all initial epochs where fewer than 15 clients participate in the measurement, the coordinator automatically progresses to the next epoch irrespective of the degradation in the response time observed in the current epoch.
Note also that the participating clients within each epoch are chosen at random (see Figure 2(a)). This is important to ensure that an observed increase in the median response time is purely due to an increase in the number of participating clients at the server, and not due to the local conditions experienced by the clients themselves (e.g., transient congestion or due to load on a client).
The client-side functionality is simple (Figure 2(b)). The client listens for commands from the coordinator and fires off HTTP requests as soon as a command is received. Clients timeout 10s after issuing an each HTTP request (see Figure 2(b)). Thus, if the target takes more than 10s to completely respond to a request, the client kills the request and records a response time of 10s. The client computes the normalized response time as before and sends this to the server. This is to ensure that each epoch spans a bounded amount of time.
Since the timeliness of the communication between the coordinator and clients is important for synchronization, we use UDP for all control messages. We did not implement a retransmit mechanism for lost messages.
Practical Issues: In our current implementation, all the requests in the MFC are directed to a single server IP address. If a server's DNS name maps to multiple IPs, we pick one at random and send all the MFC requests to this single IP. Some Web sites may direct clients to different replicas based on the clients' geographic locations, and in such cases the MFC will only be able to identify scaling bottlenecks on the server assigned to the specific IP address chosen, and not of the Web site as a whole.
Server-side caching could also impact the observations we draw from an MFC experiment. Many servers cache Web objects and other clients not part of the MFC may request the same object concurrently. Thus, even if each MFC client requests a unique object (e.g., in the Small Query stage), we cannot guarantee that there are no caching effects. Thus we cannot ensure that the load on a specific server resource or sub-system will grow monotonically as a function of the number of requests, and that, eventually, we will observe a perceptible increase in the response time.
MFCs may require additional information to actually confirm that requests are exercising a single specific resource on a server – this is a fundamental limitation of any mechanism that relies on remote inferences. The MFC approach as such does require any data collection at the server. However, server-side support in instrumenting servers to track resource usage using utilities (such as atop or sysstat) can offer better insights.
Background traffic at the target can also impact MFC inferences. Thus, with non-cooperating sites, we suggest running MFCs at off-peak hours. With cooperating sites, site operators can indicate whether they wish to observe the limitations of the “raw” production infrastructure (under low background traffic) or the ability to handle load surges under regular operating conditions.
Next, we address the following questions through experiments in controlled laboratory settings: (1) Are requests from MFC clients adequately synchronous? (2) How well can MFC track the target's response behavior? (3) How effective are MFC requests at exercising intended resources at the target?
Our experiments have highlighted a few key limitations of our approach. We discuss these in Section 3.3.
To answer the first two questions, we set up a simple server (with no real content and background traffic) running a lightweight HTTP server [3] on a 3.2 GHz Pentium-4 Linux machine with 1GB of RAM. We instrument the server to track request arrival times and to implement synthetic response time models. To run the MFC, we used 65 PlanetLab machines as clients. The MFC coordinator and the target are high-end machines within UW-Madison with high-bandwidth network connections.
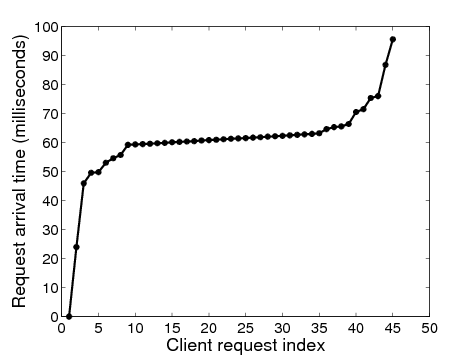
Figure 3: Arrival times at target for MFC with 45 clients
Synchronization: We logged the arrival times of each incoming HTTP request at the target server. Figure 3 shows the arrival time of each request with a crowd size of 45 clients. In these experiments, the coordinator commands the clients to make a HTTP request 15s after taking the latency measurements. About 70% of the requests arrive within 5ms of each other (clients 7 through 40), and 90% of the requests arrive within 30ms of each other (clients 3 through 43), indicating that our synchronization algorithm works quite well.
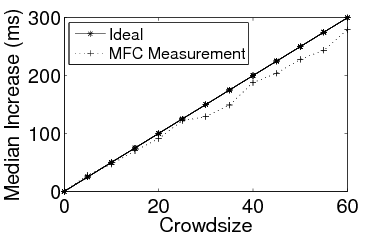
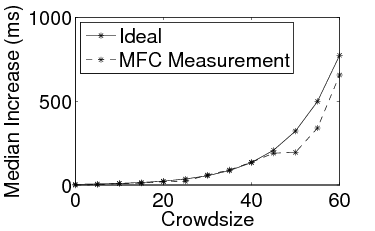
(a) Linear (b) Exponential
Figure 4: Tracking synthetic response time functions
Tracking Server Response Time: To validate MFC's ability to accurately track different server response behaviors, we incorporated synthetic response time models into the validation server. Each model defines the average increase in response time (relative to the base response time) per incoming request as a function of the number of simultaneous requests at the server. The response times were strictly non-decreasing functions of the pending request queue size. We show the median normalized response times estimated by the clients for two models: linear (Figure 4(a)) and exponential (Figure 4(b)) (results with other models not shown here were similar). In both cases, the median increase in response time across the clients faithfully tracks the server's actual response time function. This shows that MFC can accurately reflect the impact observed by a remote server under controlled load surges.
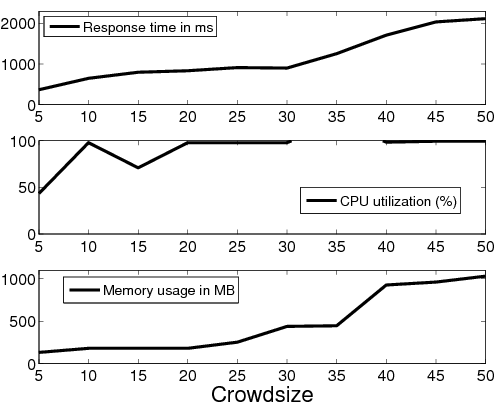
Next, we examine the effectiveness of MFC in exercising specific resources at the target server. We set up a Apache 2.2 Web server (with the worker multi-processing module) on a 3 GHz Pentium-4 machine with 1GB RAM. We emulate a MFC on this target server with clients located on the same LAN as the server. For each experiment we measure the response times seen by the MFC clients and server-side resource utilization using atop to monitor the CPU, resident memory, disk access, and network usage. We use a maximum of 50 clients.
Large objects. In the large object workload, each MFC client requests the same 100KB object from the server. Figure 5 shows a significant increase in the median response time observed by the clients due to the network load on the server. CPU, memory, and disk utilization remain negligible during the experiment. Thus, in this case the network bandwidth constraint is primarily responsible for the increase in response time.
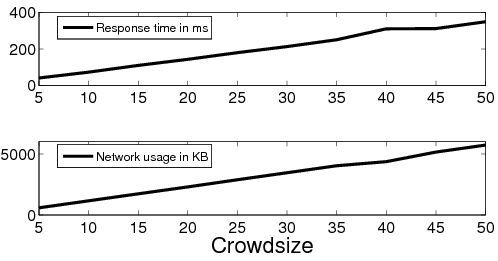
Small Query workload. For emulating a dynamic object or database query workload we set up a back end database (details regarding the specific content hosted on the database are not relevant for validation). During each epoch, participating clients make the same query (thus, the responses may be cached). Each query causes the server to retrieve the same 50000 entries from a database table and return their mean and standard deviation. The query workload is not network intensive as the responses are each less than 100B. The back end database is a MySQL server with the query cache size set to 16MB.
We experimented with two server-side software interfaces for the DB back-end: the FastCGI [8] module and Mongrel [12], a lightweight module explicitly designed for handling dynamic objects. When using Mongrel, we noticed that the response time stays within 10ms for crowd sizes up to 50 (not shown); the CPU utilization and memory usage stayed constant and low. However, an inefficiency in the FastCGI implementationFastCGI forks a new process for each request. As the number of requests increases, each of the forked process independently inherits the memory image of the parent process leading to very high memory usage during the experiment. caused memory usage on the server to increase dramatically with the crowd size (Figure 6). Consequently, client response time also increased significantly.
The lab-based tests confirm the potential usefulness of the MFC approach in identifying resource constraints in Web servers. To put the applicability of MFC in perspective, we discuss two important factors that can affect MFC inferences: (i) impact of serial vs. parallel accessed resources, and (ii) granularity of the inferences.
An increase in the observed response time in the MFC experiment under a particular type of request can be attributed to two possibilities. One is an increase in the load on a specific server resource, where each additional request consumes a proportional fraction of the resource. The other is an increase due to server-side scheduling and resource serialization constraints, where additional requests do not impose any additional load on a resource, but create larger-sized queues of requests waiting for the resource (e.g., serialized access to a single disk). Such serialization bottlenecks can impact our ability to detect resource constraints.
Server throughput is determined by a number of factors, including hardware performance, software throughput, and server-side components used for handling requests. Our experiments show that while we may be able to isolate resource constraints at a “sub-system” granularity (e.g., disk subsystem, database subsystem, network etc), providing finer-grained information to precisely pinpoint if the constraint is a hardware or software inefficiency is difficult, especially without operator input.
MFCs are not well-suited for inferring constraints on some types of resources, such as memory buffers, which cause a sharp degradation in response time only when they are exhausted. Reaching this tipping point typically requires a very large number of simultaneous requests which conflicts our design goal of limiting intrusiveness. In our current MFC implementation, we sought to indicate coarse-grained resource constraints as a guideline for better server provisioning. Our validation results demonstrate the promise of the MFC approach to achieve this goal. Ultimately, any fine-grained analysis of resource constraints can be best understood when MFC is run in cooperation with administrators managing the target server.
In addition to lab-based experiments, we ran MFCs on a few cooperating commercial and academic Web sites. The server operators provided us with access logs and invaluable feedback on the accuracy and usefulness of MFC inferences. The logs enabled us to check if the requests were adequately synchronized, and examine the volume of non-MFC traffic (background traffic) received by the Web server during the course of our experiments. Based on this, we can see how MFC is impacted by the presence of various levels of background traffic volume.
We worked with operators of a top-50 ranked commercial Web site (according to Quantcast [19]) to cooperate in our MFC experiments. The site operates a large database serving queries for users primarily in North America, and serves over a billion requests yearly. The operators allowed us to test two system configurations. One is a non-production server hosting identical content as the production server but handling minimal traffic. We call this server the QTNP (Quantcast Top-50 Non-Production) server. The administrators provided logs of all Web requests during the testing period. In addition, they also allowed us to test their production system (which we call QTP). Hence, we were able to see some details of how our experiments reflected on their site. In particular, we examine the temporal distribution of the request arrivals during our experiment (with millisecond granularity).
Expt Base Small Qry Large Obj details Time Crowdsize Time Crowdsize Time Crowdsize MFC 09/11/07 25 09/11/07 55 09/11/07 NoStop 100ms (55) MFC 09/12/07 20 09/11/07 45 09/11/07 NoStop 100ms (55) MFC-mr 09/21/07 40 09/21/07 90 09/21/07 NoStop 250ms (150)
Table 1: Results for QTNP non-production server. MFC traffic contributed to >70% of all traffic at QTNP.
MFC on QTNP: We ran multiple experiments on the QTNP system, a subset of which are summarized in Table 1. We ran the three stages of the MFC on September 11 and again on September 12, 2007 (first two rows). We used a 100ms threshold for both sets of experiments.
The outcome of the experiment is similar across both the runs. For the Base stage, we observed a 100ms degradation in response time when using 20-25 clients; for Small Queries, the response time crossed the threshold for a crowdsize of 45-55 clients. The Large Object stage did not impact the response time in either run (in both cases a maximum of 55 requests were issued).
We ran a slightly modified MFC, MFC-multiple request (MFC-mr), on QTNP on September 21, 2007 (results shown in the third row of in Table 1). In MFC-mr, each participating client opens two TCP connections to the target and sends the same request on both connections simultaneously doubling the number of MFC requests arriving at the target server.
For these experiments, we also increased the threshold to 250ms based on the QTNP operators' view that their systems would not be negatively impacted by an MFC with a higher threshold.
We had two goals in running the MFC-mr experiments on QTNP: (1) to understand the system's response when we send a larger number of simultaneous requests – particularly for the Large Object stage which showed no visible degradation under the standard MFC; and (2) to contrast the response behavior in the Base and the Small Query stages for the 100ms threshold with a higher 250ms threshold.
For Large Object, there was again no visible degradation in response time even when 150 simultaneous requests were made—the response time degraded by only a few milliseconds. This suggests that the access link is well-provisioned and the operators confirmed this.
For the Base and the Small query stages, the QTNP showed a 250ms degradation in response time with a crowd size of 40 and 90, respectively. The operators noted that the Small Query we tested involves processing on multiple servers (in addition to the back end database), and one of the servers was a known contention point. Although the degradation in the Small Query experiment confirmed a known issue, the results demonstrate that MFCs can be used to help identify and diagnose resource constraints. The Base stage response time degradation with only 40 simultaneous requests was surprising to the operators.
Finally, we examined the time synchronization of MFC-mr requests arriving at the site. We found that most of the requests in each epoch arrived closely together, within at most one second of each other. In a few of the epochs, a small fraction of the requests (<10%) arrived 2-3 seconds before or after the rest. We omit the detailed results here, however we discuss the efficacy of our synchronization in greater detail in the context of the production QTP system below.
Overall, the site operators felt that MFC was a valuable tool to both analyze their local configurations and to better understand resource limitations. Although some of the results were known to the operators, MFC experiments were able to confirm them, and also uncover possible new constraints.
MFC on QTP: We ran two experiments on the production QTP system on September 27 and October 3, 2007 (results not shown for brevity) using MFC-mr, with one additional modification to the latter experiment. Each client in the first experiment made two requests in parallel as with QTNP (85 client nodes were available), while in the second experiment, each client made 5 requests in parallel (only 75 client nodes were available).
QTP received approximately 3 million and 1.6 million non-MFC requests respectively during our first and second experiments. All MFC requests were directed to a specific data center which houses 16 multiprocessor servers in a load-balanced configuration serving the requests directed to the single server IP address we used. The server logs were collected from all 16 servers.
We found that the response times in the different stages were not impacted by the MFC, even with MFC-mr with 5 requests. In fact, we did not observe even a 10ms increase in the median response time. This confirmed that the system is well-provisioned, with multiple high-end servers working in parallel. We knew from our interactions with operators that the bandwidth was well-provisioned also.
Base Small Qry Large Obj Num Num Spread Num Num Spread Num Num Spread reqs reqs for 90% reqs reqs for 90% reqs reqs for 90% scheduled recd of reqs scheduled recd of reqs scheduled recd of reqs 25 25 0.18 25 25 0.16 25 23 1.41 40 40 1.05 40 40 1.58 40 33 0.48 55 55 0.23 55 55 0.42 55 50 0.52 75 74 0.77 75 75 0.23 75 71 1.67 100 100 0.27 100 100 0.15 100 92 0.96 125 121 0.22 125 125 0.22 125 122 1.74 175 175 0.26 175 171 0.27 175 172 2.09 225 225 0.30 225 206 0.29 225 213 1.28 275 275 0.32 275 270 0.17 275 275 1.28 325 324 0.32 325 318 0.15 325 324 2.05 375 374 0.34 375 353 0.16 375 344 3.28
In Table 2 we examine the synchronization of MFC-mr requests to QTP for the October 3 experiment. For the Base and the Small Query stages, the synchronization works well. For instance, in the last epoch of the Small Query stage, 90% of the 353 requests (≈ 317 requests) arrived at the server within 0.16s of each other. The synchronization was not as tight for the Large Object stage, but still reasonable with about 310 of the 344 requests in the last epoch arriving within a 3.28s time-span; 258 requests (75% of requests) arrived within 800ms.
Expt Base Small Qry Large Obj MFC Other details Time Crowd Time Crowd Time Crowd Traffic Traffic (Span) size (Span) size (Span) size (% of all) reqs/s MFC-mr 1015 NoStop 1025 130 1035 110 2682 4.2 250ms (557s) (140) (441s) (330s) (33%) MFC-mr 1725 150 1740 130 1755 NoStop 2829 2.9 250ms (378s) (382s) (300s) (150) (48%) MFC-mr 2354 NoStop 0000 130 0010 110 2442 3.5 250ms (295s) (150) (354s) (333s) (41%)
Expt Base Small Qry Large Obj MFC Other details Time Crowd Time Crowd Time Crowd Traffic Traffic (Span) size (Span) size (Span) size (% of all) reqs/s MFC-mr 0925 90 0935 30 0950 NoStop 1388 20.3 250ms (303s) (176s) (318s) (150) (7.9%) MFC-mr 1605 110 1620 30 1630 NoStop 1422 18.7 250ms (330s) (173s) (285s) (130) (49%) MFC-mr 2255 NoStop 2305 30 2320 NoStop 1543 12.5 250ms (299s) (150) (171s) (308s) (150) (13.7%) (a) Univ-2 (b) Univ 3
We ran MFC measurements on a research group Web server at a European University (labeled Univ-1) and the primary Web servers of the computer science departments of two US universities (labeled Univ-2 and Univ-3). We obtained server logs of requests arriving during the experiment time frame.
Univ-1: We ran the standard version of MFC with a 100ms threshold against the Univ-1 Web server on Aug 11, 2007. The experiment ran over a 35 minute period generating 339 out of the total of 661 (51%) HTTP requests received by the Web server. During our experiments the server had a low background traffic level of about 0.15 requests/sec. For all three stages of the MFC, we noticed that the server's response time degraded by more than 100ms with small crowd sizes. For the Base and the Small Query stages, the stopping size was just 5 clientsAs indicated in Figure 2, the experiment runs until the crowd size reaches 15. We analyzed the results to identify the earliest crowd size at which a 100ms increase occurs., and for the Large Object stage the stopping size was 25 clients. These results indicate that the server is poorly provisioned in general, with bandwidth being provisioned better than the rest of the infrastructure. The site administrators confirmed that MFC experiments provided an accurate view of the server configuration, as it is not provisioned to serve a large volume of requests (since it hosts a relatively small number of pages). The server logs indicate that the MFC requests arrived within a maximum 1s of one another.
Univ-2: We measured the Univ-2 Web server at three different times on Oct 5, 2007, using MFC-mr with a 250ms threshold (after discussions with the operators). The Univ-2 server runs Apache version 2 and is behind a 1Gbps link, with a relatively small amount of background traffic (maximum of 4.2 requests/sec in the morning experiment). The relative volume of background (vs. MFC requests) traffic was 67%, 52%, 59% for the three experiments.
From the results in Table 3(a), we see that there are a few cases in which MFC did not result in a 250ms response time degradation, even when using all available clients. However, in these cases we noticed that as soon as the number of simultaneous requests crossed 130, the MFC caused a 150-200ms increase in the base response time. With additional clients, it is likely that the response time increase would have crossed the set threshold.
An interesting observation from these experiments is that, irrespective of the MFC stage, the experiments seem to consistently stop (or show a substantial degradation in response time) for crowds of sizes 110-150. This holds even for the large object stage, which is surprising because the server's access bandwidth is very well provisioned. Software configuration artifacts (e.g., limits on the number of server threads) or buffer limitations might explain these observations. As we discussed in Section 3, an observed increase in response time may not always be due to server resource constraints, but rather due to artifacts such as server-side request scheduling, resource serialization, or buffer exhaustion.
The Univ-2 administrators agreed that software configuration may be the reason (though they did not know the exact reason). The server's software configuration had not changed in several years, and the operators requested us to run additional MFC experiments against a new configuration with a much larger bound on the number of threads. The administrators felt that the MFC approach could prove useful to tune both the hardware and software configuration of their server.
Univ-3: We conducted similar experiments on the Univ-3 Web site on October 5, 2007. The Web site runs on a 1.5GHz Sun V240 server. Compared to Univ-2, the rate of background traffic at the Univ-3 server was 5X to 9X higher. The highest rate was observed during the morning experiment (20 requests/s) and the lowest rate observed during the late evening experiment (12.5 requests/s).
We see in Table 3(b) that the base HTTP processing capabilities are adequate and comparable to Univ-2. The Large Object stage shows no response time impact, confirming that the bandwidth was well-provisioned. The site's ability to handle the small query request was poor, however, as the response time showed a significant increase with just 30 simultaneous requests.
For Univ-3, we also observe some effects due to the variations in background traffic. For instance, in the morning and afternoon Base stage experiments, the stopping crowd size is lower, i.e., when there was more background traffic. The late evening experiment (22:55 hrs) did not cause the response time to increase beyond the threshold. Background traffic has little impact on the Small Query and Large Object stages as the results are similar for all three experiments. Small Query results are affected solely by the constrained query handling capacity, while the Large Object stage results are influenced primarily by the abundant bandwidth. To gain a thorough understanding of the limitations of a server's resources, it may be useful to run MFCs at under diverse background traffic conditions.
Upon examining the results, the Univ-3 site operators echoed the sentiments of the operators of QTP, Univ-1, and Univ-2 sites, namely that a diagnostic tool like MFC that is capable of providing guidelines on individual resource bottlenecks is useful. In their experience, site provisioning was often based on best guesses followed by reactive changes. The operators also mentioned that MFC was non-intrusive as the impact on their servers was minimal. Comparisons between Head and Large Object results were of particular value to them; they felt that they could have used the results to debug a recent incident in which a large number of simultaneous downloads of a popular video frustrated another user downloading a different large file. It was unclear if the poor performance of the frustrated user was due to a bandwidth bottleneck or request handling constraints. Since Base showed a discernible response time increase while Large Object did not, they felt the real problem was more likely in request handling, rather than bandwidth provisioning. The Small Query experiment helped them to recall that their legacy infrastructure was not caching responses appropriate thus causing the perceptible degradation even with small crowd sizes.
Our experiments with cooperating production Web sites proved to be quite useful to demonstrate the practical benefits of MFCs. Site operators agreed that the technique did not impose a significant overhead. We also found that inferences based on MFC experiments confirmed suspected issues, and in some cases revealed new information or brought provisioning/configuration issues to the attention of site operators. Having access to server logs and other data also allowed us to examine issues such as synchronization and the effects of background traffic more directly.
The MFC approach is non-intrusive, automatic, and tunable to the specific content on a server. Thus, MFCs can be run against servers “in the wild” to get insights into resource provisioning without disrupting the servers' functioning. In August and September 2007, we measured several hundred Web servers, about 90 known phishing servers, and a few hundred servers of startup companies. We used the standard version of MFC with a threshold of 100ms. Our experiments required a minimum of 50 client nodes; the maximum number of clients we used depended on how may PlanetLab nodes were responsive during a given experiment (maximum was 85). Each participating client sent at most one request (i.e. we do not use MFC-mr).
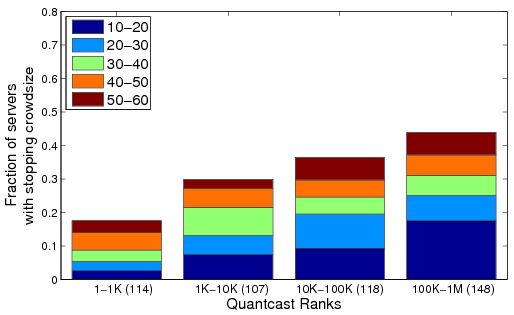
We first present results of running the MFC Base stage against more than 400 Web servers. These were selected from a list of Web site rankings maintained by Quantcast [19]. Servers with different levels of popularity are well represented in our selection. We selected 114 sites ranked 1-1K, 107 sites ranked 1K-10K, 118 sites ranked 10K-100K, and 148 sites ranked 100K-1Million. We expect that servers with a smaller rank (more popular Web servers) would be qualitatively similar to one another in terms of provisioning, and, more importantly, better-provisioned than Web servers with much larger ranks.
Figure 7: Breakdown of stopping crowd sizes for the Base stage for various Quantcast rank ranges.
Figure 7 shows a summary of the crowd size at which different servers showed more than 100ms increase in the median response time for the Base stage of the MFC. For each rank category, we also break down the stopping crowd sizes into sub-ranges as shown. As expected, the total fraction of servers that show a 100ms increase in response time increases steadily as we move to servers with larger rank indexes (17% for the 1-1K category vs 45% for 100K-1M category). More than 15% of the servers in the largest rank category (100K-1M) can handle at most 20 simultaneous HEAD requests before the response time increases visibly. Surprisingly, we also find that ∼10% of the Web sites in the 1-1K rank category degrade with less than 40 simultaneous requests.
Next, for the Small Query stage we selected around 400 Web servers, each hosting at least one object that fits our definition of Small Query (see Section 2.2). All clients requested the same object at the target server. We measured 106, 103, 103, and 122 servers in the four rank ranges in ascending order of the ranks. The measurements summarized in Figure 8 show that the provisioning of the servers is strongly correlated with popularity: the fraction of servers which show ≥ 100ms degradation in response time increases significantly as the server popularity decreases. Comparing Figures 8 and 7, we see that across all the rank-ranges a much larger fraction of servers showed more than a 100ms degradation in response time with the Small Query stage compared with the Base stage. Among the servers with largest ranks (100K-1M), about 75% of the servers cannot handle more 50 simultaneous queries and about 45% cannot handle more than 20 simultaneous queries (these numbers were 38% and 18%, respectively, for the Base stage). Somewhat surprisingly, even among the highest-ranked servers, about 20% cannot handle any more than 40 simultaneous queries.
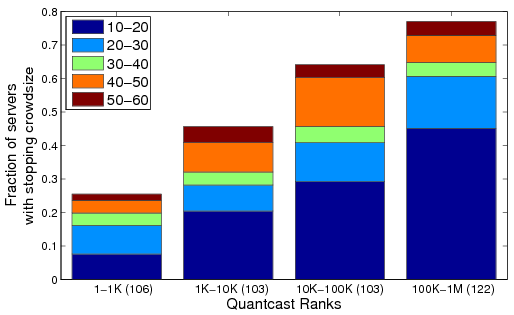
Figure 8: Breakdown of stopping crowd sizes for the Small Query stage for various Quantcast rank ranges.
A possible reason for the difference between the Base and Small Query is that the latter typically requires more processing or more accesses to other back-end services (e.g., databases) compared to the lightweight HEAD requests of the Base stage. With a more resource-intensive workload, we note a larger fraction of the Web sites showing a degradation.
For the Large Object stage, we measured 129, 100, 114 and 103 servers in the four rank ranges, where each server hosts at least one Large Object (size between 100KB and 2MB). The bandwidth provisioning of Web servers appears less correlated with the server's popularity than the provisioning of the back-end database modules (see Figure 8) or the basic HTTP processing (see Figure 7). Except for the most popular servers (1-1K), about 45-55% of the servers in the rest of the categories cannot handle more than 50 simultaneous requests. Also, for the first two categories with the most popular servers (1-1K and 1K-10K), the fractions are similar across the Small Query and the Large Object stages. But, for the remaining two categories, a much smaller fraction of servers exhibit a degradation in response time during the Large Object stage (57% and 55%) when compared to Small Queries (65% and 77%). Most popular servers provision both their access bandwidth and back-end database and processing quite well. Lower rung servers appear to provision their bandwidth relatively better than their back-end data processing capability.
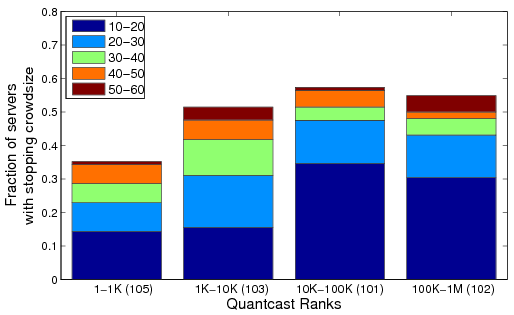
Figure 9: Breakdown of stopping crowd sizes for the Large Object stage for various Quantcast rank ranges.
We also measured Web servers of a few hundred startup companies. Startup sites could benefit from a MFC approach, since they are often ill-prepared for a “success disaster” resulting from coverage in popular news sites or technology blogs. We compiled a list of recent startups from technology blogs. We expected that most of them would be deployed at commercial Web hosting services, and thus, likely to be reasonably well-provisioned.
Stopping Crowdsize Percentage of servers Base Small Query 10-20 24% 33% 20-30 6% 12% 30-40 7% 6% 40-50 6% 5% No-Stop 58% 44%
Table 4: Stopping crowd sizes for Startup Servers
We ran the Base MFC stage on 107 startup servers; results are shown in Table 4. About 68 servers (58%) did not show a visible degradation in response time even with 50 requests. At the other extreme, 24% of servers showed a 100ms degradation with ≤ 20 requests. A lot fewer servers showed degradation in response times for the intermediate crowd sizes. The results for the Large Object stage (we ran against 103 servers) were qualitatively similar to the Base stage, with 30% of the servers showing a 100ms increase with a crowd size less than 30 (not shown). Compared to the Base and Large Object stages, the Small Query experiment showed a marginally greater degradation in the performance of the startup sites (we measured 82 servers). Around 33% of the tested servers were unable to handle more than 20 requests in the Small Query experiment, and around 56% of the sites stopped with a crowd size less than 50 (Table 4). Overall, we find that a significant fraction of startup servers (between 24% and 33%) cannot handle more than a handful (≤ 20) of requests, and hence are ill-prepared for even low-volume request floods.
We also conducted a measurement study of 89 phishing sites obtained from Phish-tank [18] where we ran the Base MFC stage.
Stopping Crowdsize Percentage of servers 10-20 12% 20-30 16% 30-40 11% 40-50 11% No-Stop 50%
Table 5: Stopping crowd sizes for HEAD request for phishing Servers
Our intuition was that a very small fraction of phishing sites would be hosted at well-provisioned Web hosting service providers. Thus, we expected phishers to be similar, if not worse, compared to servers in the Quantcast 100K-1M rank range. From Table 5, we see that a significant fraction (28%) cannot handle more than 30 requests. For servers in the 100K-1M rank category (Figure 7), we find that the corresponding fraction of sites was 18%, suggesting that most of the phishing sites are hosted on fairly low-end servers similar to the 100K-1M ranked Web sites. Table 5 also shows that about 50% of the phishing sites did not show a 100ms increase in response time even with a crowd of 50 clients—the corresponding fraction for servers in the 100K-1M category, 62%, is only slightly higher (Table 5). Indeed, the distribution of the request handling capabilities of the phishing sites is quite similar to low-end Web sites.
Role of “Measurers”: We can augment MFC with a set of “measurers” that independently measure the response time at the target and report these to the coordinator. The measurers can either make concurrent requests for the same object requested by the crowd or have the flexibility to request other objects. The latter approach can help quantify correlations among resources on the target server (e.g., how does a disk-intensive workload impact the response time of a database-intensive request?).
DDoS Vulnerabilities: Web sites can be the targets of either network-level or application-level DDoS attacks. The former class targets a server's incoming (e.g., SYN-floods) or outgoing bandwidth (e.g., e-protests) and the latter targets server's CPU, memory, disk or the back-end database. The wide-spread use of botnets increases the risk of carefully crafted application-level DDoS attacks. Solution proposals for network-level attacks include capabilities [25, 17] and bandwidth amplification s [5, 11], while resource payment mechanisms [21] have been proposed for application-level attacks. A site operator must first understand which resources are the most easily vulnerable to attacks. Second, the effectiveness of some protection mechanisms depends on the volume of the attack traffic (e.g., [21, 17]). Thus, the operator needs to understand at what volume of requests a server resource starts to “keel over”. For instance, if a server's response time does not increase during the Large Object stage for very large crowd sizes, but does so at a small crowd size for the Small Query workload, then the server is highly vulnerable to even the most simple application-level attacks on the back-end data processing subsystem. By comparing inferences drawn from the different stages of a MFC the operator can address these issues.
Staggered MFC: MFC enforces tight synchronization of requests by scheduling them to arrive at the target simultaneously. However, if a Web server performs poorly with respect to tight synchronization, but provides low response times when the requests arrive somewhat staggered, then we can conclude that the server can handle the medium and low volume flash-crowds reasonably well. Operators can benefit from understanding how the application infrastructure behaves when the request inter-arrival times follow a certain distribution. A simple extension to MFC can provide this capability – the coordinator schedules the clients such that the target sees 1 request every m milliseconds. Other non-uniform distributions of inter-arrival times are also easy to implement.
Web server Benchmarking: Benchmarking tools [20, 24, 22, 13] can emulate multiple user sessions, create client requests for dynamic content, and model standard workloads for banking, e-commerce, and Web browsing. These benchmarks provide controlled emulation of the client side behavior in a lab setting (clients and server on the same LAN). These tools stress test a server by changing parameters such as the number of active clients and the inter-arrival times of requests. In contrast, MFC uses clients that are distributed across the wide-area network, providing the ability to understand server performance under realistic networking conditions. Also, MFC provides the ability to exercise specific server resources in a controlled fashion, yielding detailed observations.
Measuring and Modeling Flash Crowds: There are several proposals for modeling flash crowd events [2, 23, 6]. One such technique [2] uses real flash crowd traces to model request patterns and inter-arrival times to study the effectiveness of various caching techniques during flash crowd situations. Such approaches only capture coarse-grained behavioral characteristics of flash-crowd events, and as such do not address more fine-grained details of how the requests impact individual server components. By devising specific request types MFC provides the ability to capture these fine-grained aspects as well.
There are also techniques that study differences in client request patterns to distinguish legitimate flash crowds from malicious DDoS attacks [9]. Another technique [6] identifies flash crowds by examining performance degradation in responses. Such techniques primarily act as diagnostic aids when a server is experiencing extreme load. In contrast, MFC operates in a significantly lower load regime while providing the ability to identify the request volume at which a server's response time begins to show perceptible degradation.
Software Profiling: Several efforts attempt to profile hosts to reveal interesting aspects of software platforms or software artifacts that can indicate bottlenecks. TBIT [16] fingerprints the TCP versions (e.g., Reno, Newreno or SACK) used on servers. Controlled lab experiments have been used to evaluate the robustness of different TCP/IP implementations [7]. NMAP [14] and p0f [15] are commonly used to remotely fingerprint operating systems running on network-connected hosts. MFC can complement these tools to provide a more comprehensive resource profile of Internet servers.
Researchers have suggested techniques for inferring performance bottlenecks in distributed systems as events or requests flow through the system [4, 1]. Although these approaches treat the target system as a black box on the whole, they require non-trivial instrumentation of the target to shed light on why some requests are delayed more than others. MFC is designed to provide useful inferences even without any involvement from or instrumentation of the target server. By additionally instrumenting the target, we can improve the accuracy of our inferences.
Commercial Services: Keynote [10] provides wide-area measurement services, with a focus on end-user experience. They use response times for single requests measured from a global network of computers to infer resource bottlenecks but they do not synchronize requests in any way. In contrast, MFC can infer resource bottlenecks that are not visible when the web server processes a single request, but surface only under more intensive synchronized loads.
We have presented the design, implementation, and evaluation of mini-flash crowds (MFC)—a light-weight, non-intrusive, wide-area profiling service for revealing resource bottlenecks in a Web server infrastructure. Through controlled measurements with an increasing number of clients making synchronized requests to exercise specific resources of a remote server, we are able to faithfully track the impact on different server resources. We performed extensive validation experiments to verify that our approach can offer useful and accurate information regarding resource provisioning. We conducted several tests on co-operating Web sites, including one large commercial site, which showed that our approach is practical and safe. The operators of the cooperating sites confirmed the inferences we made and found our observations regarding the provisioning of their server infrastructure quite useful. We ran MFC against hundreds of servers of differing grades of popularity and with correspondingly different server infrastructures. These measurements indicate that back-end processing is a key bottleneck for many servers of medium to low popularity and that the access bandwidth is less constrained overall. We are currently exploring numerous extensions to MFC including tailored use for specific sites and using workloads with specific distributions of inter-arrival times.
This document was translated from LATEX by HEVEA.