John R. Lange![]() Peter A. Dinda
Peter A. Dinda![]() Samuel Rossoff
Samuel Rossoff![]()
{jarusl,pdinda}@cs.northwestern.edu, srossoff@csc.uvic.ca
![]() Northwestern University
Northwestern University ![]() University of Victoria
University of Victoria
Remote display systems allow a distant user to control a computer or application with a graphical user interface. While this technology dates back to the 1980s and the X Window System [18], it has only recently become widely deployed through the success of VNC [17] and Microsoft's inclusion of the Remote Desktop Protocol (RDP) in the mainstream release of Windows. Remote display systems are also key components in thin-client computing [9,19]. In this paper, we particularly consider the RDP and VNC protocols.
Increasingly, remote display systems are being used over wide-area networks where round-trip latencies are inherently higher than those in local-area networks, and have far greater variance [16,7]. These higher latencies dramatically reduce the utility of remote display systems for end-users, making the remote computer seem choppy, slow, and hard to control.
The client and server in a remote display system communicate through two independent event streams. User events (keystrokes, mouse movements and clicks, etc) flow from the client to the server, while screen events (graphics primitives) flow from the server to the client. While neither VNC nor RDP require that the two event streams be synchronized, they are in fact synchronized through the user who will frequently wait for the effects of his actions to be shown in his display. The user is thus subject to the round-trip time of the network path and perceives the high mean latency and variance of the path as slowness and jitter in the display. While important recent work, both in academia [1], and industry [12], have made remote display systems more efficient, the client/server round-trip is fundamentally limited by the physics.
We propose speculative remote display as a way of alleviating this problem. Speculation has been proposed as a way to reduce the user-experienced latency in other systems contexts [24,13]. In this paper, we focus on an approach to speculative remote display that requires no server or protocol changes, and thus can be layered over existing systems, including those previously mentioned. We assume that the client has spare cycles. The key idea is for the client to predict future screen events from the history of past screen and user events and execute these screen updates immediately. As the actual server-supplied screen events arrive, they are compared against the predicted events that have already been speculatively executed. If there is a difference, the client rolls back (undos) the effects of the erroneously predicted events. In effect, the client is always executing a nested transaction on the frame buffer, and the updates from the server indirectly provide commit and abort notifications. Provided that (1) the event streams are sufficiently predictable, and (2) users are sufficiently tolerant of rollbacks, speculative remote display has the potential to make wide-area remote display more usable.
A client-based speculative remote display system requires significant client-side changes, and the selection of an appropriate predictor. The client must be modified so that it can interface with a predictor, validate predictions, and be able to roll back predicted display changes when they prove to be wrong. The difficulty of these modifications is protocol-dependent. RDP clients are considerably harder to modify than VNC clients because the RDP protocol is semantically much richer, and because RDP requires that the client maintain state beyond the framebuffer and cache, namely a Windows-like device context. For this reason, we have designed, implemented, and evaluated a speculative client for VNC to begin exploring speculative remote display. However, we have studied the predictability user and screen event traffic in both RDP and VNC.
There are numerous approaches that one could take to predicting the
future screen events from the past user and screen events. Our
prototype system modularizes the predictor. The initial predictor we
use in our work is simple state-limited ![]() -th order Markov model that
uses the events themselves as symbols. We describe this predictor in
more detail in Section 2.
-th order Markov model that
uses the events themselves as symbols. We describe this predictor in
more detail in Section 2.
Using this predictor, we examined the prospects for client-based speculative remote display by studying the predictability of traces collected during a study of users using instrumented clients for Microsoft's RDP and for VNC. In both cases, our users interacted with commonplace Windows applications. For RDP, our simple Markov models are very successful in predicting the next screen event from previous screen and user events. Not only can we generate a prediction for most events, the predictions are usually right. For VNC, our models are less successful. We generate predictions for a smaller fraction of the events, but the predictions are usually right. However, the rate of VNC screen events is also much lower than that of RDP. We describe our predictability analysis in detail in Section 3.
We designed and implemented client-based speculative remote display within the VNC system. Our system is described in detail in Section 4. There are several design alternatives possible, and we explain the implications of each and how we arrived at our current design. Our system's user interface lets the naive user trade off between the effective reduction in round trip time and the degree of display artifacts appearing on the screen due to incorrect predictions.
Because our system essentially trades off the effective responsiveness1 and correctness2 of the display, it is essential that we evaluate whether such a remote display approach is usable, whether users can select a reasonable tradeoff point using our interface, and to what extent we can improve the user experience. To do so, we designed and undertook user studies, described in Section 5.
We are also considering approaches to speculative remote display that introduce server and protocol changes, as well as client changes. We comment on these approaches and on the nature of protocols that seem to be best suited for speculative remote display in Section 6 and conclude in Section 7.
While prediction-based latency hiding has been used in many domains, to the best of our knowledge, ours is the first application of this idea to remote display.
A related domain is multiplayer networked games where each client is responsible for maintaining a private representation of the game state which is updated by local and remote game events. Prediction-based techniques to hide the latency of remote events include dead reckoning [10], and systems that rely on knowledge of game AI implementation to speculatively perform non-critical actions [15]. In contrast to remote display events, game events are both application-specific, and at a much higher semantic level.
There is considerable interest in predicting user behavior within user interfaces. Examples include predicting Unix command-lines [4], and predicting the shapes that a user is drawing in a CAD tool [20]. While our system does predict in part based on past user events, we predict future system actions, not future user actions.
Our work also bears some resemblance to the bountiful work in prefetching for web [14] and file access [8]. However, speculative remote display is not prefetch as it predicts the contents and not the request.
Finally our work can be compared to speculative execution as being explored in the context of both operating systems [22] and distributed systems [6,13,23]. In contrast, our focus is on speculation for a specific system service, remote display, not for the general problem of speculative execution.
Our predictor is a ![]() -th order Markov model. The symbols that the
Markov model operates on are the user or system events as supplied as
human-readable strings. For events that involve bitmap content, we
hash the content, maintain a mapping from the hash back to the actual
content, and use the hash as part of the symbol. A typical event
contains the type of event (e.g., mouse movement) and its parameters
(e.g.,
-th order Markov model. The symbols that the
Markov model operates on are the user or system events as supplied as
human-readable strings. For events that involve bitmap content, we
hash the content, maintain a mapping from the hash back to the actual
content, and use the hash as part of the symbol. A typical event
contains the type of event (e.g., mouse movement) and its parameters
(e.g., ![]() coordinates). A state is the simple
concatenation of the last
coordinates). A state is the simple
concatenation of the last ![]() symbols.
symbols.
Of course, given this simple scheme, the bound on the state space size
of a model is ![]() , where
, where ![]() is the number of distinct input
symbols. Furthermore, because we include parameters in the symbols,
is the number of distinct input
symbols. Furthermore, because we include parameters in the symbols,
![]() can potentially be astronomical. For this reason, our
implementation can constrain the number of states to be between an
upper and lower limit, keeping the most visited states and garbage
collecting the rest when the upper limit is reached.
can potentially be astronomical. For this reason, our
implementation can constrain the number of states to be between an
upper and lower limit, keeping the most visited states and garbage
collecting the rest when the upper limit is reached.
Our implementation supports continuous model fitting and prediction. That is, it can operate on a stream of symbols, updating the model on each new symbol as well as supplying a prediction of the symbol that is most likely to occur next. If there is insufficient information (e.g., we are in a state which currently has no outgoing arcs), then the predictor does not attempt to predict the next state.
At any point in time, the predictor can be asked for an arbitrary number of subsequent events. It will return as many subsequent events as possible, up to that bound. It can return fewer events, however, as it is possible that given the state transitions that have been seen up to the present time, insufficient data may exist to compute an empirical distribution over the states for some number of steps ahead. As a simple example, if we are presently in a state that has not been seen before, no next state can be computed.
Our predictor is implemented in Perl. The core consists of a library of approximately 600 source lines of code. We can use this library online, in which case an additional 250 lines of Perl are included. This online predictor consumes a stream of symbols (and requests for predictions) and produces a stream of vectors of predicted symbols.
Although the choice of Perl may seem odd from a performance perspective, it is important to note that a tool like this spends most of its time in hash table lookups, and that most Markov model update and prediction operations can be implemented with high level constructs (e.g., map). Because of this high level representation, and the fact that Perl's hash implementation is very efficient, we believe that our predictor implementation is not much slower than one written in a low-level language.
We note that other predictors could be applied in this domain, for example, Prediction by Partial Matching (PPM) [3]. As we discuss in Section 4.4, our system allows predictors to be easily plugged in.
A key requirement for speculative remote display is that there be, in practice, a considerable degree of predictability in the user and screen event streams. In the following, we apply the simple Markov model described in Section 2 to the problem of predicting the next screen event from past screen events and from both past screen events and past user events. The system we describe in Section 4 can be configured either way, and our studies in Section 5 use past screen and user events to predict future screen events. We study both the RDP protocol and the VNC protocol. We also briefly comment on predicting future user events from past user events.
We first consider the predictability of screen events in the RDP protocol.
To collect trace data to evaluate our predictor, we instrumented the rdesktop [2] open source RDP client (version 1.4.1) so that it non-intrusively records all user and screen events to files. We then created an experimental testbed consisting of 2 PCs (P4, 2 GHz, 512 MB, 19'' LCD display, Windows XP SP2 (server) or Red Hat Linux EL4.4 (client)) connected via a private 100 mbit network. Notice that this is an ideal remote desktop configuration--network latency and jitter are minimized. To collect a trace, the user sat at one PC and used rdesktop (at 1280x1024 resolution and 24 bit color) to use the other PC. The user performed the following tasks:
Five users participated. They included graduate students and faculty in the EECS Department at Northwestern. The user traces contain 47 to 77 thousand events, while the screen traces contain 712 thousand to about one million events.
We ran the screen and user traces generated by each user through our
online Markov predictor, varying the order of the model and the upper
and lower limits on the number of states in the model. For
screen![]() screen prediction, we simply use the screen trace.
For screen+user
screen prediction, we simply use the screen trace.
For screen+user![]() screen, we merged the screen and user
traces by timestamp, and discarded predictions of user events. For each
combination of trace, order, and limits, the predictor started with no
information at the beginning of the trace and formed its model
progressively as it saw the input symbols. This is identical to how a
predictor in a speculative remote display system would operate.
screen, we merged the screen and user
traces by timestamp, and discarded predictions of user events. For each
combination of trace, order, and limits, the predictor started with no
information at the beginning of the trace and formed its model
progressively as it saw the input symbols. This is identical to how a
predictor in a speculative remote display system would operate.
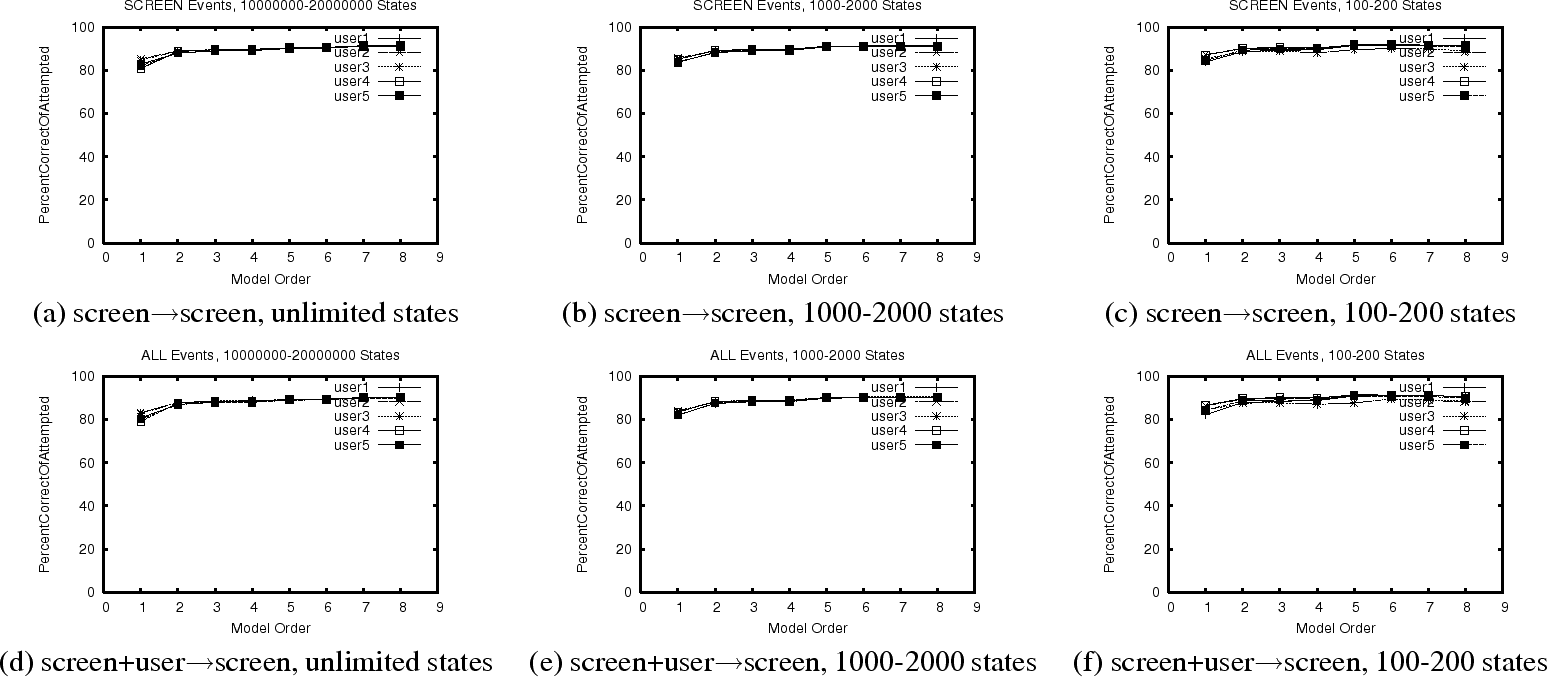
The graphs in Figure 1 show the percentage of
prediction attempts that are successful, as a function of the order of
the model. In (a)-(c), we consider screen![]() screen, with a
progressive limitation on the number of states permitted, while
(d)-(f) considers screen+user
screen, with a
progressive limitation on the number of states permitted, while
(d)-(f) considers screen+user![]() screen with the same
progressive limitation. Each curve corresponds to a particular user.
The key point is that with an practical 1000-2000 state model ((b)
and (e)), over 90% of attempts to predict the next screen event are
successful. If we have seen any transitions out of a state before
(i.e., if we have seen the state before), we almost always predict the
next state correctly. Note including user events in the
input to the predictor is necessary to be able to eliminate the
user event to screen event round trip noted in the introduction.
screen with the same
progressive limitation. Each curve corresponds to a particular user.
The key point is that with an practical 1000-2000 state model ((b)
and (e)), over 90% of attempts to predict the next screen event are
successful. If we have seen any transitions out of a state before
(i.e., if we have seen the state before), we almost always predict the
next state correctly. Note including user events in the
input to the predictor is necessary to be able to eliminate the
user event to screen event round trip noted in the introduction.
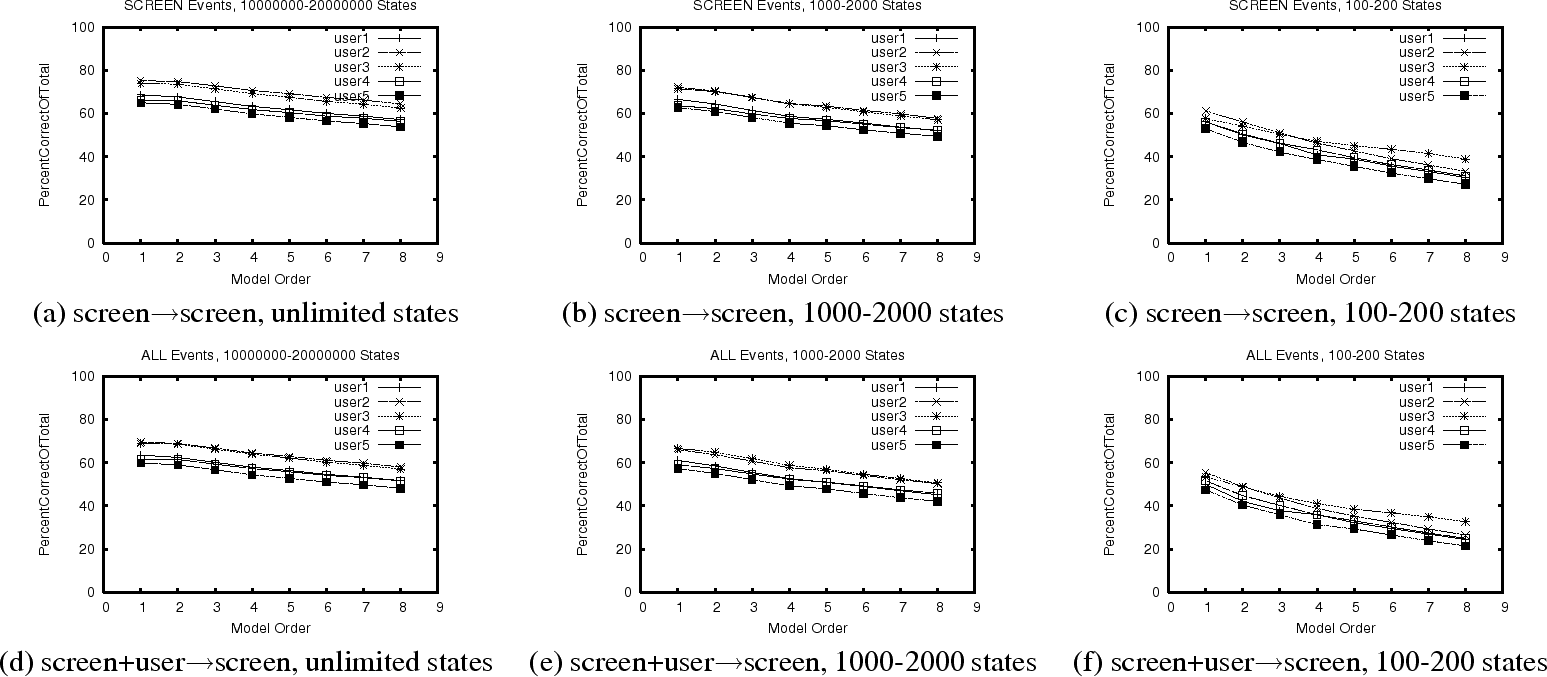
The graphs of Figure 2 correspond exactly to those of the previous figure with the exception being that we are plotting the percentage of all events that are successfully predicted. Remarkably, with our 1000-2000 state model, we are still able to correctly predict over 60% of screen events.
The upshot of Figures 1 and 2 is that we have found that both RDP screen and user events are surprisingly predictable with even an extremely naive predictor.
We are also able to predict 6-8% of user events from past user events, with 60-80% of such predictions being accurate.
We also evaluated the predictability of screen events in the VNC protocol. While VNC's user event model is similar to that of RDP (key and mouse events), it is important to note that VNC's screen event model is much simpler than that of RDP. VNC's model essentially boils down to drawing rectangles of bitmaps to the framebuffer, where the bitmap content is supplied in the message. Many encodings for the bitmap data are possible. Note that in RDP, only about 20% of messages are of this nature.
To collect trace data to evaluate our predictor, we instrumented a VNC [17] client, specifically Real VNC Viewer 4.1.2 for the X window system. We ran the modified viewer on a Linux-based client computer and connected to a Windows XP SP2 server via a private network. Further details about the computer, screen, and network configuration are given in Section 5.2.
Five users participated. They included undergraduates and graduate students in the Computer Science Department at the University of Victoria. The users carried out the same tasks as described earlier. The user traces contain 12 to 24 thousand events, while the screen traces contain 8.5 to 17 thousand events.
Notice that the VNC traces include about 1/2 as many user events and 2 orders of magnitude fewer screen events than the RDP traces. The latter is due to the semantically poorer content of the VNC screen updates. In VNC many drawing commands at the GDI level will be bundled together into a small number of bitmap rectangle updates, while in RDP, the updates sent to the client correspond much more closely to the GDI drawing commands.
Using a presentation that mirrors that of Section 3.1.2, we now show our analysis of the predictability of the VNC traces. We use the same range of model orders (1 to 8) and state size limits (100-200, 1000-2000, unlimited) as before.
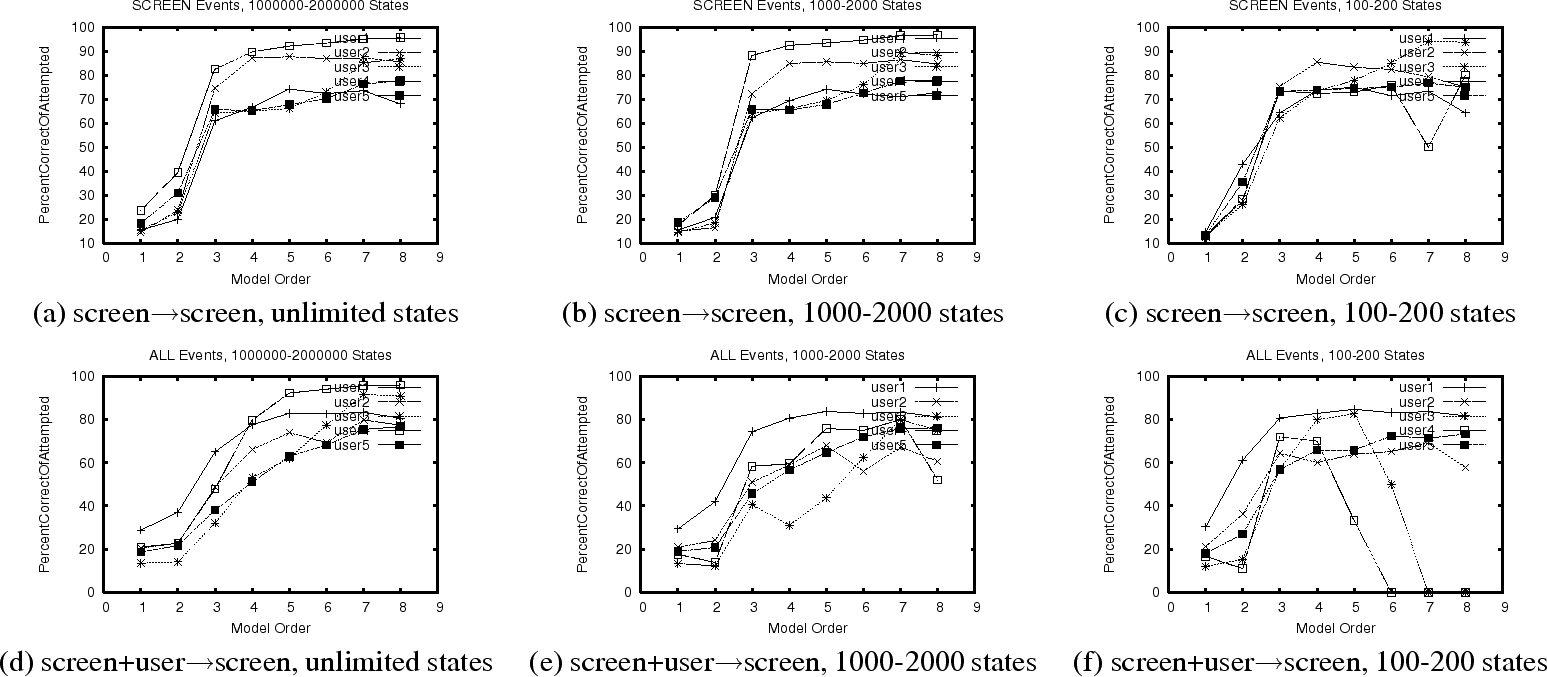
The graphs in Figure 3 show the percentage of
prediction attempts that are successful, as a function of the order of
the model. Figures 3(a)-(c) are for
screen![]() screen, with progressive limitation on the number
of states permitted, while Figure 3(d)-(f)
are for screen+user
screen, with progressive limitation on the number
of states permitted, while Figure 3(d)-(f)
are for screen+user![]() screen with the same progressive
limitation. Each curve corresponds to a particular user. Similar to
the RDP traces (the comparable figure is
Figure 1), we see that, provided a
sufficiently large model (again 1000-2000 states), when we can
predict the next screen event, we are usually successful, although not
quite as successful as in RDP.
screen with the same progressive
limitation. Each curve corresponds to a particular user. Similar to
the RDP traces (the comparable figure is
Figure 1), we see that, provided a
sufficiently large model (again 1000-2000 states), when we can
predict the next screen event, we are usually successful, although not
quite as successful as in RDP.
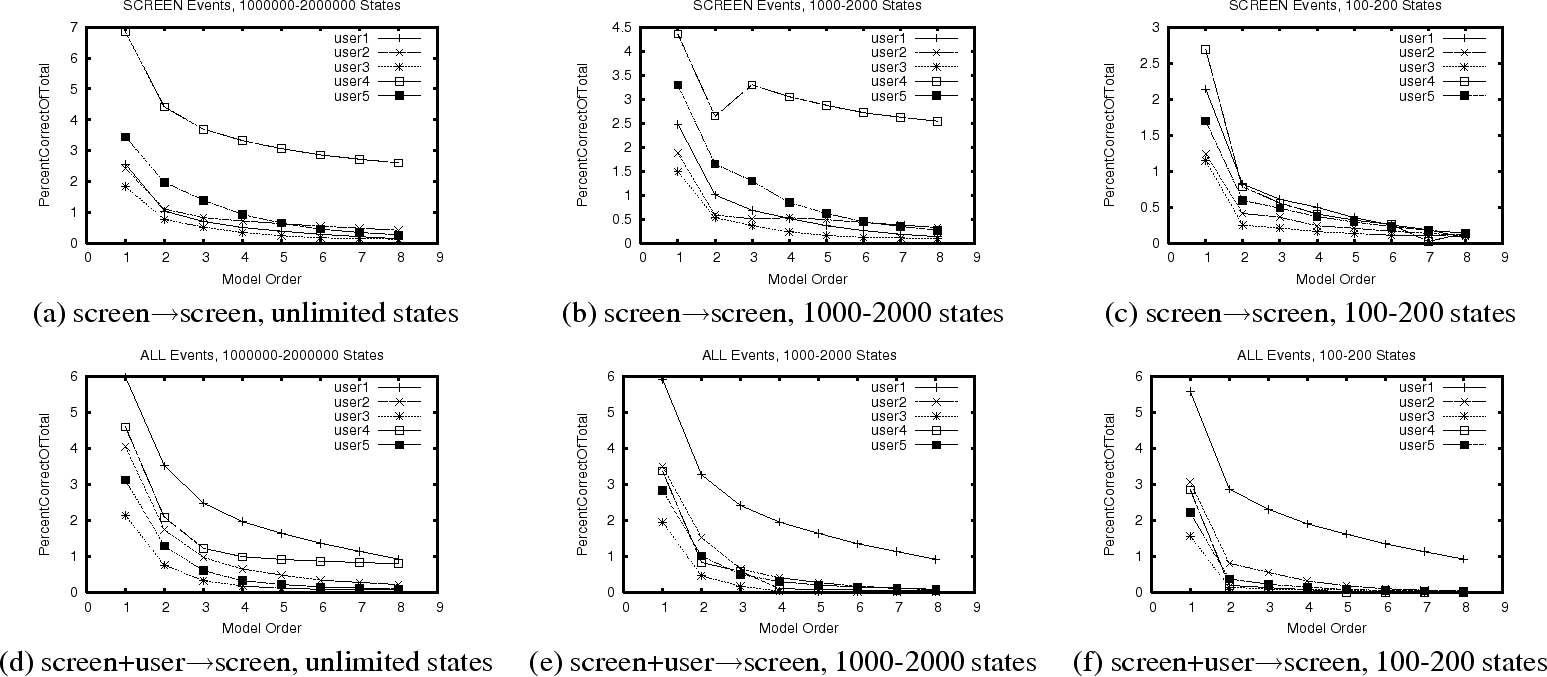
The graphs of Figure 4 correspond exactly to
those of the previous figure, except that here we plot the percentage
of all events that are successfully predicted. The comparable figure
for RDP is Figure 2. For
screen![]() screen (Figure 4(a)-(c)),
the overall predictability of VNC is much worse than that of
RDP. Adding user events to the input
(Figure 4(d)-(f)), slightly increases the
overall predictability. While we predict just as accurately when we
do make a prediction, we have far fewer instances in which we can make
a prediction. This difference seems to derive from two factors.
First, we see far fewer screen events in VNC than we see in RDP. All
other things being equal, the model simply cannot grow as robust with
so much less data. Second, because a VNC screen event contains many
more GDI-level drawing commands, compared to an RDP screen event, the
likelihood that two events will share the same sequence of GDI-level
events (and thus the same bitmap) is lower.
screen (Figure 4(a)-(c)),
the overall predictability of VNC is much worse than that of
RDP. Adding user events to the input
(Figure 4(d)-(f)), slightly increases the
overall predictability. While we predict just as accurately when we
do make a prediction, we have far fewer instances in which we can make
a prediction. This difference seems to derive from two factors.
First, we see far fewer screen events in VNC than we see in RDP. All
other things being equal, the model simply cannot grow as robust with
so much less data. Second, because a VNC screen event contains many
more GDI-level drawing commands, compared to an RDP screen event, the
likelihood that two events will share the same sequence of GDI-level
events (and thus the same bitmap) is lower.
Despite the lower overall predictability of screen events in the VNC protocol, it is important to point out that we do, in fact, see some predictability. With appropriate choices for the model order and the state size limits, 2-7% of screen events can be accurately predicted. With enough states, and most predictions are accurate.
For predicting user events from past user events, we would the overall predictability in VNC is slightly higher than that in RDP.
We now describe the overall design and implementation of a version of
VNC that incorporates client-based speculative remote display.
VNC/SRD consists of the predictor described in
Section 3 and extensions to the Real VNC
Viewer 4.1.2 code base. Our extensions are implemented in ![]() lines of C++. No protocol changes are made. The VNC/SRD client
connects to an unmodified VNC server.
lines of C++. No protocol changes are made. The VNC/SRD client
connects to an unmodified VNC server.
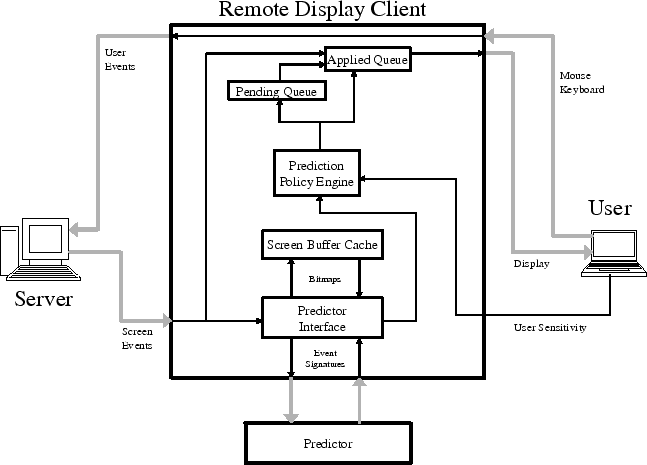
Figure 5 illustrates the design of VNC/SRD. The prediction framework that we have incorporated into VNC intercepts user and screen events, maps them into appropriate event signatures, feeds the signatures to the external predictor, requests predictions as needed, maps predicted event signatures back to screen events, and applies the screen events to change the display. As actual screen events arrive from the server, it also reconciles them with predictions, and repairs the display as needed.
Given the results of Section 3, which show that RDP screen events are generally more predictable than VNC screen events, the reader may wonder why we chose to work in the context of VNC. While we plan an RDP/SRD client based on the rdesktop code base, we chose to design and implement VNC/SRD first because the protocol is much simpler, and requires very little client-side state. The VNC protocol consists of 4 different events, while RDP contains many more. The on-screen result of a VNC event depends only on the event and the current display, while an RDP event's result depends additionally on separate state (essentially a device context), and it causes side effects on that state. The path from event to screen in VNC Viewer is very straightforward, while the rdesktop path is more complex. Furthermore, it is important to note that while we are generally more successful at predicting the next screen event in RDP, individual VNC screen events occur at a much lower rate and generally affect far more pixels. Finally, we note that if client-based speculative remote display is acceptable to users at some prediction error rate, it is surely even better at a lower one.
Intercepting VNC events requires a number of changes to the VNC event handling architecture. By default, VNC streams events through the display client with minimal processing. We changed the implementation to buffer full events before applying them. Buffering the events is necessary for us to validate events against predictions and also to simplify the generation of event signatures. VNC user events are trivially buffered since they consist of only a few parameters--we simply capture them as they are written to the network. VNC screen events, however, are streamed directly to one of a set of decoders which then streams the decoded image directly to the user's framebuffer. To buffer these screen events we redirect the decoder's output to an internal framebuffer that is dynamically created for the incoming event. The internal framebuffer is then forwarded on to be rendered once the event has been fully received.
There is an inherent tradeoff in how the system maps between the semantic information for an event and the symbols that the predictor operates on. This mapping must be maintained by either the predictor or the client. Consider a design that optimizes for the run-time costs of the predictor. In this case the symbols sent to the predictor would need to be as compact as possible. This would require the client to maintain mappings for all the events that it receives, even if many of the mappings will never be used. If we optimized for the run-time cost of the client, we would move the responsibility for mapping to the predictor. This would require transferring all of the event's semantic information to the predictor. In the worst case, this would result in transporting full screen updates to the predictor.
In our implementation, we split the mapping between the client and the predictor. For each event the client generates an event signature that includes any semantic information that can be represented compactly. For VNC, this includes all events, except for the actual pixel data of a screen update. For any information that cannot be compacted, the client stores the original data in a local cache, and adds the cache index to the event signature. The local cache is managed by the client using an LRP (Least Recently Predicted) policy. To apply an event, the event semantics are extracted from the predicted event signature. If the event includes a cache index, the relevant information (e.g., actual pixel data) is extracted from the cache. If there is a cache miss, resulting from an earlier cache eviction, then the predicted event is dropped.
When designing the interface between the display client and the predictor, we wanted to minimize the performance overhead suffered by the client due to additional processing caused by the predictor. At the same time, we wanted to be able to readily plug in different predictors. For these reasons, in our design the predictor runs asynchronously and in parallel to the display client as a separate process connected with a pair of pipes. This allows the client to interface with the predictor using the same mechanisms used to interface with the server, and also to prioritize events from the server over events sent by the predictor. Since all prediction processing is done outside of the client, there is no performance penalty due to the overhead of the prediction engine itself, only for communicating with it. Finally, despite keeping the VNC Viewer code base single-threaded, this design allows us to straightforwardly make use of an unused processor core, if available.
While there are many possible ways to use predictions to improve the performance of a remote display system, we restrict ourselves here to implementations that only affect the client. Furthermore, we focus on two scenarios that are challenging for current remote display implementations:
In both VNC and RDP, network connections are implemented using TCP. This causes a common problem in both scenarios: the message latency the client experiences can be high, and/or highly variable--many screen or user events will take a long time to traverse from client to server, or vice versa. Each message can contain multiple events, and can span multiple packets at the network layer. Packet loss or delay can result in the delay of multiple events. From the perspective of the client, however, the goal is to have user events arrive promptly at the server, and correlated screen events to be returned promptly from the server.
A speculative remote display client uses prediction to overcome the network-induced event latency (and latency variance)--to trade the possibility of screen artifacts for a lower effective event latency (and lower variance). In order to employ a predictor that consumes user and screen events and can produce any number of predicted screen events, a speculative remote display client needs to answer several questions:
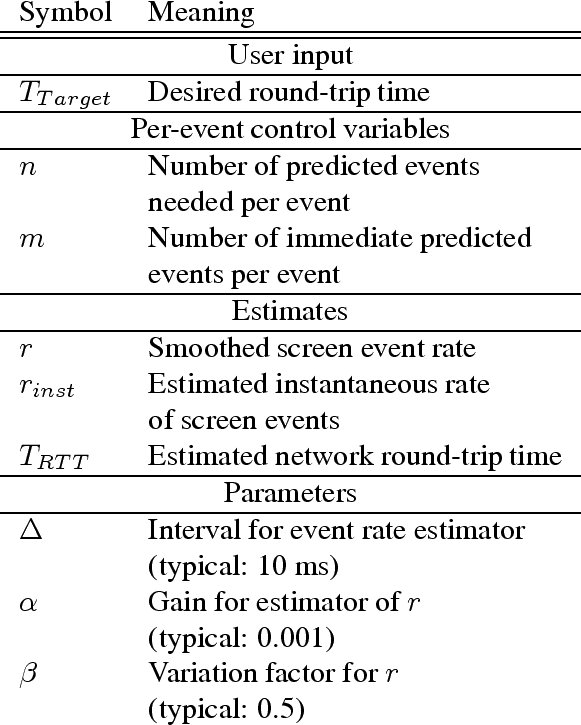
We now describe the policy that we designed, implemented, and evaluated in the context of a purely client-based variant of the VNC system, using the symbols introduced in Figure 6.
The user determines the goal of the system, ![]() , the target
event round-trip time.
, the target
event round-trip time. ![]() can be changed at any time. The
system continually estimates the current event round-trip time,
can be changed at any time. The
system continually estimates the current event round-trip time,
![]() . This can be done using a ping estimate or the TCP RTT
estimate.
. This can be done using a ping estimate or the TCP RTT
estimate.
As screen events flow into the system, it computes an estimate of
their rate, ![]() . Note that the instantaneous screen event rate is
highly dynamic and dependent on user activity. Events can also be
very closely spaced, indeed, the spacing can effectively be zero since
multiple events can be packed into one message. Furthermore, the
mechanisms for resolving time that the operating system makes
available can affect the measurement of the instantaneous rate. For
these reasons, we introduce an interval over which we estimate the
instantaneous rate,
. Note that the instantaneous screen event rate is
highly dynamic and dependent on user activity. Events can also be
very closely spaced, indeed, the spacing can effectively be zero since
multiple events can be packed into one message. Furthermore, the
mechanisms for resolving time that the operating system makes
available can affect the measurement of the instantaneous rate. For
these reasons, we introduce an interval over which we estimate the
instantaneous rate, ![]() . For every
. For every ![]() second window, we
count the number of screen events,
second window, we
count the number of screen events, ![]() , that occur within it,
and estimate the instantaneous event rate as
, that occur within it,
and estimate the instantaneous event rate as
![]() . In
the work reported here, we use
. In
the work reported here, we use ![]() ms.
ms.
We derive a smoothed event rate estimate from these instantaneous
estimates using exponential averaging. This smoothed event rate
estimate is our prediction of the rate of events in the near future.
The smoothed event rate estimate is computed:
Based on our smoothed screen event rate ![]() , we now compute how many
events we must predict on each new event that arrives, in order to
reach the target:
, we now compute how many
events we must predict on each new event that arrives, in order to
reach the target:
We can also consider the system in terms of phase and frequency. Our
estimate ![]() is the frequency at which the system is operating. If
the normal phase of the system is
is the frequency at which the system is operating. If
the normal phase of the system is ![]() , then
, then ![]() is the
phase offset (``advanced phase'') we seek to achieve. In order to do
so, we need to have executed the next
is the
phase offset (``advanced phase'') we seek to achieve. In order to do
so, we need to have executed the next
![]() events
at any point in time. Furthermore, we need to be able to continue to
execute events at rate
events
at any point in time. Furthermore, we need to be able to continue to
execute events at rate ![]() , regardless of whether they are predicted
or server-provided events.
, regardless of whether they are predicted
or server-provided events.
It is important to note that in our system predictions are produced in
response to events, including screen events. This implies that a
variation in message (and thus event) latency results in variation in
the number of available predictions at any point in time. A long
delay in receiving a new screen event means a long delay in producing
predictions for events subsequent to it. Such a delay can result in
an ``underrun'' of available predictions. We address such underruns
(and the inability to make all needed predictions in some situations as
described earlier) by requesting additional predictions on each event.
In particular, we request ![]() predictions on each event. In
our studies,
predictions on each event. In
our studies, ![]() .
.
The first ![]() predictions are immediately applied to achieve the
desired
predictions are immediately applied to achieve the
desired ![]() , while the remaining
, while the remaining ![]() predictions are
kept in reserve in case predictions cannot be produced at the target
rate
predictions are
kept in reserve in case predictions cannot be produced at the target
rate ![]() in the near future.
in the near future.
The system maintains two queues for predicted screen events. A validation queue to track applied predictions and to enable error correction, as well as a pending queue to prevent prediction underruns. The queues are kept totally ordered by a (locally generated) event sequence number.
The validation queue stores those predicted screen events that have already been drawn to the screen. The predicted event at the head of the queue is the next event expected from the server. If an event from the server arrives and matches the predicted event at the head of the validation queue, the predicted event is removed from the queue and discarded (the prediction was correct). If the actual event does not match the predicted event then the system enters the error correction state. We discuss this state and its handling in Section 4.7.
The pending queue stores predictions that have not yet been
applied. Predicted events are drained from the pending queue at rate
![]() , at which time the drained event is applied and placed in the
validation queue.
, at which time the drained event is applied and placed in the
validation queue.
On every event that produces the ![]() predictions described
in Section 4.5,
predictions described
in Section 4.5, ![]() of them are immediately drawn and
placed into the validation queue. The
of them are immediately drawn and
placed into the validation queue. The ![]() ``extra'' predictions
are placed into the pending queue. Note that every new group of
``extra'' predictions
are placed into the pending queue. Note that every new group of
![]() predictions overlaps in
predictions overlaps in ![]() places with the previous group of
predictions. Several cases result from pairs of such overlapping
events:
places with the previous group of
predictions. Several cases result from pairs of such overlapping
events:
When the predicted and drawn event at the head of the validation queue is invalidated by the arrival of an actual screen event from the server, we know that the screen being displayed to the user is incorrect and we must repair it. There are numerous ways to do such a repair. Our system currently implements a simple, out-of-band approach.
On an invalidation, we know that the head event is wrong, and all subsequent events in the validation queue are suspect. Furthermore, even if a subsequent event is in fact correctly predicted, it can depend on the now incorrect screen state produced by the head event, and thus have resulted in an incorrect update of the screen. We thus consider all of the subsequent predicted events to be incorrect.
Predicted events in the pending queue are simply discarded. Nothing more needs to be done, as these events had not yet been drawn to the screen.
We compute a bounding rectangle over all of the events in the validation queue and request an update for that rectangle from the server. The events in the validation queue are then discarded. Although we do not implement it, it is clear that another approach would be to have a true undo log in the client that would permit entirely local rollback of the screen state.
The update we request from the server results in one or more screen events asynchronously being returned from the server. Currently, we do not handle these actual screen events in any special way. To do so would require that we modify the VNC protocol to indicate that the request is of a special type, and that the server response would include that type. For example, a ``for repair'' flag could be added to the request and the server could be modified to replicate this flag to any screen event it sends in response. In this paper, we focus on approaches to speculative remote display that require only client-side changes to existing systems. As we discuss in Section 6, we are exploring joint client/server speculative remote display protocols that enable this and several other optimizations.
In any speculative remote display system, the screen is allowed to
become temporarily incorrect. Outside of having an oracle for a
predictor, there is a tradeoff between the target RTT (![]() )
goal and the degree of temporary screen artifacts introduced by bad
predictions.
)
goal and the degree of temporary screen artifacts introduced by bad
predictions.
We have repeatedly found that user satisfaction with any specific systems software configuration or choice of parameters exhibits high variation, and that this variation can be exploited [5,11]. Hence, we believe the tradeoff in this system should be made on an individual basis. Other researchers have also considered the effectiveness of putting the end user in direct control of systems-level decisions [21].
How do we let the individual user trade off between responsiveness and
noise? In our system, we allow the user to set ![]() directly,
from
directly,
from ![]() to
to ![]() . The only extension to the VNC interface, is a
simple gradient display representing the range of choices. The
gradient floats above the VNC display on the right hand side of the
screen . The display indicates the current choice by a bar and the
current
. The only extension to the VNC interface, is a
simple gradient display representing the range of choices. The
gradient floats above the VNC display on the right hand side of the
screen . The display indicates the current choice by a bar and the
current ![]() number. The user can change the tradeoff at any
time simply by clicking or dragging on the gradient.
number. The user can change the tradeoff at any
time simply by clicking or dragging on the gradient.
We evaluated VNC/SRD by conducting two user studies.
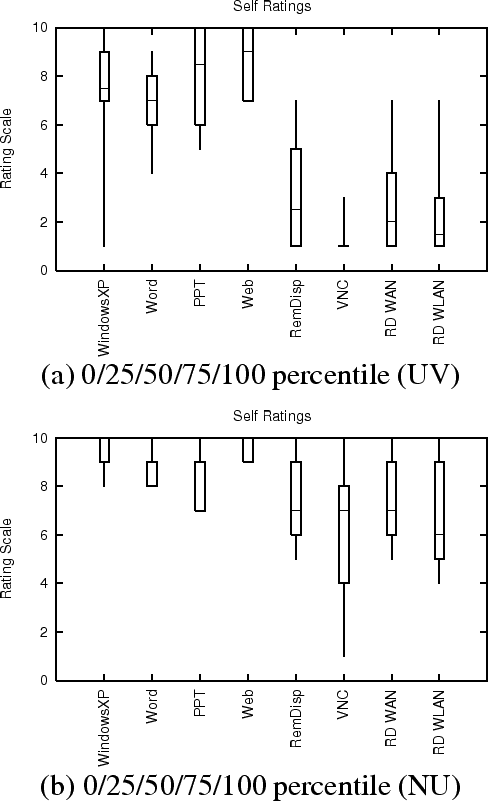
We conducted parallel user studies in the CS department at the University of Victoria (UV) and the EECS department at Northwestern University (NU). Our users consisted of six students at UV and seven students at NU, who were recruited via posters and email. As part of each study, the user rated his familiarity, on a 1-10 (10=most familiar) scale, with the OS and applications used in the study. Each user also rated his familiarity with remote display systems in general, their use in WAN and wireless environments, and with VNC specifically. This survey information summarizing the relevant background of our users is provided in Figure 7.5 Each user contributed approximately 90 minutes of his time. Users were not compensated.
Both the UV and NU testbeds consisted of two machines (client and server) on a private network. At UV, each machine had an AMD Athlon 64 3500 series processor running at 2.2 GHz, 2 GB of RAM, and an NVIDIA 8800GTX graphics card running at 1280x1024 with 32 bit color. The monitors were 19 inch LCD displays. At NU, each machine had a 2.0 GHz Intel P4, 512 MB of RAM, and a Matrox G550 graphics card at 1600x1200 with 32 bit color driving a 20 inch LCD display. The user interacted solely with the client machine which ran Linux (Ubuntu ``Gutsy Gibbon'' version 7.10) and our VNC/SRD client. On the client machine, we used the netem extension of the iproute2 networking implementation in the Linux 2.6 kernel to allow controlled network conditions. The server machine ran Windows XP SP2 and an unmodified Real VNC server. Microsoft Office 2003 was installed on the server machine, as was Firefox 2.0.
Each user was presented with VNC/SRD running in full-screen, 24 bit mode, which, for the applications in our studies, is visually indistinguishable from using Windows XP natively. Superimposed at the lower right of the display was small grayscale slider described in Section 4.8. During the studies they were instructed to manipulate the slider as needed to make the system comfortable for them.
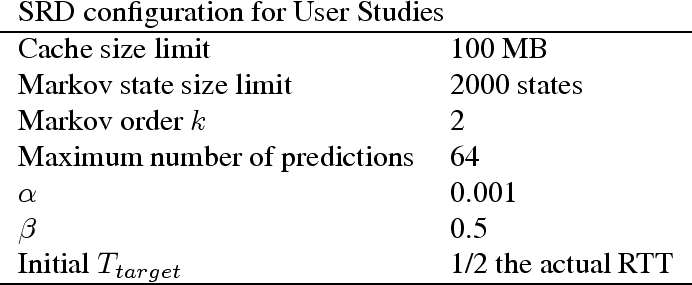
Figure 8 shows the parameters used to configure
VNC/SRD in our studies. The cache size was set to 100 MB and the
predictor limit was set to 2000 states. ![]() was chosen based on the
predictability study of Section 3, while
was chosen based on the
predictability study of Section 3, while
![]() and
and ![]() were chosen based on author experience with the
system. Although it would be ideal to study the sensitivity of the
choices for
were chosen based on author experience with the
system. Although it would be ideal to study the sensitivity of the
choices for ![]() ,
, ![]() ,
, ![]() and the memory limits of the cache
and model, it's important to note that each individual data point in
our work represents about two hours of proctor time.
and the memory limits of the cache
and model, it's important to note that each individual data point in
our work represents about two hours of proctor time.
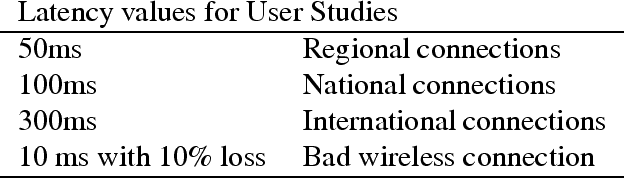
In our studies, we consider four different networking scenarios, as illustrated in Figure 9. Three of these scenarios represent increasing network latencies, while the fourth represents a wireless scenario with moderate loss. Note that as VNC communicates with TCP, the high loss rate scenario also represents one where the effective bandwidth is low.
A user in each of our studies performed the following tasks:
The original documents for the Word and Powerpoint tasks were supplied by us and were the same for all users. Word and Powerpoint ran in full screen mode. The users were not required to finish duplicating the document, only to get as far as they were comfortably able. For the web browsing task, the article and search windows were tiled side by side on the screen.
After each scenario-application pair, the user was asked to answer each of the following:
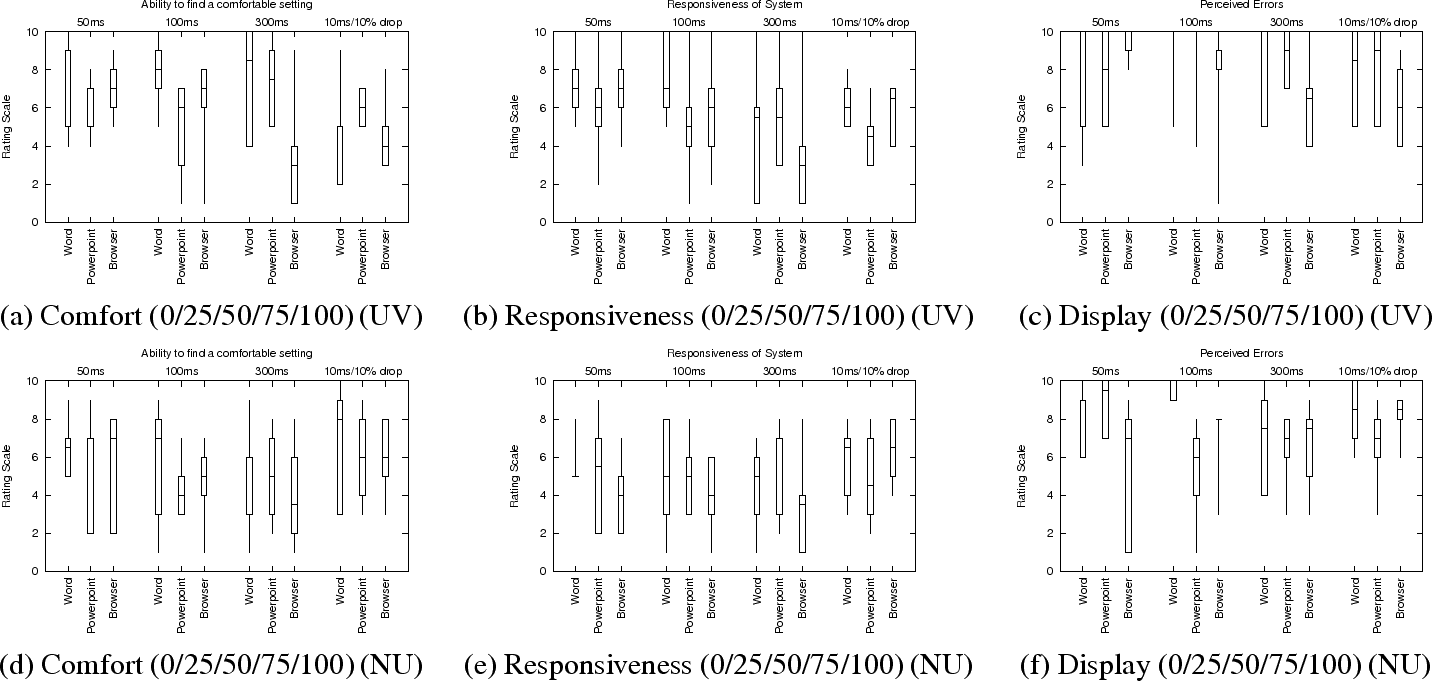
Figure 11 summarizes user responses to the three statements given in the preceding section. Figures 11(a)-(c) give the results for UV, while Figures 11(d)-(f) give the results for NU. The results are shown using Box plots where the whiskers correspond to minimum and maximum. The results shown in each individual figure are grouped first by the network scenario (which are arranged roughly in order of increasing latency) and second by the application. For example, Figure 11(a) summarizes UV user responses to ``I was able to find a setting on the scale that was comfortable'' (1 (Strongly Disagree) to 10 (Strongly Agree) (5=Neither)). The first three ranges in the graph correspond to user responses for the Word, Powerpoint, and Browsing tasks, all at 50 ms latency. The next three ranges are the same applications at 100 ms, and so on.
The data indicates that the majority of users tend to view the display artifacts as acceptable (Figures 11(c) and (f)). User perception of responsiveness, however, is highly variable (Figure 11(b) and (e)). For most scenario and application combinations, the majority of users registered agreement that to some extent that they were able to find comfortable settings.
The primary issue with our studies, beyond their scale, is that there were not many instances where predictions were made, and thus the probability of prediction errors and screen artifacts was reduced. This is due to two factors. First, as we noted in Section 3.2, VNC screen event traffic exhibits only a small amount of predictability, much less than RDP screen event traffic. Second, our study design avoids ordering effects by, in part, creating a new model on each network/app scenario. However, this means that there are not as many past events on which predictions can be based, reducing the rate of predictions.
The users at NU were more familiar with remote display systems, and VNC in particular, than those at UV (Figure 7). The UV users generally found VNC/SRD's responsiveness to be closer to the computer they were most familiar with than did the NU users (Figure 10). This is likely due to the performance difference between the testbeds.
We have so far described a design for a client-based speculative remote display system that allows a user to choose a desired message latency. As we described earlier, we use a Markov model-based predictor to generate predictions from repeated event sequences. However we note that there are many possible alternatives for incorporating event prediction into a display client.
Another design option is further pre- and post-processing of event data. For example, currently, event locations are absolute coordinates, so two events are considered different if their locations differ by a single pixel, even if their actions are identical. Using differencing would be one method of handling this discrepancy.
There are also many alternatives in regards to the prediction application policy. Our current design tracks the event arrival times but does not use them in the predictor or the policy decisions. A design that incorporated this information could use the Markov model to predict specific events and then use an estimator of some kind to determine at what time it should apply each of the predicted events. Such a scenario would allow a user to specify more precisely how far into the future they want the system to predict.
Currently our system uses a very simplistic mechanism for error recovery that involves retransmitting all the regions that were changed before an error was detected. We already mentioned that a simple undo-log to handle rollback would further improve performance, however there are other aspects of this problem to consider. We currently measure the user's tolerance of errors to control the aggressiveness of our prediction policy. However, this measurement could also be used to control an error correction policy. For instance, we could determine the error threshold that a user is willing to tolerate and enter error correction only when this threshold is exceeded. We could also selectively correct errors instead of correcting everything at once. For instance we could prioritize errors based on the number of pixels and the screen location.
This paper introduced the idea of client-based speculative remote display, in which the client predicts and speculatively executes screen update events in order to ameliorate the high latencies and high loss rates seen on wide area and wireless networks, respectively. To evaluate the concept, we studied the predictability of Windows Remote Desktop (RDP) and VNC traffic, finding predictability in both, although much more in RDP than VNC. We developed a prototype speculative remote display client for VNC. VNC/SRD works without server or protocol modifications, and gives the user an interface through which he can adjust the tradeoff between the aggressiveness of predictions (and thus effective reduction in latency) and the incidence of display artifacts. Two user studies were conducted to measure the usability of the system. The predictability studies, analysis of VNC/SRD's design, and the usability studies, argue for the feasibility of the speculative remote display concept, but raise a range of new questions regarding the structure of a speculative remote display system and protocol that we plan to address in the future.
This effort was funded in part by the National Science Foundation under award CNS-0720691. Lange was funded by a Symantec Research Labs Fellowship.