|
USENIX 2006 Annual Technical Conference Refereed Paper
[USENIX 2006 Annual Technical Conference Technical Program]
LADS: Large-scale Automated DDoS
detection System
Vyas Sekar*,
Nick Duffield+, Oliver Spatscheck+,
Kobus van der Merwe+ , Hui
Zhang*
*Carnegie
Mellon University
+AT&T
Labs-Research
Abstract:
Many Denial of Service attacks use brute-force bandwidth flooding of
intended victims. Such volume-based attacks aggregate at a target's
access router, suggesting that (i) detection and mitigation are best
done by providers in their networks; and (ii) attacks are most readily
detectable at access routers, where their impact is strongest.
In-network detection presents a tension between scalability and
accuracy. Specifically, accuracy of detection dictates fine grained
traffic monitoring, but performing such monitoring for the tens or
hundreds of thousands of access interfaces in a large provider network
presents serious scalability issues. We investigate the design space
for in-network DDoS detection and propose a triggered, multi-stage
approach that addresses both scalability and accuracy. Our
contribution is the design and implementation of LADS ( Large-scale Automated DDoS
detection System). The attractiveness of this system lies in
the fact that it makes use of data that is readily available to an ISP,
namely, SNMP and Netflow feeds from routers, without dependence on
proprietary hardware solutions. We report our experiences using LADS
to detect DDoS attacks in a tier-1 ISP.
1 Introduction
The last few years have seen a steady rise in the occurrence and
sophistication of distributed denial of service (DDoS) attacks. Armies
of botnets comprised of compromised hosts can be utilized to launch
attacks against specific Internet users such as enterprises, campuses,
web servers, and homes. In this paper, we focus on an important class
of DDoS attacks, namely, brute force flooding attacks. We observe that
access links are typically the bottlenecks for most Internet users, and
that attackers can easily send sufficient traffic to exhaust an
user's access link capacity or overload the packet handling capacity
of routers on either end of the link [9].
Brute force flooding attacks are easy for attackers to launch but
are difficult for targeted users to defend, and therefore represent a
threat to Internet users and services. Given the limited capacity of
most access links on the Internet, a successful DDoS attack needs to
involve a relatively small number of attack sources. In addition, the
size of some reported botnets [27] suggests that a
determined attacker might be capable of overloading even the largest
access links. From a user's perspective, a bandwidth attack means its
in-bound capacity is exhausted by incoming attack traffic. Given that
a user often controls only one end of the access link, for example via
a Customer Equipment or CE router (see Figure 1), while its ISP controls
the other end (referred to as C-PE, or Customer-Provider Edge router),
once an access link is overloaded there is precious little that the
target of the attack can do without the assistance of its ISP. In
fact, automated DDoS detection and mitigation mechanisms originating
from the customer side of an access link become useless once the access
link itself is overloaded.
Figure 1: Components of
a Provider Network
 |
For such brute-force bandwidth attacks, we reason that a very
promising architecture is one that performs in-network
detection and mitigation. While it is possible for individual
customer networks to deploy detection mechanisms themselves, several
practical constraints arise. Small to medium-sized enterprise
customers typically possess neither the infrastructure nor the
operational expertise to detect attacks, as it is not cost-effective
for them to deploy and manage dedicated monitoring capabilities.
Also, the customers' limited resources (human and network) are
already substantially overwhelmed during DDoS attacks. Further,
detecting attacks at the edge will have little or no effect unless
the upstream provider takes appropriate actions for attack mitigation.
Network providers on the other hand already possess the monitoring
infrastructure to observe and detect attacks as they unfold. Also,
since it is upstream of users' access links, an ISP can help customers
defend against bandwidth attacks by deploying appropriate filtering
rules at routers, or alternatively using routing mechanisms to filter
packets through scrubbers [8] to drop malicious
packets. In this paper, we focus on in-network detection of DDoS
attacks. The challenge is to come up with a solution that satisfies
multiple competing goals of scalability, accuracy, and
cost-effectiveness.
We propose a triggered, multi-stage infrastructure for detection
and diagnosis of large-scale network attacks. Conceptually, the
initial stages consist of low cost anomaly detection mechanisms that
provide information to traffic collectors and analyzers to reduce the
search space for further traffic analysis. Successive stages of the
triggered framework, invoked on-demand and therefore much less
frequently, then operate on data streams of progressively increasing
granularity (e.g., flow or packet header traces), and perform analysis
of increasing computational cost and complexity. This architecture fits
well with the hierarchical and distributed nature of the network. The
early stages require processing capabilities simple enough to be
implemented in a distributed fashion for all customer-facing
interfaces. The later, more sophisticated, processing capabilities can
be more centralized and can thus be shared by many edge routers.
We have designed and implemented an operational DDoS detection
system called LADS, based on this triggered multi-stage architecture,
within a tier-1 ISP. Our system makes use of two sources of data:
SNMP and Netflow, both of which are readily available in commercial
routers today. We adopt a two-stage approach in LADS. In the first
stage, we detect volume anomalies using low-cost SNMP data feeds
(e.g., packets per second counters). These anomalies are then used to
trigger flow-collectors that obtain Netflow records for the appropriate
routers, interfaces, and time periods. We then perform automated
analysis of the flow records, using uni-dimensional aggregation and
clustering techniques, to generate alarm reports for network operators.
There are several natural advantages to our approach, in terms of
deployment cost, detection coverage, and manageability. Providers
incur little or no additional deployment and management costs,
because we use data sources that are readily available, and the
infrastructure to instrument and manage the data feeds is typically
already in place. Our system provides a low-cost solution for
ubiquitous deployment across thousands of customer interfaces, as it
does not rely on proprietary hardware solutions. In order to minimize
the number of hardware monitoring devices, and hence cost, providers
deploy commercial monitoring solutions at selective locations in the
network (for example, in the core and at peering edges). Such an
infrastructure is likely to miss smaller attacks which, while large
relative to the targeted interface, are small amongst aggregate traffic
volumes in the core. In contrast, our system has ubiquitous monitoring
but no additional cost, and can perform anomaly detection considering
both traffic volume and link speed for all customer-facing interfaces.
2 Related Work
The spectrum of anomaly detection techniques ranges from
time-series forecasting (e.g., [5,26]) and signal processing
(e.g., [4]), to
network-wide approaches for detecting and diagnosing network anomalies
(e.g., [19,34]). These approaches
are intended for detecting coarse-grained anomalies, which are
suitable for use as initial stages in a triggered approach for
scalable DDoS detection.
Also related to our multi-stage approach are techniques for fine
grained traffic analysis. These include techniques for performing
detailed multi-dimensional clustering [11,32] and solutions
for online detection of heavy-hitters and attacks using counting
algorithms and data structures [35,17,12].
Moore et al. [24]
observed that many types of attacks generate backscatter traffic
unintentionally. Network telescopes and honeypots [30] have also been used to
track botnet and scan activity. Some early DoS attacks used source
address spoofing to hide the sources of the attacks, and this
motivated work on IP traceback (e.g., [28,29,6]).
There are several commercial DDoS detection systems (e.g., [2,22]) available today. Since these
rely on proprietary hardware and algorithms, we cannot evaluate the
differences between the algorithms used in LADS and these commercial
systems. There are, however, two qualitative architectural advantages of
LADS over these systems. The first issue is one of deployment cost.
To provide diagnostic capabilities and detection coverage across all
customer interfaces, similar to LADS, providers would have to deploy
proprietary hardware devices covering every customer-facing interface
and thus incur very high deployment costs. In contrast, LADS uses
existing measurement feeds, providing a significant reduction in
deployment and management cost for providers. The second issue is one
of scale - dealing with large-scale data feeds from thousands of network
monitors. We use a triggered approach to scale down the collection and
computation requirements of large-scale attack investigation. We are
not aware of any existing work or commercial product which addresses
problems at this scale.
Solutions for mitigating DDoS attacks often rely on infrastructure
support for either upstream filtering (e.g., [21]), or use network overlays
(e.g., [16]).
Capabilities-based approaches (e.g., [33]) focus on re-designing
network elements to prevent flooding attacks. End-system solutions
for handling attacks combine Turing tests and admission control
mechanisms (e.g., [15,25]) to deal with DDoS attacks.
Reval [31] helps
network operators to evaluate the impact of DDoS attacks and
identify feasible mitigation strategies in real-time. Mirkovic and
Reiher [23]
provide an excellent taxonomy of DDoS attacks and defenses.
The use of triggers for scalable distributed traffic measurement
and monitoring has been suggested in ATMEN [18] and by Jain et
al. [13]. While
scalability using triggered monitoring is a common theme, our
contribution is the use of triggered framework for DDoS detection using
heterogeneous data sources.
3 Scalable In-Network DDoS Detection
Having argued for the necessity of in-network DDoS detection (and
mitigation), we now consider the implications of this approach for
building a detection system in a large provider network. Like any
anomaly detection system the main requirement is accuracy, i.e.,
having a low false alarm and miss rate. The second requirement is
timeliness: to be of practical value a detection system should provide
near real time detection of attacks to allow mitigation mechanisms to
be applied. Third, the system should cover all (or most) customers of a
provider. The number of customers could range from a few hundred for
small providers to hundreds of thousands for very large providers.
These requirements have significant system scalability implications:
(i) Is it feasible to collect information that is detailed enough to
allow attack detection on a per-customer basis? (ii) Is it feasible to
perform in timely fashion the processing involved with the detection
on a per-customer basis?
3.1 Triggered Multistage DDoS Detection
There are two sources of complexity for large-scale attack detection
and diagnosis: Collection and Computation. The
collection complexity arises from the fact that data streams have to be
selected from monitoring points (links/routers), and either transported
to an analysis engine (possibly centralized) or provided as input to
local detection modules. The computation complexity arises from the
algorithms for analyzing the collected data, and the sheer size of the
datasets. We observe that not all detection algorithms have the same
complexity: the differences arise both from the type of data streams
they operate on and the type of analysis they perform.
Consider two types of data streams that are available from most
router implementations: simple traffic volume statistics that are
typically transported using SNMP [7], and Netflow-like [3] flow records. Enabling
the collection of these two measurements on routers incurs
significantly different costs. There are three main cost factors: (i)
memory/buffer requirements on routers, (ii) increase in router load due
to the monitoring modules, and (iii) bandwidth consumption in
transporting data-feeds. SNMP data has coarse granularity, and the
typical analysis methods that operate on these are lightweight
time-series analysis methods [5,26,4]. Flow-level data contains
very fine grained information, and as a result is a much larger dataset
(in absolute data volume). It is easy to see that the flow data does
permit the same kind of volume based analysis that can be done with
the SNMP data. However, the flow data is amenable to more powerful and
fine-grained traffic analysis [11,32] which can
provide greater diagnostic information.
Figure 2: Triggered
Multistage DDoS Detection
 |
The presence of heterogeneous data sources which offer varying
degrees of diagnostic abilities at different computation and collection
costs raises interesting design questions. At one extreme we could
envision running sophisticated anomaly detection algorithms on the
fine granularity data (i.e., Netflow) on a continuous basis. The other
extreme in the design space would be an entirely light-weight mechanism
that operates only on the coarse-granularity data. Both these extremes
have shortcomings. The light-weight mechanism incurs very little
computational cost, but lacks the desired investigative capabilities
that more fine-grained analysis can provide. The heavy-weight
mechanism, on the other hand, incurs a much higher collection and
computation cost. Further, the heavy-weight mechanism may be operating
in an unfocused manner, i.e., without knowledge about the
seriousness of the incidents that actually need operators' attention.
Operating in such a setting is detrimental to not only the scalability
(due to high collection and computation complexity), but also the
accuracy (the false alarm rate may be high).
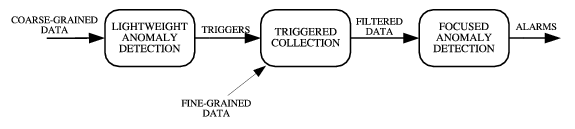
Our work attempts to find an operationally convenient space between
these extremes. The key idea in our approach is to use possible
anomalous events detected in coarse grained data close to the
attack target, to focus the search for anomalies in more
detailed data. A simple but powerful observation, is that close to
the attack target, e.g., at the customer access link, detecting
flooding attacks using coarse-grained data becomes reasonably easy.
Even though such coarse-grained indicators might generate false alarms
and lack the ability to generate useful attack reports, they can be
used to guide further, more fine-grained, analysis. Based on this
insight, we propose a triggered multistage detection approach
(Figure 2) in which
the successive stages can have access to and operate on data streams of
increasing granularity. A triggered approach helps focus collection
and computation resources intelligently - performing inexpensive
operations early on, but allowing sophisticated, data and compute
intensive tasks in later stages.
While our approach generalizes to any number of detection stages,
the system described in this paper is limited to two stages. We briefly
describe our methods as well as other potential alternatives for each
stage.
As the name suggests the key constraint here is that the method not
require significant processing so that it can be applied to a large
number of interfaces. Since the output of this stage triggers more
detailed analysis in the second stage, false positives are less of a
concern than false negatives. A false positive from the first stage
will only cause more unnecessary work to be done in the second stage,
and hence not necessarily much of a concern for the operator who only
sees the final alarms after the second stage. However, a false
negative is a more serious concern as the attack might be missed
altogether.
Volume anomaly detection: Traffic anomalies on volume and
link utilization data available from egress interfaces are often good
indicators of flooding attacks. Traffic metrics that are available from
most current router implementations include the traffic volume (either
in bytes per second or packets per second), router CPU utilization,
and packet drop counts. Our approach (described in Section 4.1) involves the use of traffic
time-series modeling to predict the expected future load on each
customer-facing interface. These prediction models are then used to
detect significant deviations to identify future volume anomalies.
Using traffic distribution anomalies: Lakhina et al. [20] discuss the use of
distributions (using entropy) for diagnosing anomalies in networks.
The key insight behind their work is that many attacks can be identified
by substantial changes in traffic distributions, specifically the
distribution across source and destination addresses and ports.
While the use of distribution information in [20] was suggested as a
means for augmenting volume-based anomaly detection, we can use
distribution anomalies as triggers for further analysis. The use of
such metrics in a triggered approach may not necessarily reduce the
collection cost, since measuring these metrics may need access to
very fine-grained traffic information.
Even though our triggered approach will reduce the search space for the
second stage significantly, the scale of the problem is such that the
computational overhead remains a concern. The other key requirements
are accuracy, and the ability to generate useful incident reports for
network operators.
Rule-based detection: Some DDoS attacks have distinct
characteristics that can be easily captured with a small set of
detection rules. For example, a large number of single-packet flows
(e.g., ICMP-ECHO or TCP-SYN) sent to a single destination IP address is
often indicative of a DDoS attack. Another option is to use botnet
blacklists to check if the set of source addresses that occur
frequently in the traffic belong to known compromised machines
(commonly referred to as zombies) used for launching attacks.
Rule-based approaches have near-term appeal since they typically have
low false-positive rates, even though their detection capabilities are
limited to the set of attacks spanned by the rule-sets.
Uni-dimensional aggregation: Our specific implementation for
the second stage involves the use of uni-dimensional hierarchical
aggregation algorithms. Conceptually, uni-dimensional clustering
attempts to discover heavy-hitters along source/destination prefixes,
using a thresholding scheme to compress reports along the prefix
hierarchy. Since the computational overhead with performing
uni-dimensional aggregation is low, and the functionality provided is
sufficient for investigating most known types of DDoS attacks we
choose this approach. Our implementation, which is a combination of
uni-dimensional clustering and rule-based approaches, is described in
Section 4.2.
Multi-dimensional clustering: Multi-dimensional clustering
provides another alternative for fine-grained analysis [11,32]. The basic theme
of these approaches is to abstract the standard IP 5-tuple (srcaddr,
dstaddr, protocol, srcport, dstport) within multi-dimensional
clustering techniques to report traffic patterns of interest.
Typically, the complexity of the algorithm can be reduced by tuning
the technique to report only interesting clusters, those that either
have a high volume or those that have a significant deviation from an
expected norm.1
The benefits of our triggered approach are as follows:
Detecting high-impact attacks: Since our triggers are
generated close to the customer egresses, we are more likely to detect
attacks that actually impact the end-user. Note that this is in
contrast to more centralized approaches, even those that work on more
fine-grained data feeds.2 For
example, by monitoring SNMP byte counts on a T1 access link it is
straightforward to determine when the link is being overloaded. Looking
for the same information from a different vantage point, e.g., at a set
of major peering links is a much more challenging task. Not only could
the traffic flowing towards the T1 interface be spread across many such
peering interfaces, but the traffic will be hidden inside an
overwhelming amount of background traffic on the peering links.
Efficient data collection: SNMP data is lightweight enough that
it can be collected on the access routers without imposing significant
load. Netflow data, on the other hand, can be more efficiently
collected at more powerful and better-provisioned core routers so that
access routers are not burdened with this more expensive process.
Reduced computation cost: We use high cost operations and
expensive algorithms in a focused manner, and also significantly reduce
the data volumes that the expensive operations need to handle.
Low operational complexity: The different stages are simple and
easy to understand, and vendor-independent, and managing the operation
should be relatively simple. More importantly, our implementation works
with data streams that are already available to most provider networks.
Deploying LADS does not incur any overhead in terms of instrumenting
new monitoring capabilities or deploying special hardware for data
collection and analysis.
Near real-time incident reports: Since the computational
complexity is significantly reduced, we can operate the system in near
real-time, without relying on specialized hardware or data structure
support.
Flexibility: Our approach is flexible in two aspects. First we
can easily accommodate other data streams as and when they are
available. Second, within each stage the performance and algorithms can
be optimized to reach desired levels. For example, our first stage
trigger currently uses simple time-series volume anomaly detection. It
is fairly easy to augment this step with other data streams and
traffic metrics, or alternatively use other anomaly detection methods
for the same dataset.
In our approach, there are four potential pitfalls. The first pitfall
is one relating to possible undesirable interactions between the
trigger stage and the detailed analysis stage. While our approach
allows for each component to be optimized in isolation, optimizing the
overall system performance would require a detailed understanding of
the interfaces and interactions between different components. Managing
and optimizing such multi-component systems is inherently complicated -
we believe our specific implementation is based on a clean set of
interfaces between components which are sufficiently decoupled, and
hence has very few, if any, undesirable interactions.
The second, more serious problem, is one of misses due to the
triggered approach. While the low-level triggers reduce the collection
and computation complexity, they may be doing so by compromising the
sensitivity of the system, i.e., by increasing the false negative
rate. Attacks which can cause the greatest disruption in terms of
traffic engineering, routing etc., are flooding attacks, and these
will invariably show up as volume anomalies on the egress interfaces
closest to the customers. Since our primary focus is on such flooding
attacks, there is almost no impact on the false negative rate. The
benefits we gain in terms of operational simplicity and reduced false
alarm rate greatly outweigh the negligible decrease in the detection
sensitivity toward low-impact attacks.
The third pitfall is related to the ability of the monitoring
infrastructure to sustain data collection during attacks. While
collecting low-volume SNMP feeds is not a serious overhead,
collecting flow records at the customer egresses and transporting them
back to a centralized processing engine is clearly infeasible during
volume floods. The access link is already overloaded, and reporting
large volumes of flow records can only worsen the congestion. Large
providers typically deploy flow collectors at core network elements,
which are usually well-provisioned, and they can subsequently map the
flow records to the appropriate egresses using routing and address
space information. Thus, there will be no perceivable reduction in the
data collection capabilities during attacks.
Finally, there is a concern regarding the resolution limits of
in-network DDoS detection - whether such an approach can detect
anomalies on all possible scales of network prefixes. Our system deals
primarily with flooding attacks that impact immediate customers
directly connected to the provider network. Our experiences with both
the SNMP and the flow analysis indicates that at this granularity,
LADS is effective at identifying anomalies and providing sufficient
information for operators to respond to the alarms.
4 Implementation
Our implementation of LADS, currently works as an off-line DDoS
detection system within a tier-1 ISP. The described implementation
works on real traffic feeds of the tier-1 ISP and is only classified
as off-line in that the data currently provided to the system might be
substantially delayed.We are actively working on deploying the system
in an on-line environment in which real-time data feeds are
available. Our performance evaluation (Section 6.1) indicates
that our design and implementation will be adept to the task of
on-line monitoring.
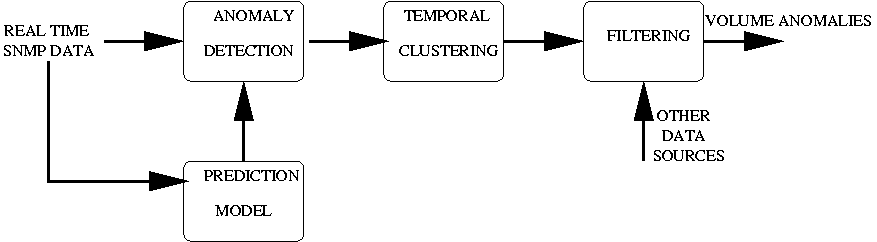
4.1 Lightweight Anomaly Detection
The first stage of the detection system uses SNMP link utilization
data to report volume anomalies. Figure 3 provides a
conceptual overview of the SNMP anomaly detection module.
Specifically, we are interested in flow anomalies on customer-facing
interfaces, since volume based DDoS attacks will be most visible at
the egress links of the customers under attack. SNMP data is collected
on an on-going basis at most providers, and typically contains CPU and
link loads (in terms of octet and packet) counts. Since most DDoS
attacks use small packets we use the egress packet counts (i.e., with
reference to Figure 1,
the C-PE interface towards the customer) to detect volume anomalies.
Figure 3: Overview of SNMP
Anomaly Detection
 |
To keep the operational, storage, and computation resources low,
we devised a simple trigger algorithm with good performance.
Conceptually, the algorithm builds a prediction model which indicates
the expected mean and expected variance for the traffic time series.
Using this model it assigns a deviation score to current observations,
in terms of the number of standard deviations away from the mean that
each observation is found to be. Borrowing some formal notation [26] one can think of the
traffic time series, denoted by  as being
composed of three components, as being
composed of three components, 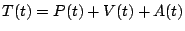 , where , where  represents the
predicted mean traffic rate, represents the
predicted mean traffic rate,  represents the stochastic noise
that one expects for the traffic, and represents the stochastic noise
that one expects for the traffic, and  is the anomaly
component. Our goal is to obtain models for is the anomaly
component. Our goal is to obtain models for  (the
periodic component) and (the
periodic component) and  (the stochastic component), so
that we can identify the anomaly component (the stochastic component), so
that we can identify the anomaly component  in future
traffic measurements. in future
traffic measurements.
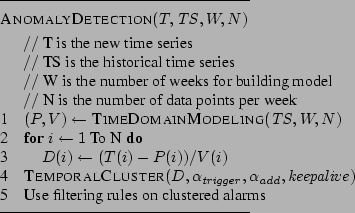
Figure 4: Procedure for
timeseries modeling
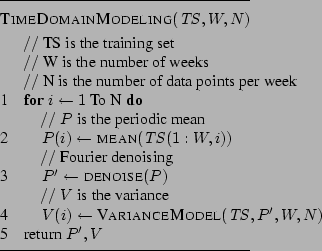 |
Figure 5: Outline of SNMP
anomaly detection
|
|
Our algorithm, depicted in Figure 4, works as follows. For each
customer interface, we take the last  weeks of data
(this historical time-series data is referred to as weeks of data
(this historical time-series data is referred to as  ). We build an empirical mean-variance model by
simple point-wise averaging, assuming a basic periodicity of one week.
For example, for estimating the expected traffic for the 5 minute
interval Fri 9:00-9:05 am, we take the average of the
observations over the past Fridays, for the same 5 minute
timeslot. As the training data might itself contain anomalies we
perform a de-noising step using a Fourier transform from which we pick
the top 50 energy coefficients. 3 In
the final step, for each point per week (e.g., Fri 9:00-9:05, Mon
21:00-21:05), the algorithm determines the variance over the last observed data points with respect to the de-noised
historical mean. The implicit assumptions in the method are that the
basic periodicity of the traffic data is one week and that traffic
patterns are relatively stable week to week, which has been suggested
in other traffic analysis on similar datasets [26,1]. ). We build an empirical mean-variance model by
simple point-wise averaging, assuming a basic periodicity of one week.
For example, for estimating the expected traffic for the 5 minute
interval Fri 9:00-9:05 am, we take the average of the
observations over the past Fridays, for the same 5 minute
timeslot. As the training data might itself contain anomalies we
perform a de-noising step using a Fourier transform from which we pick
the top 50 energy coefficients. 3 In
the final step, for each point per week (e.g., Fri 9:00-9:05, Mon
21:00-21:05), the algorithm determines the variance over the last observed data points with respect to the de-noised
historical mean. The implicit assumptions in the method are that the
basic periodicity of the traffic data is one week and that traffic
patterns are relatively stable week to week, which has been suggested
in other traffic analysis on similar datasets [26,1].
Figure 5
outlines the four main stages in the anomaly detection process. We
first obtain the historical prediction model, to get the deviation
scores. Then, we use the estimated model to obtain deviation scores
for current SNMP data to obtain volume anomalies. We use a natural
definition of the deviation, 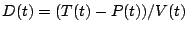 , which represents the number of
standard deviations away from the prediction that the observed data
point is. Once the deviation scores have been computed, we perform a
temporal clustering procedure (Figure 6) to report
anomalous incidents to the flow collector and analyzer. Temporal
clustering can reduce the load on the collection mechanism by reducing
the number of queries that we issue to the collector. Such a load
reduction is indeed significant, as many attacks do last quite long.
The clustering method operates based on two pre-defined deviation
score thresholds, the event trigger threshold ( , which represents the number of
standard deviations away from the prediction that the observed data
point is. Once the deviation scores have been computed, we perform a
temporal clustering procedure (Figure 6) to report
anomalous incidents to the flow collector and analyzer. Temporal
clustering can reduce the load on the collection mechanism by reducing
the number of queries that we issue to the collector. Such a load
reduction is indeed significant, as many attacks do last quite long.
The clustering method operates based on two pre-defined deviation
score thresholds, the event trigger threshold (  ) and the event extension threshold
( ) and the event extension threshold
(  ),
as well as a keep alive time ( ),
as well as a keep alive time (  ). The clustering process tries to extend
the current active event, if the new observation has a deviation score
that exceeds the event extension threshold , within a time duration of , since the start of the event. If there
is no active ongoing event, it creates a new event if the observed
deviation score is higher than the event trigger threshold ( ). ). The clustering process tries to extend
the current active event, if the new observation has a deviation score
that exceeds the event extension threshold , within a time duration of , since the start of the event. If there
is no active ongoing event, it creates a new event if the observed
deviation score is higher than the event trigger threshold ( ).
Figure 6: Temporal clustering
to reduce query load
 |
After detecting the SNMP anomalies, we perform additional filtering
steps to allow the operators to remove known or uninteresting
anomalies. We use an absolute volume threshold to remove all SNMP
alarms which have an average bandwidth less than a pre-defined
threshold. This allows the operator to specify a minimum attack rate of
interest, to reduce the overall workload for the flow collectors.
Second, we remove anomalies in the SNMP data caused by router resets
and SNMP implementation bugs. In particular we remove the first SNMP
counters after a reset (e.g., we saw in a few cases, immediately after
a reset, a SNMP counter corresponding to -1), as well as measurements
which indicate a bandwidth utilization greater than the physical
bandwidth. Even though such events are extremely rare, they do occur
daily on a large network, and we remove such measurement anomalies.
At the end of the SNMP anomaly stage, we receive a set of volume
anomalies, each anomaly being specified by the egress interface, and the
start and end time. This information is then used to trigger Netflow
collection for detailed investigation.
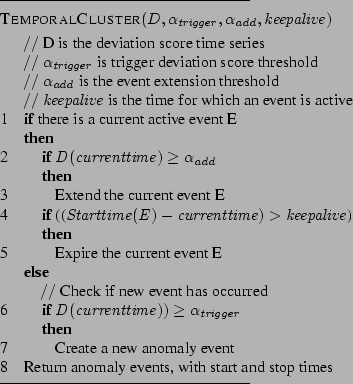
4.2 Focused Anomaly Detection
Figure 7: Incident diagnosis
using flow data
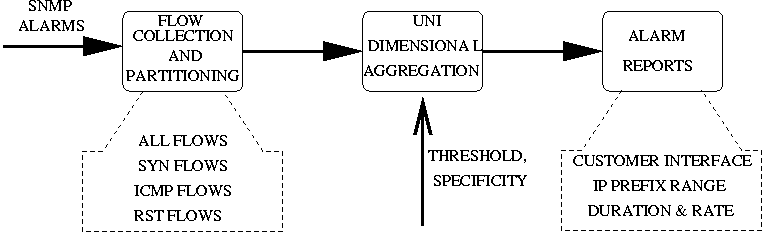 |
The second stage of our DDoS detection system performs detailed
analysis on Netflow data as shown in Figure 7. We first
collect all Netflow records for the egress interface indicated by the
first stage trigger. Section 5.1
describes the collection infrastructure in greater detail. Then for
each SNMP-alarm we build the following Netflow datasets containing,
- Records with the TCP SYN flag set (SYN set)
- Records with the TCP RST flag set (RST set)
- Records for ICMP flows (ICMP set)
- All flow records (All set)
Finally, for each of the Netflow datasets, we report the traffic
volumes for all destination prefixes with a prefix length larger than
a /28, using the uni-dimensional clustering algorithm described in
Figure 8.
The algorithm generates a bandwidth attack alarm if the All
set contains a prefix smaller than /28 which carries more traffic then
the configurable Bandwidth Attack Threshold. It will also
generate a SYN/ICMP/RST alarm if the corresponding SYN/ICMP/RST sets
observe an IP prefix range which carries more traffic than the
configurable SYN/ICMP/RST Threshold. Instead of using a fixed rate
threshold, we use a duration-adaptive rate threshold mechanism, which
takes into account the duration of the SNMP volume anomaly. This will
balance the sensitivity between high-rate low duration attacks, and
relatively lower-rate but longer duration attacks. This can be achieved
by using a simple rate-depreciation approach, so that the rate
threshold is a monotonically decreasing function of the alarm duration.
Our current implementation uses a geometrically decreasing
depreciation, where the average rate for longer duration events will
be generated according to the following formula  ,
where the ,
where the  is 300 seconds, and the is 300 seconds, and the  is set to is set to  . .
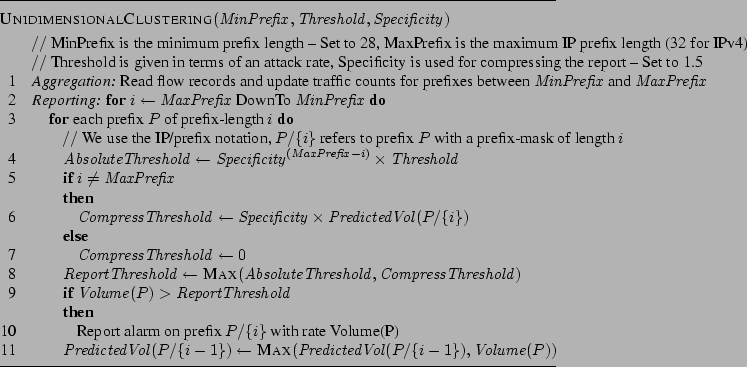
There are two steps of the uni-dimensional clustering (Figure 8): Aggregation and
Reporting. The aggregation step simply counts the total traffic volume
received by each distinct destination prefix, larger than a minimum
prefix-range size, denoted by  . Since we are interested in DDoS attacks
on customer egress links, we can afford to perform the traffic
aggregation on smaller prefix ranges, than would be the case for more
general purpose traffic analysis applications [11,35,32]. Thus the
computational and memory overhead during the aggregation phase is
upper-bounded by the prefix range we are interested in. For example,
we are only interested in the traffic intended for prefixes smaller
than a /28, which can be potential attack targets. The next step is
the Reporting stage, which uses the aggregated counters to
decide whether to report each particular prefix range as a potential
attack target. The reporting step is conceptually similar to the work
of Estan et al. [11]
and Singh et al. [35],
to generate traffic summaries indicating heavy-hitters. Intuitively,
we generate reports on larger prefixes, if they carry substantially
more traffic than a previously reported smaller prefix range, and if
they are above the absolute volume threshold. We scale the absolute
volume threshold according to the size of the prefix range by a
multiplicative . Since we are interested in DDoS attacks
on customer egress links, we can afford to perform the traffic
aggregation on smaller prefix ranges, than would be the case for more
general purpose traffic analysis applications [11,35,32]. Thus the
computational and memory overhead during the aggregation phase is
upper-bounded by the prefix range we are interested in. For example,
we are only interested in the traffic intended for prefixes smaller
than a /28, which can be potential attack targets. The next step is
the Reporting stage, which uses the aggregated counters to
decide whether to report each particular prefix range as a potential
attack target. The reporting step is conceptually similar to the work
of Estan et al. [11]
and Singh et al. [35],
to generate traffic summaries indicating heavy-hitters. Intuitively,
we generate reports on larger prefixes, if they carry substantially
more traffic than a previously reported smaller prefix range, and if
they are above the absolute volume threshold. We scale the absolute
volume threshold according to the size of the prefix range by a
multiplicative  parameter that determines the scaling
factor. We chose this approach due to its simplicity and we observe
that the diagnostic capability provided by our approach is sufficient
for detecting DDoS attacks, and generating alarm reports comparable to
commercial DDoS solutions (Section 6.4). We found in our
experiments that this approach is computationally efficient, in terms
of memory and processing time, which makes it a viable alternative for
real-time analysis. parameter that determines the scaling
factor. We chose this approach due to its simplicity and we observe
that the diagnostic capability provided by our approach is sufficient
for detecting DDoS attacks, and generating alarm reports comparable to
commercial DDoS solutions (Section 6.4). We found in our
experiments that this approach is computationally efficient, in terms
of memory and processing time, which makes it a viable alternative for
real-time analysis.
Figure 8: Procedure for
uni-dimensional prefix aggregation and generating compressed reports
 |
5 Experimental Setup
To evaluate our LADS implementation we collected SNMP and Netflow data
for a subset of the access interfaces of a tier-1 ISP ranging from
T1 to OC-48 speeds. We describe this data collection next followed
by a description of the LADS parameter settings we used.
5.1 Data Description
For our LADS evaluation we collected SNMP and Netflow data for over
22000 interfaces within a large tier-1 ISP. To allow our evaluation to
be repeatable during development we archived all relevant data for an
eleven day period in August 2005 with the exception of the SNMP data
used which was archived for a period in excess of 12 months. We also
collected alarms from the commercial DDoS detection system for this
period.
SNMP Feeds The SNMP reports are generated from each egress
router within the tier-1 ISP and reported periodically for each
5 minute interval. For each interface, the SNMP reports contain
the total traffic volume per interface (both packet and byte counts),
and router utilization information for the recent 5 minute
interval. The reporting interval can be configured in most router
implementations. Within the ISP, this value is set to 5 minutes -
small enough to initiate real-time response, but large enough to keep
the router overhead low. The total collection overhead for SNMP
data over the entire provider's network is around 200 MB of
compressed (ASCII) data per day, which represents a small bandwidth
overhead compared to large volumes (of the order of few petabytes per
day) of traffic that a tier-1 ISP carries. In LADS, we only use the
egress packet counts, i.e., the packets from the ISP toward the
customer, to generate triggers.
Netflow Feeds The Netflow collection infrastructure collects
sampled flow records covering the entire backbone network (more than
500 routers within the ISP). The records are based on 1:500 packet
sampled data. The sampling is performed on the router and the records
are subsequently smart sampled [10]
to reduce the volume. In smart sampling, flow records representing a
total volume greater than a threshold of 20 MB are always
sampled, while smaller records are sampled with a probability
proportional to their size. Appropriate renormalization of the
reported volume (in bytes) yields unbiased estimates of the traffic
volume prior to sampling [10].
In the resulting data set each record represents, on average, at
least 20 MB of data. After collecting the records we annotate each
record with its customer egress interface (if it was not collected on
the egress router) using route simulation and tag records which could
have been observed twice within the collection infrastructure to avoid
double counting of flow records. We emulate a triggered flow retrieval
system on the entire set of smart sampled flow records. i.e., we query
the flow data available from all collectors to obtain the flow records
relevant to each SNMP anomaly. Since our current implementation runs
in off-line emulation mode, the benefits of a triggered collection
approach are not realized.
Alarms from commercial system The ISP has a commercial DDoS
detection system deployed at key locations within its network. We
collected the high priority DDoS alarms from this commercial DDoS
detection system. The alarms were combined into attack records if we
found multiple alarms for the same target with an idle time of less then
15 minutes in between alarms. Even though we are not aware of the
detailed algorithms used within this product, operational experience
indicates that the system detects most large DDoS attacks while
generating a manageable number of high priority alarms. The system is
deployed in a substantial fraction of the core of the ISP at high speed
interfaces and, therefore, only analyzes aggregate customer traffic.
We use the commercial detection system as a basis for comparison with
our implementation even though we are aware that due to its deployment
locations and configuration (we only collect high priority alarms) the
commercial system might not detect some of the DDoS attacks which are
detectable with our system. In an ideal scenario, we would like to
evaluate the false positive and false negative rates of our system
against some absolute ground truth. We are not aware of any
system which can generate such ground truth at the scale that we are
interested in, and this commercial system is our closest available
approximation despite its inherent limitations.
In terms of the specifics of our implementation, our approach requires
a number of configurable parameters which we set to the following
values:
SNMP training period The training period for model building
for SNMP anomaly detection is  weeks. weeks.
Absolute Volume Threshold The absolute volume threshold provides
a lower bound on DDoS attacks we detect in the SNMP data. We set this
value to 250 Kbps which considering that the smallest link size
in the Tier-1 ISP's network is a T1 (1.5 Mbps) allows us to
detect any sizable attack on any interface under consideration.
Event Score Threshold ( ) The threshold on the deviation
score which triggers an SNMP-based alarm. We evaluate the sensitivity
and overhead for different threshold values in Section 6.2.2. For our evaluation
we use  . .
Temporal Clustering Parameters The temporal clustering procedure
uses an event extension threshold ( ) and a duration value, for deciding on combining
SNMP anomalies. We set  , and the duration to be 15 minutes. , and the duration to be 15 minutes.
Bandwidth Attack Threshold This threshold is applied to determine
if a particular incident should be reported as a potential DDoS attack,
if none of the other DDoS related signatures (e.g., high volumes of
SYN, ICMP, or RST packets) are present. We set this threshold to a
high-intensity threshold of 26 Mbps, 4
targeted at a single /32 behind a customer interface.
The rate for alarms of longer duration will be lower due to the rate
depreciation described in Section 4.2. The thresholds for
larger prefixes (upto /28) are scaled according to the algorithm
described in Figure 8.
SYN/ICMP/RST Threshold This threshold is applied to determine
within the flow data if a particular incident could be considered a
SYN, ICMP or RST attack. Currently we set this rate to a high intensity
rate of 2.6 Mbps, 5
Again, we use a similar rate depreciation function for longer duration
alarms.
6 Experimental Results
We first study our system performance in Section 6.1, followed by
an evaluation of the SNMP based trigger phase in Section 6.2, before analyzing the
incidents generated by our system in Section 6.3 and Section 6.4.
6.1 Performance
The data was collected using an existing SNMP and Netflow data
collection infrastructure. The SNMP data is being collected by a
commercial off the shelf SNMP collection tool which seems to scale
easily to large networks. The Netflow collection system on the other
hand was specifically build for this large ISP and is described in
more detail in [10].
Currently this infrastructure monitors in excess of one petabyte of
traffic each day.
Using these existing data sources we implemented our data extraction
using a combination of flat files and an in-house database system. The
data-extraction and analysis modules were implemented in Perl. The
model-building phase uses additional MATLAB scripts for performing
the de-noising operation.
The model-building phase uses 5 weeks of data per interface to get
a mean-variance model for the anomaly detection. It took roughly
26 hours to perform the data extraction, de-noising, and model
extraction for all the 22000 interfaces. This is not a concern
since this part of the analysis can be performed offline, as it is not
on the critical path for real-time attack detection.
We ran LADS in off-line emulation mode for our entire 11 day
period on a heavily shared multi-processor 900MhZ SUN Ultra. The
anomaly detection stage was parallelized using 6 processes, and
it took 11.2 seconds to report volume anomalies (i.e., finding
deviation scores, doing the clustering, and filtering out measurement
errors), for each 5 minute interval across the 22000 interfaces.
The biggest bottleneck for our performance is the extraction of flow
records for each reported SNMP volume anomaly (even after the
reduction due to the triggers). The main reasons being (a) all flow
data is compressed to meet storage constraints, and (b) the flow
data is collected and indexed on a per-collector basis and not indexed
based on the egress interface. Even with these performance inhibitors,
it takes around 212.5 seconds to extract the flow data that needs
to be analyzed. We note that this time can be reduced significantly by
indexing the data appropriately.
The last stage of our analysis performs uni-dimensional aggregation
on the collected flow data, taking approximately 40 seconds for
each 5 minute interval. Thus, for each 5 minute interval of
data arriving at the processing engine, the total time that is needed
to report alarms, is the sum of the time taken to generate SNMP
anomalies, the time taken to extract flow data for the triggered data,
and the time taken to process the flow data, which is equal to  seconds. The resulting maximum
latency with which we will report an alarm is, therefore, at most
263.7 seconds, implying that even with our current
implementation (with very few performance optimizations) we can
perform near real-time attack detection. On a more state of the art
platform (900MhZ UltraSparcs are quite dated!), with additional
implementation optimizations and better data indexing we can achieve
substantially better performance. seconds. The resulting maximum
latency with which we will report an alarm is, therefore, at most
263.7 seconds, implying that even with our current
implementation (with very few performance optimizations) we can
perform near real-time attack detection. On a more state of the art
platform (900MhZ UltraSparcs are quite dated!), with additional
implementation optimizations and better data indexing we can achieve
substantially better performance.
6.2 SNMP-based Trigger Evaluation
We evaluate our SNMP based trigger implementation in three stages.
First, we discuss the choice of our trigger algorithm, then we compare
our trigger events against the commercial-alarms and finally we
highlight the savings our triggered approach provides.
In the context of our system we are looking for a model which is
efficient, uses only historically available data and detects anomalies
early. Those requirements are motivated by the fact that we have to
perform this analysis in real time on tens of thousand of times series
to provide DDoS alarms within a reasonable timeframe. Our
mean-variance based model provides these features.
Figure 9: Correlation with
the anomaly detection procedure proposed by Roughan et al. [26]
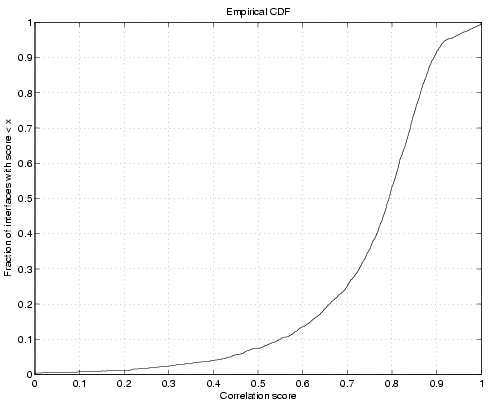 |
As a preliminary verification of the correctness of our anomaly
detection system, Figure 9 depicts
the correlation of our trigger algorithm with the one proposed by
Roughan et al. [26]. The
basic difference between these approaches lies in the assumption about
the variance of the time-series. We use an empirical data-driven
approach while Roughan et al. [26] assume that the stochastic
component is of the form  , where , where  is a peakedness
factor, and is a peakedness
factor, and  is the periodic component of the
time-series model (obtained using moving averages). Figure 9 shows a
correlation score of greater than 0.7 between these two methods for
more than 75% of all the 22000 interfaces selected for detection. is the periodic component of the
time-series model (obtained using moving averages). Figure 9 shows a
correlation score of greater than 0.7 between these two methods for
more than 75% of all the 22000 interfaces selected for detection.
We find that in our problem domain, the simple trigger model has
similar properties to more complex models and is adequate to perform
the trigger function. One direction for future work is to compare our
lightweight detection mechanism with other algorithms for time-series
anomaly detection [34].
6.2.2 Accuracy
The objective of the trigger phase of our system is to reduce the flow
data collected and analyzed to a manageable amount, and not to
diagnose attacks directly. Therefore, an interesting question is the
sensitivity of the triggers with respect to known actual attacks - how
often and by what magnitude do the known flooding attacks show up as
volume anomalies.
To evaluate the sensitivity of the trigger, we use synthetically
introduced volume anomalies of varying magnitude, and tested the
detection false negative rate as a function of the detection threshold.
For each of the 22000 interfaces under analysis, we introduce 20
randomly located anomalies for a chosen magnitude. Figure 10 shows the false negative
rate for different thresholds ( ). We notice that the false negative
rates are indeed low, and that with anomalies of increased magnitude
the false negative rates drop off quite significantly. Also, we notice
that for larger anomalies, the false negative rate is expectedly less
sensitive to the choice of the anomaly detection threshold.
Figure 10: Evaluating false
negative rate with synthetic volume anomalies
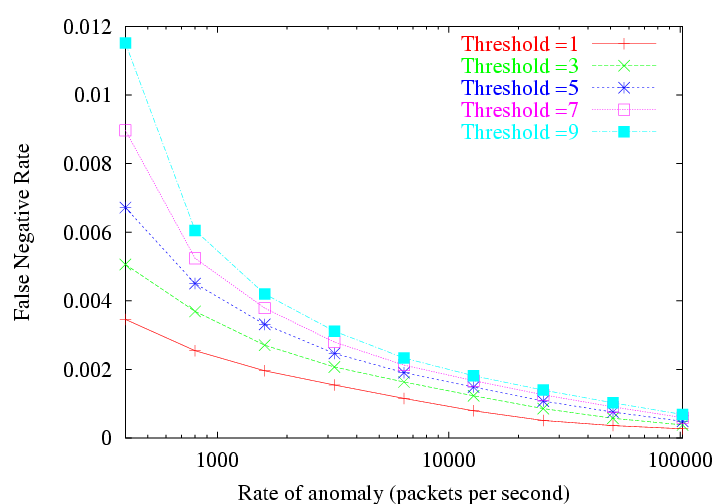 |
Figure 11: Tradeoff between
sensitivity and scalability
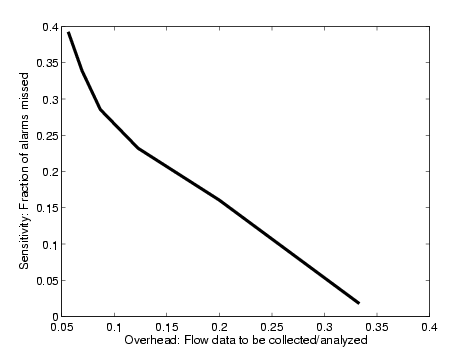 |
A related question is how frequently the SNMP based triggers miss an
attack in the commercial-alarm set. Figure 11 depicts the tradeoff
between the sensitivity of the triggers and the overall data
complexity reduction the trigger can achieve. The sensitivity of the
anomaly detection module, for a particular deviation score threshold,
is the percentage of commercial-alarms which match a SNMP anomaly for
the threshold. The data complexity reduction achieved by the trigger
can be calculated in terms of the flow data that will be collected
after the trigger step and which needs to be further analyzed. Ideally,
we would like to have a trigger that has perfect sensitivity (i.e.,
zero false negative rate), that can provide very low collection
overhead for later stages.
As a tradeoff between sensitivity and data reduction we chose an
anomaly detection threshold of 5. This results in an 85% overlap with
the commercial-alarms, and corresponds to an 80% data reduction
(i.e., only 20% of the original flow data needs to be collected and
analyzed in the second stage of our system). The reduction in
collection overhead is significant considering that the total
bandwidth overhead for collecting (1 in 500 sampled) flow records is
around 2-3 TB per day, for a tier-1 ISP. With an 80% reduction
rate, the total bandwidth overhead for collecting flow records would
be roughly 40 Mbps over the entire network which is quite
manageable. From a provider's perspective, the alarms that are of
paramount importance are those that affect the customers the most, and
typically these are attacks which overload the egress link. If the
misses occur on well-provisioned interfaces, the loss in sensitivity
is not a serious concern. We will further discuss the alarms that do
not appear as volume anomalies in Section 6.4.
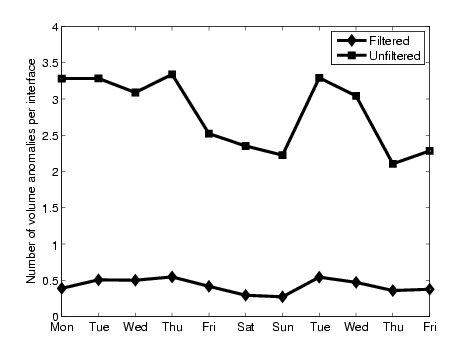
Figure 12
shows the number of SNMP anomaly events per customer interface per day
over the evaluation period before and after applying the filters. The
filtering reduces the number of SNMP anomaly events on average by a
factor of 6 (the predominant contribution being one from the absolute
volume threshold). Considering the fact that these events will be
automatically processed by the second phase of LADS, the number of SNMP
anomalies is quite manageably low.
Figure 12: Number of SNMP
events per interface per day
 |
6.3 Incident Analysis
Next we characterize the alarms generated by LADS after
performing the Netflow analysis described in Section 4.2. Each alarm specifies a
duration and a customer-facing interface. It also contains a set of
destination IP-prefixes which are receiving high incoming traffic
volumes (and hence potential DDoS targets), the bandwidth of the
suspected DDoS event, along with the alarm-type (BW, SYN, RST, ICMP).
Figure 13: Number of reported
incidents (at egress interface granularity) in 11 day period in Aug 2005
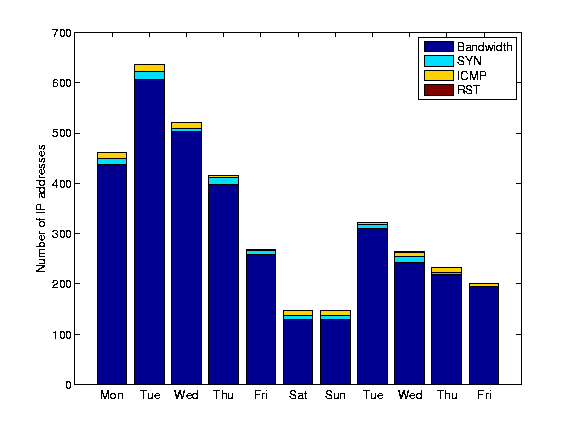 |
Figure 13
shows the number of alarms during our 11-day evaluation period. 6 Here we consider incidents at the
granularity of egress interfaces, i.e., concurrent floods against
multiple IP addresses on the same egress interface will be considered a
single incident. We generate approximately 15 incidents per hour
which seems reasonable considering that we monitor 22000 customer
interfaces and that this number of incidents could easily be handled by
the security staff of a large network provider. We observe that a
large fraction of the incidents are reported as potential bandwidth
attacks.
The number of distinct IP addresses involved in an attack might be a
better indicator of the workload for operators to investigate these
alarms. If we split all alarms which target multiple IP addresses at a
single egress interface into multiple alarms, we only see a slightly
higher alarm rate (around 17 per hour). That is not surprising
considering that most (76%) of the incidents involve only one IP
address. We also find that in around 19% of the cases we get repeated
alarms for the same IP address within the same day. These alarms would
most likely only require one investigation by the network operator.
Therefore, we believe that the above alarm rates are actually an upper
bound of the number of trouble tickets network operators need to
process.
Some of these alarms may indeed be benign bandwidth floods or flash
crowds. Nevertheless, they are a cause of concern and we believe there
is value in bringing these incidents to the attention of network
operators. First, in the absence of ground truth regarding these
incidents, such incidents should be brought to the notice of
network operators. Second, since there was a large volume anomaly on
the interface, with one or more destination IPs receiving a high data
rate during this time, such reports may benefit other aspects of
network operations such as traffic engineering and route management.
We are investigating other techniques to independently characterize
these alarms (e.g., [14]).
6.4 Comparison with Commercial DDoS Detection System
In this section we compare LADS alarms against the commercial-alarms.
Since the commercial DDoS detection system only covers key locations
and we only receive high level alarms from this system we would expect
that our alarm set contains substantially more attacks then the
commercial-alarms. The objective of LADS is not necessarily to
provide better detection than the commercial system on the links
covered by the commercial system. Rather the goal is to provide
detection functionality comparable to deploying the commercial system
on all the interfaces of the ISP, but to do so at a fraction of the
cost that would be incurred in having to deploy the commercial system
on every interface. Hence, we use this data set primarily to evaluate
the false negative rate of LADS on the links covered by the commercial
system.
Figure 14
presents a breakdown of the comparison of LADS alarms versus the
commercial-alarms. The breakdown uses the following categories to
classify the 86 alarms obtained from the commercial system.
Successes Between the LADS alarms and the commercial-alarms
the interface matches, the IP prefix alarmed matches, and the durations
of the reported alarms overlap.
Found early incidents Between the LADS alarms and the
commercial-alarms the interface matches, the IP address alarmed matches,
but we find the alarm slightly earlier than what is reported.
Found late incidents Between the LADS alarms and the
commercial-alarms the interface matches, the IP address alarmed matches,
but we find the alarm slightly later than what is reported by the
commercial system.
Anomaly detection misses
There is no SNMP event on the interface corresponding to a
commercial-system alarm, i.e., the deviation score for the
corresponding time is less than the threshold ( ).
Potential commercial-alarm false positive The interface information
and the anomaly match between our SNMP alarm and the
commercial-alarm. However, we find little or no flow data for the
corresponding attack target reported by the alarms.
Threshold misses We have an SNMP volume anomaly, and we have
flow data for the commercial-system alarm. We find quite a large
number of flows to the IP, but LADS did not raise an alarm for the IP
address.
The false negative rate of our system compared to the commercial DDoS
detection system is essentially the sum of the anomaly misses, and
threshold misses. Manual analysis of the anomaly detection misses
indicates that all 7 SNMP anomaly misses are caused by relatively
small attacks on OC-48 interfaces (2.48 Gbps). They did not
saturate the customer interface and therefore are not in the category
of DDoS attacks of immediate concern. The number of threshold misses
on our system is low - just one out of 86 incidents are missed due to
the threshold settings. We conclude that the overall false negative
rate of our system, compared to a commercial DDoS detection system, is
1 out of 80, or 1.25%.
Figure 14: Comparison with
the proprietary system
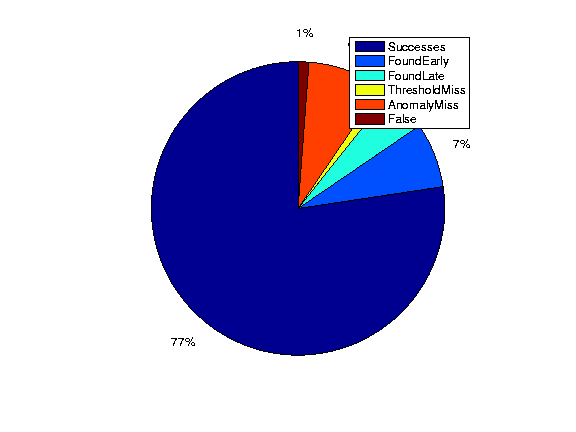 |
Figure 15: Breakdown of
overlapping incidents
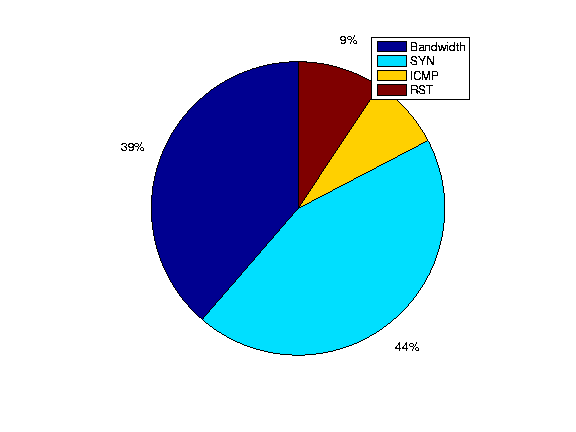 |
Figure 16: Rates of potential
attack incidents
 |
Next we proceed to analyze the incidents that are common to both
LADS alarms and the commercial-system alarms. We give a breakdown of
the 4 types of incidents Bandwidth, SYN, ICMP, RST in
Figure 15.
Interestingly, the largest portion of the reported incidents which
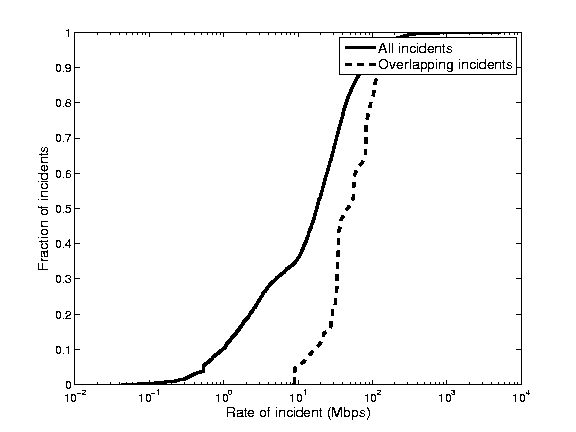
overlap are SYN floods. Figure 16 shows the average
bitrate (calculated from the flow records) of the DDoS alarms generated
by our system and the commercial DDoS detection system. The overlapping
incidents appear to have a minimum rate of 10 Mbps, which is most
likely due to the fact that we only had access to the high priority
alarms of the commercial DDoS detection system. Interestingly, this
makes the high level alerts of this system unsuitable for detecting
DDoS attacks against small customer links. Since, it is primarily
deployed in the core the system ranks attacks as high level alerts not
by customer impact but by the overall attack size. This is of course
less desirable, if the goal is to protect customers with diversity in
subscription line rates. For 40% of the LADS alarms we find a reported
bandwidth which is smaller than 10Mbps.7
Further investigation reveals that more than 70% of these low
volume alarms are in fact caused by volume floods against low speed
links.
7 Conclusions
We presented the design of a triggered framework for scalable threat
analysis, and a specific implementation based on SNMP and Netflow feeds
derived from a tier-1 ISP. Our evaluations and experience with large
networking datasets demonstrate the need for such an approach. LADS,
our large-scale automated DDoS detection system, can provide
detection and diagnostic capabilities across all customer interfaces
of a large tier-1 ISP, without relying on the deployment of
additional hardware monitoring devices. Of particular practical
significance is the fact that our system uses data feeds that are
readily available to most providers. We are investigating other ways
in which we can confirm the validity of the alarms generated by our
system (for example, using customer incident reports and other
historical traffic profiles). Finally, we are currently pursuing the
implementation of real time data feeds to our system to allow us to
use it as an online attack detection mechanism.
We wish to thank Jennifer Yates and Zihui Ge for helping us with
collecting the SNMP data. We acknowledge the valuable feedback
provided by Albert Greenberg. We thank Vidhyashankar Venkataraman and
the anonymous reviewers for their comments on the paper, and thank
Geoff Voelker for shepherding our paper.
- 1
- AIELLO, W., GILBERT, A., REXROAD,B.,ANDSEKAR,V.
Sparse Approximations for High-Fidelity Compression of Network
Traffic Data.
In Proceedings of ACM/USENIX Internet Measurement Conference
(IMC) (2005).
- 2
- Arbor Networks.
https://www.arbor.com.
- 3
- B. CLAISE, E.
Cisco Systems NetFlow Services Export Version 9.
RFC 3954, 1990.
- 4
- BARFORD, P., KLINE, J., PLONKA,D.,ANDRON,A.
A Signal Analysis of Network Traffic Anomalies.
In Proceedings of ACM SIGCOMM Internet Measurement Workshop (IMW)
(2002).
- 5
- BRUTLAG, J. D.
Aberrant Behavior Detection in Time Series for Network Monitoring.
In Proceedings of USENIX Large Installation Systems
Administration Conference (LISA) (2000).
- 6
- BURCH, H., AND CHESWICK, B.
Tracing Anonymous Packets to Their Approximate Source.
In Proceedings of USENIX Large Installation Systems
Administration Conference (LISA) (2000).
- 7
- CASE, J., FEDOR, M., SCHOFFSTALL,M.,ANDDAVIN,J.
A Simple Network Management Protocol (SNMP).
RFC 1157, 1990.
- 8
- Cisco Guard.
https://www.cisco.com/en/US/products/ps5888/.
- 9
- COOKE, E., JAHANIAN, F., ANDMCPHERSON,D.
The Zombie Roundup: Understanding, Detecting, and Disrupting Botnets.
In Proceedings of USENIX Workshop on Steps to Reducing Unwanted
Traffic on the Internet (SRUTI) (2005).
- 10
- DUFFIELD, N., LUND, C., ANDTHORUP,M.
Learn more, sample less: Control of volume and variance in network
measurement.
IEEE Transactions in Information Theory 51, 5 (2005),
1756-1775.
- 11
- ESTAN, C., SAVAGE, S., ANDVARGHESE,G.
Automatically Inferring Patterns of Resource Consumption in Network
Traffic.
In Proceedings of ACM SIGCOMM (2003).
- 12
- GIL, T., AND POLETTO, M.
MULTOPS: A Data-structure for Bandwidth Attack Detection.
In Proceedings of USENIX Security Symposium (2001).
- 13
- JAIN, A., HELLERSTEIN, J. M.,
RATNASAMY, S., AND WETHERALL, D.
A Wakeup Call for Internet Monitoring Systems: The Case for
Distributed Triggers .
In Proceedings of ACM SIGCOMM Workshop on Hot Topics in Networks
(HotNets) (2004).
- 14
- JUNG, J., KRISHNAMURTHY, B., ANDRABINOVICH,M.
Flash crowds and denial of service attacks: Characterization and
implications for CDNs and web sites.
In Proceedings of the International World Wide Web Conference
(WWW) (2002).
- 15
- KANDULA, S., KATABI, D., JACOB,M.,ANDBERGER,A.
Botz-4-sale: Surviving organized ddos attacks that mimic flash
crowds.
In Proceedings of USENIX/ACM Symposium on Networked Systems
Design and Implementation (NSDI) (2005).
- 16
- KEROMYTIS, A., MISRA, V., ANDRUBENSTEIN,D.
SOS: Secure Overlay Services.
In Proceedings of ACM SIGCOMM (2002).
- 17
- KOMPELLA, R. R., SINGH, S., ANDVARGHESE,G.
On Scalable Attack Detection in the Network.
In Proceedings of ACM/USENIX Internet Measurement Conference
(IMC) (2004).
- 18
- KRISHNAMURTHY, B., MADHYASTHA, H. V.,ANDSPATSCHECK,O.
ATMEN: a triggered network measurement infrastructure.
In Proceedings of International World Wide Web Conference (WWW)
(2005).
- 19
- LAKHINA, A., CROVELLA, M., ANDDIOT,C.
Diagnosing network-wide traffic anomalies.
In Proceedings of ACM SIGCOMM (2004).
- 20
- LAKHINA, A., CROVELLA, M., ANDDIOT,C.
Mining anomalies using traffic feature distributions.
In Proceedings of ACM SIGCOMM (2005).
- 21
- MAHAJAN, R., BELLOVIN, S., FLOYD,S.,
IOANNIDIS, J., PAXSON, V., AND SCOTT,P.
Controlling high bandwidth aggregates in the network.
ACM SIGCOMM CCR 32 (2002).
- 22
- Mazu Networks.
https://www.mazu.com.
- 23
- MIRKOVIC, J., AND REIHER, P.
A Taxonomy of DDoS Attacks and DDoS Defense Mechanisms.
ACM SIGCOMM CCR 34 (2004).
- 24
- MOORE, D., VOELKER, G. M., ANDSAVAGE,S.
Inferring Internet Denial-of-Service activity.
In Proceedings of USENIX Security Symposium (2001).
- 25
- MOREIN, W. G., STAVROU, A., COOK,D. L.,
KEROMYTIS, A., MISRA, V., AND RUBENSTEIN,D.
Using Graphic Turing Tests to Counter Automated DDoS Attacks Against
Web Servers.
In Proceedings of Networking and Distributed Systems Security
Symposium (NDSS) (2005).
- 26
- ROUGHAN, M., GREENBERG, A., KALMANEK,C.,
RUMSEWICZ, M., YATES, J., AND ZHANG,Y.
Experience in Measuring Internet Backbone Traffic Variability:Models,
Metrics, Measurements and Meaning.
In Proceedings of International Teletraffic Congress (ITC)
(2003).
- 27
- SANDERS, T.
Cops smash 100,000 node botnet.
https://www.vnunet.com/2143475, Oct 2005.
- 28
- SAVAGE, S., WETHERALL, D., KARLIN,A.,ANDANDERSON,T.
Practical Network Support for IP Traceback.
In Proceedings of ACM SIGCOMM (2000).
- 29
- SNOEREN, A. C., PARTRIDGE, C.,
SANCHEZ, L. A., JONES, C. E.,
TCHAKOUNTIO, F., KENT, S. T., ANDSTRAYER,W. T.
Hash-Based IP Traceback .
In Proceedings of ACM SIGCOMM (2001).
- 30
- THE HONEYNET PROJECT.
Know your enemy: Tracking botnets.
https://www.honeynet.org/papers/bots.
- 31
- VASUDEVAN, R., MAO, Z. M., SPATSCHECK,O.,AND
VAN DER MERWE, J.
Reval: A Tool for Real-time Evaluation of DDoS Mitigation Strategies.
In Proceedings of USENIX Annual Technical Conference (2006).
- 32
- XU, K., ZHANG, Z.-L., AND BHATTACHARYA,S.
Profiling internet backbone traffic: Behavior models and
applications.
In Proceedings of ACM SIGCOMM (2005).
- 33
- YANG, X., WETHERALL, D., ANDANDERSON,T.
A DoS-limiting Network Architecture.
In Proceedings of ACM SIGCOMM (2005).
- 34
- ZHANG, Y., GE, Z., GREENBERG,A.,ANDROUGHAN,M.
Network anomography.
In Proceedings of ACM/USENIX Internet Measurement Conference
(IMC) (2005).
- 35
- ZHANG, Y., SINGH, S., SEN, S.,
DUFFIELD, N., AND LUND, C.
Online detection of hierarchical heavy hitters: algorithms,
evaluation, and applications.
In Proceedings of ACM/USENIX Internet Measurement Conference
(IMC) (2004).
NOTES:
1 Despite this
tunability, our experiments with a publicly available
multi-dimensional analysis tool [11],
suggest that this approach is too compute intensive to scale to the
data volumes to be analyzed.
2 Due to cost and operational
constraints commercial vendor detection systems are typically
constrained to operate in such a centralized model using feeds near
the core of the network.
3 Prior work [1]
indicates that using 40-50 frequency coefficients
can obtain a good predictive model for weekly traffic volume counts.
4Our implementation sets a
threshold of  bytes every 300 seconds on smart-sampled flow data, which roughly
translates into a raw data rate of
bytes every 300 seconds on smart-sampled flow data, which roughly
translates into a raw data rate of  Mbps. Mbps.
5Our implementation counts the number
of distinct flows and sets a threshold of 5 flows every 300 seconds,
which translates into an absolute data rate of  2.6 Mbps.
averaged over a 300 second interval. 2.6 Mbps.
averaged over a 300 second interval.
6 Due to collection issues we missed
data for the second Monday.
7 The rates for alarms of duration
longer than 300 seconds will be lower than the high intensity
thresholds of 26 Mbps for the bandwidth attacks, and 2.6 Mbps for
SYN/RST/ICMP attacks, due to the rate depreciation we discussed
earlier.
-
|