
 |
These emulation experiments demonstrate how the lease management and
configuration services scale at saturation.
Table 3 lists the parameters used in our
experiment: for a given cluster size ![]() at a single site, one service
manager injects lease requests to a broker for
at a single site, one service
manager injects lease requests to a broker for ![]() nodes (without
lease extensions) evenly split across
nodes (without
lease extensions) evenly split across ![]() leases (for
leases (for ![]() nodes
per lease) every lease term
nodes
per lease) every lease term ![]() (giving a request injection rate of
(giving a request injection rate of
![]() ). Every lease term
). Every lease term ![]() the site must reallocate or ``flip'' all
the site must reallocate or ``flip'' all ![]() nodes. We measure the total overhead
including lease state maintenance, network communication costs, actor
database operations, and event polling costs. Given parameter values
we can derive the worst-case minimum
lease term, in real time, that the system can support at saturation.
nodes. We measure the total overhead
including lease state maintenance, network communication costs, actor
database operations, and event polling costs. Given parameter values
we can derive the worst-case minimum
lease term, in real time, that the system can support at saturation.
As explained in Section 4.2, each actor's operations are
driven by a virtual clock at an arbitrary rate.
The prototype polls the status of pending lease
operations (i.e., completion of join/leave and
setup/teardown events) on each tick. Thus, the rate at
which we advance the virtual clock has a direct impact on performance:
a high tick rate improves responsiveness to events such as
failures and completion of configuration actions, but generates higher
overhead due to increased polling of lease and resource status. In
this experiment we advance the virtual clock of each actor as fast as
the server can process the clock ticks,
and determine the amount of real time it takes to complete a
pre-defined number of ticks. We measure an overhead factor ![]() : the average lease management
overhead in milliseconds per clock tick. Lower numbers are better.
: the average lease management
overhead in milliseconds per clock tick. Lower numbers are better.
Local communication.
In this experiment, all actors run on a single x335 server and
communicate with local method calls and an in-memory database (no LDAP).
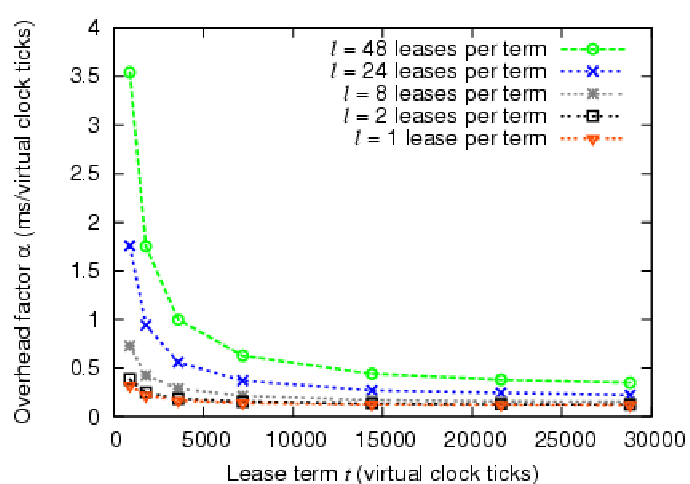
Figure 10 graphs ![]() as a function of lease term
as a function of lease term ![]() in virtual clock ticks; each line presents a different value of
in virtual clock ticks; each line presents a different value of ![]() keeping
keeping ![]() constant at 240. The graph shows that as
constant at 240. The graph shows that as ![]() increases,
the average overhead per virtual clock tick decreases; this occurs
because actors perform the most expensive operation, the reassignment
of
increases,
the average overhead per virtual clock tick decreases; this occurs
because actors perform the most expensive operation, the reassignment
of ![]() nodes, only once per lease term leaving less expensive
polling operations for the remainder of the term. Thus, as the number
of polling operations increases, they begin to dominate
nodes, only once per lease term leaving less expensive
polling operations for the remainder of the term. Thus, as the number
of polling operations increases, they begin to dominate ![]() .
Figure 10 also shows that as we increase the number of
leases injected per term,
.
Figure 10 also shows that as we increase the number of
leases injected per term, ![]() also increases. This demonstrates
the increased overhead to manage the leases.
also increases. This demonstrates
the increased overhead to manage the leases.
At a clock rate of one tick per second, the overhead
represents less than 1% of the latency to prime a node
(i.e., to write a new OS image on local disk and boot it).
As an example from
Figure 10, given this tick rate, for a lease term of 1
hour (3,600 virtual clock ticks), the total overhead of our
implementation is ![]() =
=![]() =
=![]() seconds with
seconds with ![]() =24
leases per term. The lease term
=24
leases per term. The lease term ![]() represents the minimum term we
can support considering only implementation overhead. For COD, these
overheads are at least an order of magnitude less than the
setup/teardown
cost of nodes with local storage. From this we conclude that the
setup/teardown cost, not overhead, is the
limiting factor for determining the minimum lease term. However,
overhead may have an effect on more fine-grained
resource allocation, such as CPU scheduling, where reassignments
occur at millisecond time scales.
represents the minimum term we
can support considering only implementation overhead. For COD, these
overheads are at least an order of magnitude less than the
setup/teardown
cost of nodes with local storage. From this we conclude that the
setup/teardown cost, not overhead, is the
limiting factor for determining the minimum lease term. However,
overhead may have an effect on more fine-grained
resource allocation, such as CPU scheduling, where reassignments
occur at millisecond time scales.
Table 4 shows the effect of varying the cluster size
![]() on the overhead factor
on the overhead factor ![]() . For each row of the table, the
service manager requests one lease (
. For each row of the table, the
service manager requests one lease (![]() =1) for
=1) for ![]() nodes (
nodes (![]() =
=![]() )
with a lease term of 3,600 virtual clock ticks (corresponding to a 1
hour lease with a tick rate of 1 second). We report the average and
one standard deviation of
)
with a lease term of 3,600 virtual clock ticks (corresponding to a 1
hour lease with a tick rate of 1 second). We report the average and
one standard deviation of ![]() across ten runs. As expected,
across ten runs. As expected,
![]() and
and ![]() increase with cluster size, but as before,
increase with cluster size, but as before, ![]() remains an order of magnitude less than the setup/teardown costs of a
node.
remains an order of magnitude less than the setup/teardown costs of a
node.
SOAP and LDAP. We repeat the same experiment with the
service manager running on a separate x335 server, communicating
with the broker and authority using SOAP/XML. The authority
and broker write their state to a shared LDAP directory server.
Table 5 shows the impact of the higher overhead
on ![]() and
and ![]() ,
for
,
for ![]() =240. Using
=240. Using ![]() , we calculate the maximum number of node
flips per millisecond
, we calculate the maximum number of node
flips per millisecond ![]() =
=
![]() at saturation.
The SOAP and LDAP overheads dominate all other lease
management costs: with
at saturation.
The SOAP and LDAP overheads dominate all other lease
management costs: with ![]() nodes, an x335 can process 380 node flips per second, but
SOAP and LDAP communication overheads reduce peak flip throughput
to 1.9 nodes per second. Even so,
neither value presents a limiting factor for today's cluster sizes
(thousands of nodes). Using SOAP and LDAP at saturation requires a
minimum lease term
nodes, an x335 can process 380 node flips per second, but
SOAP and LDAP communication overheads reduce peak flip throughput
to 1.9 nodes per second. Even so,
neither value presents a limiting factor for today's cluster sizes
(thousands of nodes). Using SOAP and LDAP at saturation requires a
minimum lease term ![]() of 122 seconds, which approaches the
setup/teardown latencies (Section 5.1).
of 122 seconds, which approaches the
setup/teardown latencies (Section 5.1).
From these scaling experiments, we conclude that lease overhead is quite modest, and that costs are dominated by per-tick resource polling, node reassignment, and network communication. In this case, the dominant costs are LDAP access and SOAP operations and the cost for Ant to parse the XML configuration actions and log them.