| ||||||||||||||||||||||||||||||||||||||||||||||||||||
|
USENIX '05 Paper
[USENIX '05 Technical Program]
Linux
Physical Memory Analysis Paul Movall International Business Machines Corporation 3605 Highway 52N, Ward Nelson International Business Machines Corporation 3605 Highway 52N, Shaun Wetzstein International Business Machines Corporation 3605 Highway 52N, Abstract We present a tool suite for analysis of physical memory usage within the Linux kernel environment. This tool suite can be used to collect and analyze how the physical memory within a Linux environment is being used. 1. IntroductionEmbedded subsystems are common in today's computer systems. These embedded subsystems range from the very simple to the very complex. These embedded subsystems share common attributes of cost sensitivity and constrained resources. Some of these embedded subsystems include standard operating systems, such as Linux. Due to the cost pressures that lead to constrained resources, some unique situations arise in the use of Linux in the embedded environment. An example of the constrained resources is that of memory. In a typical embedded application, the kernel and all applications can only run out of available DRAM. There is no swap space, such as on a hard disk, to allow the memory to become over committed. Consider an embedded subsystem consisting of a PowerPC processor with 64MB of vertical ECC DRAM, some Flash storage and custom I/O devices. The 64MB of DRAM includes sections not usable by the Linux kernel or any applications. These sections consume approximately 24MB of the total DRAM and include information such as DRAM ECC overhead, temporary and persistent file systems, crash dump storage, etc. The remaining 40MB is presented to the kernel for operating system and application use. In this subsystem, we experienced various out of memory situations, ranging from significant application performance problems due to thrashing of executable pages to the killing of selected processes by the automated out of memory handling of the kernel. After numerous Internet searches, we determined that there was no publicly available tool suite to analyze physical memory usage in real time on a running system using the Linux kernel. There are many tools, such as mpatrol [1] or memprof [2], which can be used for memory analysis. These tools focus on dynamically allocated virtual memory usage within a particular process. However our requirement was for systematic view physical memory usage across all usage types. A significant amount of this information can alo be found in the /proc filesystem provided by the kernel. These /proc entries can be used to obtain many statistics including several related to memory usage. For example, /proc/<pid>/maps can be used to display a process' virtual memory map. Likewise, the contents of /proc/<pid>/status can be used to retreive statistics about virtual memory usage as well as the Resident Set Size (RSS). In most cases, this process level detail is sufficient to analyze memory usage. In systems that do not have backing store, more details are often needed to analyze memory usage. For example, it's useful to know which pages in a process' address map are resident, not just how many. This information can be used to get some clues on the usage of a shared library. Also, since this information is process based, there is no way to tell if the resident pages are shared between processes. Yet this sharing of pages is a very important optimization performed by the kernel that can not be tracked with the existing tools. We researched the Linux VMM from [3] and started the process of developing a tool suite to analyze the use of physical memory within a subsystem. This included the usage of memory by the kernel and user space applications. This paper focuses on the analysis of user space applications. Kernel usage was determined using the slab information. 1. ArchitectureThe basic requirement of the tool suite is to be able to determine physical memory usage in real time of an operational system with minimal impact to that system. In addition, in the case where a kernel panic did occur and a dump was available, the tool suite should be able to extract the pertinent information from the dump and provide the same analysis capability based off of the dump. 1.1. Design GoalsThe design goals were to keep it simple, keep it small, and provide useful information in a very quick turn around time. The tool suite was divided into data collection and data analysis tools. This allows each tool to be customized to the particular environment in which it must run. It also allows for a separation of the functionality and staging of the deliveries. In fact the initial delivery of the tool set contained only the data collection tools. The data was analyzed manually within a spreadsheet. The analysis tools were added later to help automate the analysis process. 1.2. ImplementationAs mentioned previously, the tool suite is split into a data collection tool and a data analysis tool. The following sections describe each tool independently. 1.2.1. Data CollectionThe data collection tool started out with two versions. The first version was a loadable kernel module that was installed into the kernel and provided a user interface to extract the data. It used the global internal kernel data structures of the VMM to collect the various information of virtual and physical memory usage. The internal VMM structures need to be collected as the virtual memory of a process is created at the request of the process, but the physical memory is only assigned when it has been accessed. Without the VMM structures, there is no way to determine which virtual pages have physical pages associated with them. The second version was a user space application that probed the kernel memory through the /dev/kmem device. This version is more difficult to build and maintain than the module as kernel structures are being used in user space. Also, the impact of the user application on the running system was larger than that of the kernel module. Lastly, there was some function that was not possible to implement with the user space application. Due to these factors, only the kernel module is support for data collection on a running system. A third version of the data collection is available for the crash utility as described in [4]. The tool suite provides a data collection module that can extend the crash utility when the mcore form of the Linux kernel dump is used. This provides data in the same format as the kernel module so that the same analysis tools can be used. All versions of the collection tools collect the same information in the same format. This is required to be able to feed into the same analysis tool. The data starts out with the process information. This includes the process identifier (PID), the command used to start the process, the value of the pointer to the memory management (MM) structures, page fault numbers, and used time counters. These last numbers have recently been added. The analysis tool can parse them but does not currently perform any analysis on them. The page fault numbers have been added to get an indication of how many pages faults happen over a period of time. That metric can be used as an indication of approaching the point of thrashing. After the process information is dumped, the data is dumped in a set of three values. The first part of this trio is the virtual memory area (VMA). This provides the virtual start address, length, and various flags. The second part of this trio is a summary of the page table entries (PTEs) that are associated to that VMA. The third part of the trio is the detailed mappings from virtual page to physical page that is provided by the PTE. There is also a set of flags with this information. The output is in a terse format to minimize space and limit the performance and memory requirements to collect and store the data. It dumps this information for all Linux tasks, resulting in a requirement on the analysis tool to sort out thread from processes. This can be done using the MM pointers. Sample output of the collected data is provided later in this document and shown in Figure 1. 1.2.2. Data AnalysisThe data analysis tool takes as input the output from the data collection tools and produces a variety of formatted output. In its simplest mode, it provides a comma separated value file that can be imported into a spreadsheet for further analysis manually. It can also provide graphic output, in the form of PostScript, of various metrics of physical and virtual memory usage. The data analyzer parses information in the following forms. · Basic process information, available in either physical or virtual memory views as PostScript or comma separated values, which includes: · total number of read-only and read/write pages assigned to a process, · number of pages assigned to the process stack, · number of pages assigned to global data areas (both .bss and .data), · number of pages assigned to heap space, · number of pages assigned to the application executable code, · number of pages in shared library global data (.data and .bss), · number of pages in shared library executable code; · A view of the unique virtual memory areas (VMAs) within the process including virtual and physical sizes and the mapping of physical pages within the virtual space; · A view of all unique executable entities (application code and shared libraries) coalesced across all processes that shows the virtual and physical sizes as well as the mapping of physical pages within the virtual space; · For all unique executable entities (application code and shared libraries) a view of the count of physical pages for the executable (i.e., .text) and global data (i.e., .data and .bss) areas of each entity, available as a physical or virtual view as PostScript or comma separated values; · Detection within a virtual memory area of single and multiple use pages (more on this later); · The total number of physical pages used by user space applications; · A dump of the physical page structures used within the kernel that are assigned to user space processes for further manual analysis. Sample output of the various analyzed data is provided later in this document. 1.2.3. Operating EnvironmentsThe kernel module supports both PPC and Intel processor architectures. It uses only architecture independent structures, interfaces, and macros, and should be easily ported to other processor architectures. The dump data extractor supports a PPC dump being analyzed on an Intel Linux environment. There are some architecture dependent structures used in this environment and therefore would be harder to port. The data analysis tool supports Intel Linux and Intel Cygwin operating environments. It uses a simple text based selection mechanism and has no graphical user interface. It should port easily to other GNU C environments. 2. UsageThe following sections provide sample invocations and output of the various portions of the tool suite. 2.1. Data CollectionThe primary collection tool is the kernel module. It can be installed using the insmod command. insmod physmem_info_ppc.o The output of the kernel module is extracted from a special character device. In the current implementation, this device is created using devfs. A device interface was used as the amount of data can be quite significant. It also minimized the complexity in the driver by not having to provide a simple character stream for the data. All of the buffering has been pushed out of the kernel and into user space. A simple mechanism to extract this information is to use the dd command. In order to keep the kernel module simple, the device actually blocks all of the task data into one read command. To determine the minimum read size, use the information in the following file. /proc/physical_info/debug_task_mem The content of this file will specify the maximum size of an output block. Using this information, the following command can be used to extract the physical per process usage. dd if=/dev/task_mem/0
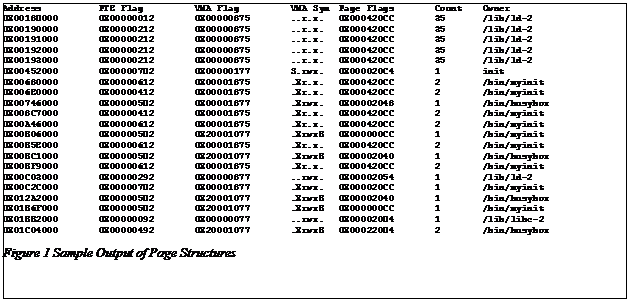
of=<output file> bs=<block size from /proc/physical_info/debug_task_mem> Now the output will be located in <output file>. Since this information can be quite large, it is unlikely that the information will be able to be stored directly on the embedded system. In our usage, an NFS mount was used to store the output file. Sample output of the collected data is shown in Figure 1. This example provides a good sample of the data. The task line starts with the T: and provides information on the kernel task. This data includes the command use to start the task, the process identifier, the pointer to the memory map, the CPU number that this process is associated with, page fault information, and usage times. The memory map pointer is used by the analysis tools to determine the difference between a pthread within a process (with the same memory map) and a unique process with the same name (different memory map). The other information, such as the page faults, can be used to detect thrashing. The time measurements could be used by performance analyzers to determine the usage patterns across various processes across time.
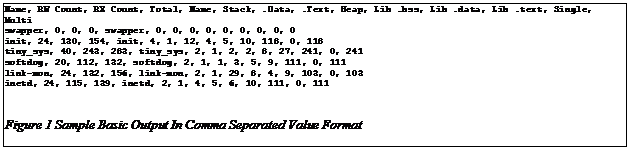
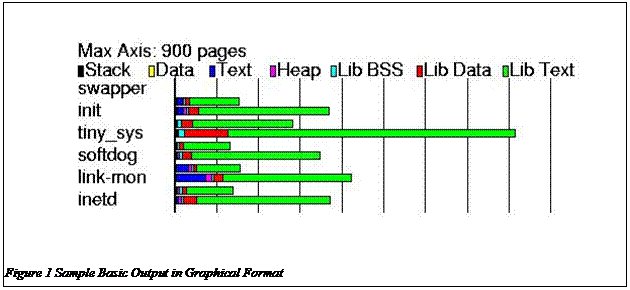
Also with the VMA is the page table entry summary for that particular VMA. This is started with the P: key. The information in this stanza of the output is the number of user space pages, executable pages, read-only pages, single-use pages, and shared pages. All of these are in terms of physically resident pages. For those VMAs with physically resident pages, the mapping from virtual to physical is also provided by the M: stanza. The information provided here includes the virtual address, the physical address, the usage count of this physical page, and various page flags. Note that these are separated with a unique character to ease parsing in the analyzer. 2.2. Post Processing / AnalysisNow that the data has been collected, it must be analyzed for meaningful usage. As discussed earlier in this paper, the analyzer is capable of performing 8 different types of analysis. Some of these have various forms including comma separated values, graphical in PostScript, or simple text. Each of these is described below and samples are provided. 2.2.1. Basic InformationThis option provides basic summary information on an application (or process) basis. This information consists of the number of pages for the following: · Stack · Heap and global uninitialized data (.bss) for the application · Global initialized data (.data) for the application · Text / code for the application · Global uninitialized data (.bss) for all shared libraries used by this process · Global initialized data (.data) for all shared libraries used by this process · Text / code pages for all shared libraries used by this process All of the above fields can be provided in both virtual pages and physical pages. The physical pages option provides only the actually resident page counts, whereas the virtual option provides the full virtual size requested. In addition in the virtual option, the graphical output has both physical and virtual indicators so that direct comparisons can be made. An example of the comma separated value output for this option is provided in Figure 2. An example of the graphical output displaying this for both virtual and physical is provided in Figure 3. In this example, the tiny_sys application has over 800 pages of virtual address space and almost 300 pages of physically resident memory. Each of the various memory types is represented by a separate color on the graph.
2.2.2. Information per VMAThis option of the analyzer provides information on how a VMA is mapped to physical pages. This information can be used to determine how much of a library is used. It can also be used to arrange data areas within a VMA to make the accesses of these areas have better affinity. An example of this information is provided in Figure 4.
· 'S' is for stack; · 'X' is for association directly to the application and not to any of the shared libraries required by the application; · 'r', 'w', 'x', for read, write, and execute permissions respectively; · 'B' for .bss or heap data areas. After the VMA mappings, the application summary of how each of the physical pages are used is also provided. These are all shown in this example. 2.2.3. Information for Executable Units Across All ProcessesThe previous information provided a view of each VMA for each particular process. This option provides similar information, but this time across all processes. This information can be used to determine the total usage of a shared library. This can be useful information for the amount of overhead associated with all shared libraries across the entire system. An example of this information is show in Figure 5. Note that this is different than the previous example as this information is organized by executable unit rather than by process. Also note that the mapping of virtual pages to physical pages follows the same format as in the previous example, with a period meaning no physical mapping.
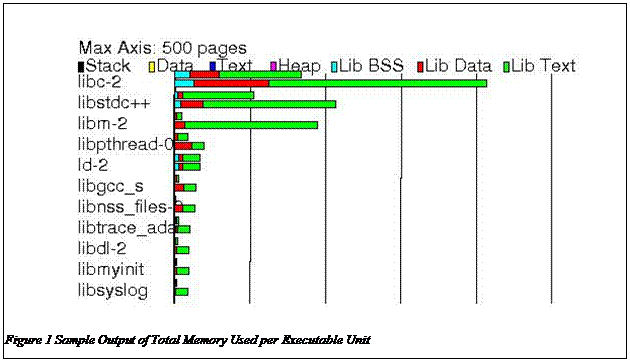
2.2.4. Total Memory Usage per Executable UnitThis output provides the information on the total memory usage of a particular executable unit. As with the per process view, this output is provided in both virtual memory and physical memory pages. This provides the total usage across all portions of the executable unit including code and global data. In this view, pages assigned to a particular process, such as stack and heap space, are not included. This option is to help analyze shared library usage of memory. An example of this is shown in Figure 6. Again, this example provides both a virtual and a physical view of required and used pages. For example, libc requires just over 400 virtual pages and approximately 175 physical pages across all processes. The virtual requirement is split into approximately 25 pages of uninitialized global data, 100 pages of initialized data, and 275 pages of code. This data is also available in the comma separated value format suitable for import into a spread sheet.
2.2.5. Non-shared Pages in Shared LibrariesThe next analyzer output shows the virtual memory areas that have both single use and shared use pages. If this VMA is used in another process, all of the single use pages are copied into each process instead of being shared. An example of this is shown in Figure 7. As shown in the example, the flags for the VM areas have read and execute permissions, indicating that these are associated with code. Code pages do not need to be single use and should be shared.
2.2.6. Number of Physical Pages UsedIn order to track the usage of physical pages from one code version to the next, the analyzer can simply output the number of physical pages used by user space processes. This information can then be easily tracked across each version of code. This is useful to insure that as changes are made and new function is added, that we do not approach the limit of physical memory. An example of the output is shown below in Figure 8.
In this example, 439 pages of physical memory where used by user space processes. Note that all of the output has been in terms of pages. This keeps the entire tool suite, from the collection tools to the analyzer, to be architecture independent. To correlate to the actual number of bytes, the number of pages must be multiplied by the physical page size. For 32 bit PowerPC and Intel x86, the physical page size is 4kB. 2.2.7. Dump of Physical Page StructuresAs shown in previous examples, the output of the analyzer can be provided in a format for further manual analysis. Typically this includes the CSV format so that the data can be imported into a spread sheet application. In this case, the output is in a human readable form for easier manual analysis. The data provided for this option is the physical address, the PTE and VMA flags for that page, the symbolic representation of the VMA flags, the flags for the page within the page struct, the usage count of the page, and the executable unit to which the page is assigned. Details on the page struct can be found in [3]. This information can be analyzed to find any type of usage pattern or any other type of information that may become apparent upon inspection. An example of this output is shown in Figure 9. In this example the first page shown is a text page (as noted by the flags of 'r.x') from /lib/ld-2 with a usage count of 35.
3. ResultsWe have uncovered numerous improper usage of memory in our testing using this tool suite. Below are some examples of the changes that have been made based on the output of this tool suite. None of these would have been easy to detect without this tool suite. · Many shared libraries were not being compiled with the position independent code flag. This caused the text (i.e., executable code) pages to be copied uniquely into each process instead of being shared. · The amount of overhead in physical pages for a process for each shared library it uses. While this latter fact would have been detected with easily available information (such as /proc/<pid>/maps), it was not obvious how this was contributing to the overall usage of physical memory. · We have also been able to show that a number of processes leak memory. Using the tool suite, we were able to deduce an approximate leakage size. This would allow a developer to more quickly find their memory leak. With the changes for position independent code, shared library repackaging, and a reduction in the number of linked shared libraries, we have been able to successfully reduce physical memory consumption. For example, the change for the position independent code flag on the compiled libraries saved over 4MB alone. 4. SummaryThis tool suite identified many improper usages of physical memory. It has usage across any constrained memory system using Linux as its operating system. For the future, the inkernel data collection tool needs to be ported to Linux 2.6. In addition, the analyzer should be enhanced to use the page fault numbers to detect trashing. The source code for the tool suite is available from USENIX along with the transcript of this paper. The code is available as a tar.gz file that contains the source, Makefiles, and Doxygen control files. 5. References[1] G. Roy, “mpatrol”, http://www.cbmamiga.demon.co.uk/mpatrol/ [2] O. Taylor, “MemProf - Profiling and leak detection”, http://www.gnome.org/projects/memprof/ [3] M. Gorman, “Understanding the Linux Virtual Memory Manager”, http://www.skynet.ie/~mel/projects/vm/guide/pdf/understand.pdf, February 2003. [4] Mission Critical Linux, “In Memory Core Dump”, http://oss.missioncriticallinux.com/projects/mcore/ |
|
This paper was originally published in the
Proceedings of the 2005 USENIX Annual Technical Conference,
April 10–15, 2005, Anaheim, CA, USA Last changed: 3 Mar. 2005 aw |
|
![Text Box: init:
vsize: 285, single: 0, shared: 93, flags: ..r.x., 0X0FE94000, 0X0FFB0FFF, name: /lib/libc-2
[##############################...................####.#.........]
[..........###.#....####.##........####....##.#########.######...]
[................#####....##...##.......................#......##]
[#......#..#.#.#...............................................#.]
[...............##.#####.#.... ]
vsize: 3, single: 0, shared: 0, flags: ......, 0X0FFB1000, 0X0FFB3FFF, name: /lib/libc-2
[... ]
vsize: 20, single: 8, shared: 0, flags: ..rwx., 0X0FFB4000, 0X0FFC7FFF, name: /lib/libc-2
[............11111111 ]
vsize: 5, single: 4, shared: 0, flags: ..rwxB, 0X0FFC8000, 0X0FFCCFFF, name: NULL
[1111. ]
vsize: 3, single: 0, shared: 2, flags: ..r.x., 0X0FFDD000, 0X0FFDFFFF, name: /lib/libmyinit
[#3. ]
vsize: 13, single: 0, shared: 0, flags: ......, 0X0FFE0000, 0X0FFECFFF, name: /lib/libmyinit
[............. ]
vsize: 3, single: 1, shared: 0, flags: ..rwx., 0X0FFED000, 0X0FFEFFFF, name: /lib/libmyinit
[..1 ]
vsize: 15, single: 0, shared: 12, flags: .Xr.x., 0X10000000, 0X1000EFFF, name: /bin/myinit
[..2222.22222222 ]
vsize: 1, single: 1, shared: 0, flags: .Xrwx., 0X1001E000, 0X1001EFFF, name: /bin/myinit
[1 ]
vsize: 7, single: 4, shared: 0, flags: .XrwxB, 0X1001F000, 0X10025FFF, name: NULL
[111.1.. ]
vsize: 23, single: 0, shared: 23, flags: ..r.x., 0X30000000, 0X30016FFF, name: /lib/ld-2
[####################### ]
vsize: 1, single: 1, shared: 0, flags: ..rwx., 0X30026000, 0X30026FFF, name: /lib/ld-2
[1 ]
vsize: 1, single: 1, shared: 0, flags: ..rwxB, 0X30027000, 0X30027FFF, name: NULL
[1 ]
vsize: 4, single: 4, shared: 0, flags: S.rwx., 0X7FFFC000, 0X7FFFFFFF, name: NULL
[1111 ]
Process "init" has 24 rw and 130 rx pages, (154 pages total)
For [init]: 4 stack, 1 data, 12 .text, 4 heap
For libraries: 5 .bss, 10 .data, 118 .text
0 are used only in this process, 118 are shared
Figure 4 Sample Output of VMA Information per Process](physmem_final_files/image005.gif)
![Text Box: /lib/libc-2 is used 5 times with 285 virtual pages and 109 resident pages and flags ..r.x. has the following map:
[555555555555555555555555555555..........111......5555.5.........]
[..........555.4....5333134........5443....34.4455555541555555.1.]
[................43444....22...5511..1..1..............44......45]
[5.2...35..3.3.5.............................................225.]
[...............54.53455141... ]
/lib/libc-2 is used 5 times with 3 virtual pages and 0 resident pages and flags ...... has the following map:
[... ]
/lib/libc-2 is used 5 times with 20 virtual pages and 8 resident pages and flags ..rwx. has the following map:
[............55555555 ]
/lib/libc-2 is used 5 times with 5 virtual pages and 5 resident pages and flags ..rwxB has the following map:
[55351 ]
/lib/ld-2 is used 5 times with 23 virtual pages and 23 resident pages and flags ..r.x. has the following map:
[55555555555555555555555 ]
/lib/ld-2 is used 5 times with 1 virtual pages and 1 resident pages and flags ..rwx. has the following map:
[5 ]
/lib/ld-2 is used 5 times with 1 virtual pages and 1 resident pages and flags ..rwxB has the following map:
[5 ]
Figure 5 Sample Output of VMA Information per Executable Unit](physmem_final_files/image006.gif)
![Text Box: Alert! VMA [/lib/libc-2] in "link-mon" has 2 single usage and 6 shared usage, flags = 00000077
Alert! VMA [NULL] in "link-mon" has 6 single usage and 2 shared usage, flags = 20001077
Alert! VMA [NULL] in "link-mon" has 1 single usage and 1 shared usage, flags = 00000177
Figure 7 Sample Output for Non-shared Pages in Shared Libraries](physmem_final_files/image009.gif)