


Next: Performance Analysis
Up: Simulation and Results
Previous: Simulation Experiments
Results
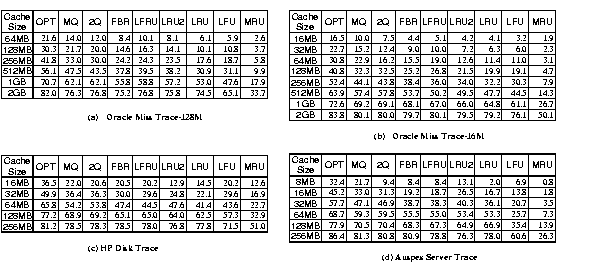
Table 2 shows that the MQ algorithm performs better than
other on-line algorithms. Its performance is robust for different
workloads and cache sizes. MQ is substantially better than LRU. With
the Oracle Miss Trace-128M, LRU's hit ratio is 30.9% for a 512 Mbytes
server cache, whereas MQ's is 47.5%, a 53% improvement. For the
same cache size, MQ has a 10% higher hit ratio than FBR. The main
reason for MQ's good performance is that this algorithm can selectively
keep warm blocks in caches for a long period of time till subsequent
correlated accesses.
LRU does not perform well for the four server cache access traces,
though it works quite well for client buffer caches. This is because
LRU does not keep blocks in the cache long enough. The LFU algorithm
performs worse than LRU. The long temporal distance ( ) at
server buffer caches makes frequency values inaccurate. Of the
eight on-line algorithms, the MRU algorithm has the worst performance.
Although this algorithm can keep old blocks for a long time in
server buffer caches, it does not consider frequencies. As a result,
some blocks kept in server buffer caches for a long time are not
accessed frequently.
FBR, LFRU and LRU-2 perform better than LRU but always worse than
MQ. The gap between these three algorithms and MQ is quite large in several
cases. Although FBR and LFRU can overcome some of the LRU drawbacks by
taking access frequency into account, it is difficult to choose
the right combination of frequency and recency by tuning the
parameters for these two algorithms. LRU-2 does not work
well because it favors blocks with small temporal distances.
2Q performs better than other on-line algorithms except MQ. With a
separate queue (
) at
server buffer caches makes frequency values inaccurate. Of the
eight on-line algorithms, the MRU algorithm has the worst performance.
Although this algorithm can keep old blocks for a long time in
server buffer caches, it does not consider frequencies. As a result,
some blocks kept in server buffer caches for a long time are not
accessed frequently.
FBR, LFRU and LRU-2 perform better than LRU but always worse than
MQ. The gap between these three algorithms and MQ is quite large in several
cases. Although FBR and LFRU can overcome some of the LRU drawbacks by
taking access frequency into account, it is difficult to choose
the right combination of frequency and recency by tuning the
parameters for these two algorithms. LRU-2 does not work
well because it favors blocks with small temporal distances.
2Q performs better than other on-line algorithms except MQ. With a
separate queue ( ) for blocks that have only been accessed
once, 2Q can keep frequently accessed blocks in the
) for blocks that have only been accessed
once, 2Q can keep frequently accessed blocks in the  queue for a
long period of time. However, when the server buffer cache size is
small, 2Q performs worse than MQ. For example, with Oracle Miss
Trace-128M, 2Q has a 4% lower hit ratio than MQ for a 512 MBytes
cache. With Oracle Miss Trace-16M, the gap between MQ and 2Q is
6.7% for a 64 MBytes cache. This is because the lifetime of
a block in the 2Q server buffer cache is not long enough to keep the block
resident for the next access.
queue for a
long period of time. However, when the server buffer cache size is
small, 2Q performs worse than MQ. For example, with Oracle Miss
Trace-128M, 2Q has a 4% lower hit ratio than MQ for a 512 MBytes
cache. With Oracle Miss Trace-16M, the gap between MQ and 2Q is
6.7% for a 64 MBytes cache. This is because the lifetime of
a block in the 2Q server buffer cache is not long enough to keep the block
resident for the next access.
Table 2:
Hit ratios in percentage
 |
Next: Performance Analysis
Up: Simulation and Results
Previous: Simulation Experiments
Yuanyuan Zhou
2001-04-29