As we discussed earlier, web based malware uses a pull-based delivery mechanism in which a victim is required to visit the malware hosting server or any URL linking to it in order to download the malware. This behavior puts forward a number of challenges to defense mechanisms (e.g., malware signature generation schemes) mainly due to the inadequate coverage of the malware collection system. For example, unlike active scanning malware which uses a push-based delivery mechanism (and so sufficient placement of honeypot sensors can provide good coverage), the web is significantly more sparse and, therefore, more difficult to cover.
In what follows, we evaluate the potential implications of the web malware delivery mechanism by measuring the detection rates of several well known anti-virus engines. Specifically, we evaluate the detection rate of each anti-virus engine against the set of suspected malware samples collected by our infrastructure. Since we can not rely on anti-virus engines, we developed a heuristic to detect these suspected binaries before subjecting them to the anti-virus scanners. For each inspected URL via our in-depth verification system we test whether visiting the URL caused the creation of at least one new process on the virtual machine. For the URLs that satisfy this condition, we simply extract any binaryWe restrict our analysis to Windows executables identified by searching for PE headers in each payload. download(s) from the recorded HTTP response and ``flag'' them as suspicious.
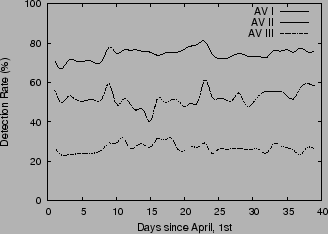
We applied the above methodology to identify suspicious binaries on a daily basis over a one month period of April, 2007. We subject each binary for each of the anti-virus scanners using the latest virus definitions on that day. Then, for an anti-virus engine, the detection rate is simply the number of detected (flagged) samples divided by the total number of suspicious malware instances inspected on that day. Figure 16 illustrates the individual detection rates of each of the anti-virus engines. The graph reveals that the detection capability of the anti-virus engines is lacking, with an average detection rate of 70% for the best engine. These results are disturbing as they show that even the best anti-virus engines in the market (armed with their latest definitions) fail to cover a significant fraction of web malware.