16th USENIX Security Symposium
Pp. 103–118 of the Proceedings
Human-Seeded Attacks and
Exploiting Hot-Spots in Graphical Passwords*
Julie Thorpe and P.C. van Oorschot
School of Computer Science, Carleton University
{jthorpe, paulv}@scs.carleton.ca
|
Abstract:
Although motivated by both usability and security concerns, the existing literature on click-based graphical password schemes using a single background image (e.g., PassPoints) has focused largely on usability. We examine the security of such schemes, including the impact of different background images, and strategies for guessing user passwords. We report on both short- and long-term user studies: one lab-controlled, involving 43 users and 17 diverse images, and the other a field test of 223 user accounts. We provide empirical evidence that popular points (hot-spots) do exist for many images, and explore two different types of attack to exploit this hot-spotting: (1) a “human-seeded” attack based on harvesting click-points from a small set of users, and (2) an entirely automated attack based on image processing techniques.
Our most effective attacks are generated by harvesting password data from a small set of users to attack
other targets. These attacks can guess 36% of user passwords within 231 guesses (or 12% within 216 guesses) in one instance, and 20% within 233 guesses (or 10% within 218 guesses) in a second instance. We perform an image-processing attack by implementing and adapting a bottom-up model of visual attention,
resulting in a purely automated tool that can guess up to 30% of user passwords
in 235 guesses for some instances, but under 3% on others.
Our results suggest that these graphical password schemes
appear to be at least as susceptible to offline attack
as the traditional text passwords they were proposed to replace.
1 Introduction
The bane of password authentication using text-based passwords
is that users choose passwords which are easy to remember,
which generally translates into passwords that are easily guessed.
Thus even when the size of a password space may be theoretically “large enough”
(in terms of number of possible passwords), the effective password space from
which many users actually choose passwords is far smaller.
Predictable patterns, largely due to usability and memory issues,
thus allow successful search by variations of exhaustive guessing attacks.
Forcing users to use “random” or other non-meaningful passwords results in
usability problems.
As an alternative, graphical password schemes
require that a user remembers an image (or parts thereof) in place of a word. They
have been largely motivated by the well-documented human ability
to remember pictures better than words [25],
and implied promises that the password spaces of various image-based schemes are
not only sufficiently large to resist guessing attacks, but that the effective password
spaces are also sufficiently large. The latter, however, is not well established. Among the graphical password schemes proposed to date, one that has
received considerable attention in the research literature is
PassPoints [45, 46, 47].
It and other click-based graphical password schemes [18, 4, 31, 37] require
a user to log in by clicking a sequence of points on a single background image.
Usability studies have been performed to determine the optimal amount of error tolerance [46], login and creation times, error rates, and general perception [45, 47].
An important remaining question for such schemes is: how secure are they?
This issue remains largely unaddressed, despite speculation that the security
of these schemes likely suffers from hot-spots – areas of an image that are
more probable than others for users to click.
Indeed, the impact of hot-spots has been downplayed (e.g., see [45, Section 7]).
In this paper, we focus on a security analysis of an implementation with the same parameters as used in a recent PassPoints publication [47].
A usability analysis of this implementation is presented in a separate paper [6].
We confirm the existence of hot-spots through empirical studies,
and show that some images are more susceptible to hot-spotting than others.
We also explore the security impact of hot-spots, including
a number of strategies for exploiting them under an offline model similar to that used
by Ballard et al. [1].
Our work involves two user studies.
The first (lab) study used 17 diverse images (four used in previous studies
[46], and 13 of our own chosen to represent a range of detail).
We collected graphical passwords for 32-40 users
per image in a lab setting, and found hot-spots on all images even from this relatively small sample size;
some images had significantly more hot-spots than others.
In the second (field) study involving 223 user accounts over a minimum of seven weeks, we explore two of these images in greater depth.
We analyzed our lab study data using formal measures of security to make an informed decision of which two images to use in the field study. Our goal was to give PassPoints the best chance we could (in terms of anticipated security), by using one highly ranked image, and another mid-ranked image also used in previous PassPoints studies. We implement and evaluate two types of attack: human-seeded and purely automated.
Our human-seeded attack is based on harvesting password data from a small number of users
to attack passwords from a larger set of users. We seed various dictionaries with the passwords collected in our lab study, and apply them to guess the passwords from our long-term field study.
Our results demonstrate that
this style of attack is quite effective against this type of graphical password: it correctly guessed 36% of user passwords within 231 guesses (or 12% within 216 guesses) on one image, and 20% within 233 guesses (or 10% within 218 guesses) on a second image.
We implement and adapt a combination of image processing methods
in an attempt to predict user choice,
and employ them as tools to expedite guessing attacks on the user study passwords.
The attack works quite well on some images, cracking up to 30% of passwords,
but less than 3% on others within 235 guesses. These results give an early
signal that image processing can be a relevant threat, particularly as better methods emerge.
Our contributions include the first in-depth study of hot-spots in click-based (or cued-recall)
graphical passwords schemes and their impact on security through two separate user studies: one lab-controlled and the other a field test.
We propose the modification and use of image processing methods to expedite
guessing attacks, and evaluate our implementation against the images used in our studies.
Our implementation is based on Itti et al.'s [17] model of bottom-up visual attention and corner detection, which allowed
successful guessing attacks on some images, even with relatively naive dictionary strategies.
Our most interesting contribution is applying a human-seeded attack strategy, by harvesting password data in a lab setting from small sets of users, to attack other field study passwords. Our human-seeded attack strategy for cued-recall graphical passwords is similar to Davis et al.'s attack [8] against recognition-based graphical passwords; notable differences include a more straightforward dictionary generation method, and that our seed data is from a separate population and (short-term) setting. The remainder of this paper is organized as follows.
Section 2 provides background and terminology.
Section 3 presents our lab-controlled user study,
and an analysis of observed hot-spots and the distribution of user click-points.
Section 4 presents results on the larger (field) user study,
and of our password harvesting attacks.
Section 5 explores our use of
image processing methods to expedite guessing attacks
on the 17 images from the first user study and the two from the second user study.
Related work is briefly discussed in Section 6.
Section 7 provides further discussion and concluding remarks.
2 Background and Terminology
Click-based graphical passwords require users to log in by clicking a sequence of
points on a single background image. Many variations are possible
(see Section 6), depending on what points a user is allowed to select.
We study click-based graphical passwords by allowing clicks anywhere on the image
(i.e., PassPoints-style). We believe that most findings related to hot-spots
in this style will apply to other variations using the same images,
as the “interesting” clickable areas are still present.
We use the following terminology.
Assume a user chooses a given click-point c as part of their password.
The tolerable error or tolerance t is the error allowed
for a click-point entered on a subsequent login to be accepted as c.
This defines a tolerance region (T-region) centered on c,
which
for our implementation using t=9 pixels, is a 19 × 19 pixel square.
A cluster is a set of one or more click-points that lie within a
T-region. The number of click-points belonging to a cluster is its size.
A hot-spot is indicated by a cluster that is large, relative to the number of users in a given sample.
To aid visualization and indicate relative sizes for clusters of size at least two,
on figures we sometimes represent the underlying cluster by a shaded circle or
halo with halo diameter proportional to its size. An alphabet is a set of distinct T-regions;
our implementation, using 451 × 331 pixel images,
results in an alphabet of m = 414 T-regions. Using passwords composed of 5-clicks,
on an alphabet of size 414 provides the system with only a 43-bit full theoretical password
space; we discuss the implications of this in Section 7.
3 Lab Study and Clustering Analysis
Here we report on the results of a university-approved 43-user study
of click-based graphical passwords in a controlled lab environment.
Each user session was conducted individually and lasted about one hour.
Participants were all university students who were not studying
(or experts in) computer security. Each user was asked to create a click-based
graphical password on 17 different images
(some of these are reproduced herein; others are available from the authors).
Four of the images are from a previous
click-based graphical password study by Wiedenbeck et al. [46]; the
other 13 were selected to provide a range of values based on two image
processing measures that we expected to reflect the amount of detail: the number
of segments found from image segmentation [11] and the number of
corners found from corner detection [16]. Seven of the 13 images were chosen to be those we “intuitively” believed would encourage
fewer hot-spots; this is in addition to the four
chosen in earlier research [46] using intuition (no further details were provided on their image selection methodology). Experimental Details.
We implemented a web-based experiment.
Each user was provided a brief explanation of what click-based graphical
passwords are, and given two images to practice creating and confirming
such passwords. To keep the parameters as consistent as
possible with previous usability experiments of such passwords
[47], we used d = 5 click-points for each password, an image size of 451 × 331
pixels, and a 19 × 19 pixel square of error
tolerance.
Wiedenbeck et al. [47] used a tolerance of 20 ×
20, allowing 10 pixels of tolerated error on one side and 9 on the other. To
keep the error tolerance consistent on all sides, we approximate this error
tolerance using 19 × 19. Users were instructed to choose a password by
clicking on 5 points, with no two the same.
Although the software did not enforce this condition, subsequent analysis
showed that the effect on the resulting cluster sizes was negligible for all images
except pcb; for more details, see caption of Figure 1.We did not assume a specific encoding scheme (e.g., robust discretization [3]
or other grid-based methods); the concept of hot-spots and user
choice of click-points is general enough to apply across all encoding schemes.
To allow for detailed analysis, we store and compare the actual click-points. Once the user had a chance to practice a few passwords, the main part
of the experiment began. For each image, the user was asked to create a
click-based graphical password that they could remember but that others will not
be able to guess, and to pretend that it is protecting their bank information.
After initial creation, the user was asked to confirm
their password to ensure they could repeat their click-points. On successful
confirmation, the user was given 3D mental rotation tasks [33] as a
distractor for at least 30 seconds. This distractor was presented to remove the password from their visual working memory, and thus simulate the effect of the passage of time.
After this period of memory tasks, the user was provided the image
again and asked to log in using their previously selected password. If the user
could not confirm after two failed attempts or log in after one failed attempt,
they were permitted to reset their password for that image and try again. If
the user did not like the image and felt they could not create and remember a
password on it, they were permitted to skip the image.
Only two images
had a significant number of skips: paperclips and bee.
This suggests some passwords for these images were not repeatable,
and we suspect our results for these images would show lower relative security in practice. To avoid any dependence on the order of images presented, each user was
presented a random (but unique) shuffled ordering of the 17 images used. Since
most users did not make it through all 17 images, the number of graphical
passwords created per image ranged from 32 to 40, for the 43 users.
Two users had a “jumpy” mouse, but we do not expect this to affect our present
focus – the location of selected click-points.
This short-term study was intended to collect data on initial user choice; although the
mental rotation tasks work to remove the password from working memory, it does not
account for any effect caused by password resets over time due to forgotten
passwords. The long-term study (Section
4) does account for this effect, and we compare the results.
3.1 Results on Hot-Spots and Popular Clusters Observed
To explore the occurrence of hot-spotting in our lab user study,
we assigned all the user click-points observed in the study to clusters as follows.
Let R be the raw (unprocessed) set of click-points, M a list of temporary clusters, and V the final resulting set of clusters.
-
For each ck ∈ R, let Bk be a temporary cluster containing click-point ck.
Temporarily assign all user click-points in R within ck's T-region to Bk. Add Bk to M.
- Sort all clusters in M by size, in decreasing order.
- Greedily make permanent assignments of click-points to clusters as follows.
Let Bℓ be the largest cluster in M. Permanently assign each click-point ck ∈ Bℓ to Bℓ, then delete each ck ∈ Bℓ from all other clusters in M.
Delete Bℓ from M, and add Bℓ to V. Repeat until M is empty.
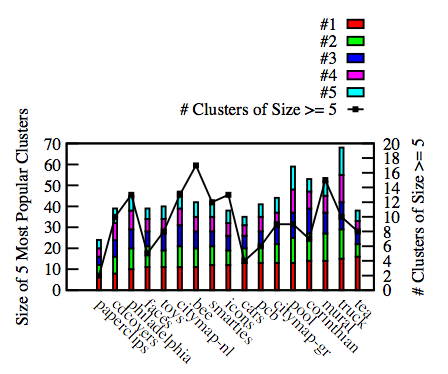
| Figure 1: The five most popular clusters (in terms of size, i.e., # of times selected),
and # of popular clusters (size ≥ 5). Results are from 32-40 users, depending on the image, for the final passwords created on each image.
For pcb, which shows only 6 clusters of size ≥ 5, the size of clusters 2-5 become 5, 5, 4, and 3 when counting at most one click from each user. |
This process determines a set V of (non-empty) clusters and their sizes.
We then calculate the observed “probability” pj (based on our user data set) of
the cluster j being clicked,
as cluster size divided by total clicks observed. When the probability
pj of a certain cluster is sufficiently high, we can place a confidence
interval around it for future populations (of users who are similar in background to those in our study)
using (1) as discussed below. Each probability pj estimates the probability of a cluster being clicked for
a single click. For 5-click passwords, we approximate the
probability that a user chooses cluster j in a password by Pj = 5 ×
pj. Note that the probability for a cluster j increases slightly as other
clicks occur (due to the constraint of 5 distinct clusters in a password);
we ignore this in our present estimate of Pj. Our results in Figure 1
indicate a significant number of hot-spots for
our sample of the full population (32−40 users per image).
Previous “conservative” assumptions [47] were that half of the
available alphabet of T-regions would be used in practice – or 207 in our case.
If this were the case, and all T-regions in the alphabet were equi-probable, we
would expect to see
some clusters of size 2, but none of size 3 after 40 participants;
we observed significantly more on all 17 images.
Figure 1 shows that some images were clearly worse than others.
There were many clusters of size at least 5, and
some as large as 16 (see tea image).
If a cluster in our lab study received 5 or more clicks –
in which case we call it a popular or high-probability cluster –
then statistically, this allows determination of
a confidence interval, using Equation
(1) which provides the 100(1−α)% confidence interval for a
population proportion [9, page 288].
Here n is the total number of clicks (i.e., five times the number of users), p takes the role of pj, q=1−p, and zα/2 is from
a z-table. A confidence interval can be placed around pj (and thus Pj)
using (1) when np ≥ 5 and nq ≥ 5. For clusters of
size k ≥ 5, p=k/n, then np = k and nq = n−k. In our case, n
≥ 32 · 5 and n−k ≥ 5, as statistically required to use (1).Table 1 shows these confidence intervals for four images, predicting that
in future similar populations many of these points would be clicked by between
10-50% of users, and some points would be clicked by 20-60% of users with 95%
confidence (α = .05). For example, in Table 1(a), the first row
shows the highest frequency cluster (of size 13); as our sample for this image
was only 35 users, we observed 37.1% of our
participants choosing this cluster. Using (1), between 17.7% and
56.6% of users from future populations are expected to choose this same
cluster (with 95% confidence).
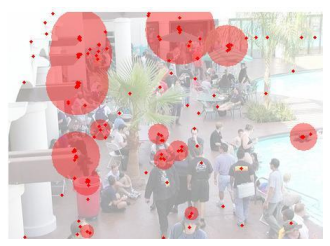 | | 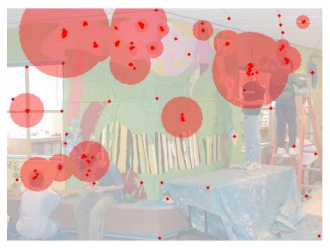 |
| (a) pool (originally from [46, 47]; see Appendix A). | | (b) mural (originally from [46]; see Appendix A). |
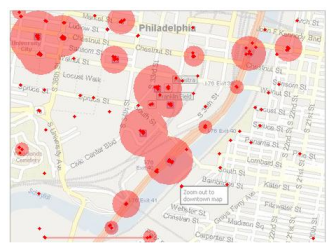 | | 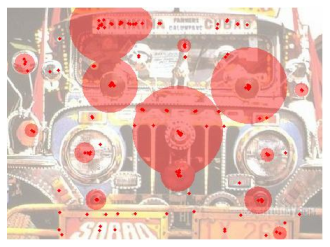 |
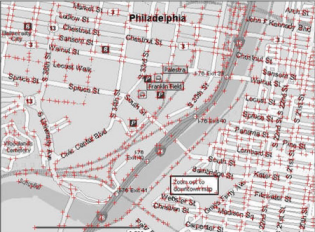
| (c) philadelphia (originally from [46]; see Figure 5). | | (d) truck (originally from [12]). |
| |
| Figure 2: Observed click-points. Halo diameters are 10 times the size of the underlying cluster, illustrating its popularity. |
| (a) pool image | (b)
mural image |
| Cluster | | | Cluster | | |
| size | Pj | 95% CI (Pj) | size | Pj | 95% CI (Pj) |
| 13 | 0.371 | (0.177; 0.566) | 14 | 0.400 | (0.199; 0.601) |
| 12 | 0.343 | (0.156; 0.530) | 13 | 0.371 | (0.177; 0.566) |
| 12 | 0.343 | (0.156; 0.530) | 10 | 0.286 | (0.114; 0.458) |
| 11 | 0.314 | (0.134; 0.494) | 8 | 0.229 | (0.074; 0.383) |
| 11 | 0.314 | (0.134; 0.494) | 7 | 0.200 | (0.055; 0.345) |
|
| (c) philadelphia image | (d) truck image |
| Cluster | | | Cluster | | |
| size | Pj | 95% CI (Pj) | size | Pj | 95% CI (Pj) |
| 10 | 0.286 | (0.114; 0.458) | 15 | 0.429 | (0.221;
0.636) |
| 10 | 0.286 | (0.114; 0.458) | 14 | 0.400 | (0.199;
0.601) |
| 9 | 0.257 | (0.094; 0.421) | 13 | 0.371 | (0.177;
0.566) |
| 9 | 0.257 | (0.094; 0.421) | 13 | 0.371 | (0.177;
0.566) |
| 7 | 0.200 | (0.055; 0.345) | 13 | 0.371 | (0.177;
0.566) |
| Table 1: 95% confidence intervals for the top 5 clusters found in each of four images. The confidence intervals are for the percentage of users expected to choose this cluster in future populations. |
Figure 1 and Table 1 show the popularity of the hottest
clusters; Figure 1's line also shows the number of
popular clusters. The clustering effect evident in Figures 1, 2, and Table 1 clearly establishes that hot-spots are very prominent on a wide
range of images.
We further pursue how these hot-spots impact the practical security of full 5-click passwords in Section 4.2.
As a partial summary, our results suggest that many images have significantly more hot-spots than would be expected if all T-regions were
equi-probable. The paperclips, cars,
faces, and tea images are not as susceptible to
hot-spotting as others (e.g., mural, truck, and
philadelphia).
For example, the cars
image had only 4 clusters of size at least 5, and only one with frequency at least 10.
The mural image
had 15 clusters of size at least 5, and 3 of the top 5 frequency
clusters had frequency at least 10. Given our sample size for the mural image
was only 36 users, these clusters are quite popular.
This demonstrates the range of effect the background image can have (for the images studied). Although previous work [46] suggests using intuition for choosing more
secure background images (no further detail was provided), our results
apparently show that intuition is not a good indicator.
Of the four images used in other click-based graphical passwords studies, three showed
a large degree of clustering (pool, mural, and
philadelphia). Furthermore, two other images that we “intuitively”
believed would be more secure background images were among the worst
(truck and citymap-nl). The truck image had
10 clusters of size at least 5, and the top 5 clusters had frequency at least 13.
Finding reliable automated predictors of more secure background images remains an open problem. Our preliminary work with simple measures (image segmentation, corner detection, and image contrast measurement) does not appear to offer reliable indicators.
Thus, we next explore the impact of hot-spotting across images to help choose two images for further analysis.
3.2 Measurement and Comparison of Hot-Spotting for Different Images
To compare the relative impact of hot-spotting on each image studied, we
calculated two formal measures of password security for each image: entropy
H(X), in equation (2), and in equation (3),
the expected number of guesses E(f(X))
to correctly guess a password assuming the attacker knows the probabilities wi >
0 for each password i.
The relationship between H(X)
and E(f(X)) for password guessing is discussed by Massey [26].
Of course in general, the wi are unknown, and our study gives
only very coarse estimates; nonetheless, we find it helpful to use this
to develop an estimate of which images will have the least impact from hot-spotting.
For (2) and
(3), n is the number of passwords (of probability > 0), random
variable X ranges over the passwords, and wi=Prob(X=xi) is calculated as described below.
|
E(f(X))= |
| i · wi , where wi ≥ wi+1, and
(3) |
f(X) is the number of guesses before success.
We calculate these measures based on our observed user data.
For this purpose, we assume that users will
choose from a set of click-points (following the associated probabilities),
and combine
5 of them randomly. This assumption almost certainly over-estimates both
E(f(X)) and H(X) relative to actual practice, as it does not consider
click-order patterns or dependencies. Thus,
popular clusters likely reduce security by more than we estimate here. We define
CV to be the set of all 5-permutations derivable from the clusters
observed in our user study (as computed in Section 3.1).
Using the probabilities pj of each cluster, the probabilities
wi of each password in CV are computed as follows.
Pick a combination of 5 observed clusters
j1, … , j5 with respective probabilities pj1, … , pj5.
For each permutation of these clusters, calculate the probability of that
permutation occurring as a password. Due to our instructions that no two
click-points in a password can fall in the same T-region, these probabilities
change as each point is clicked. Thus, for password i = (j1, j2, j3, j4,
j5), wi = pj1 · [pj2/(1−pj1)] · [pj3/((1−pj1) ·
(1−pj2))] · … ). The resulting set CV is a set of click-based graphical passwords
(with associated probabilities)
that coarsely approximates the effective password space if the clusters observed in our
user study are representative of those in larger similar populations. We can
order the elements of CV using the probabilities wi based on our
user study.
An ordered CV could be used as the basis of an
attack dictionary; this ordering could be much improved, for example, by
exploiting expected patterns in click-order. See Section 4.2 for more details.
For comparison to previous “conservative” estimates that simply half of the available
click-points (our T-regions) would be used in practice [47], we calculate CU.
We compare to CU as it is a baseline that approximates what we would expect to see after running 32 users (the lowest number of users we have for any image), if previous estimates were accurate, and T-regions were equi-probable. CU is the set of all permutations of clusters we expect to find after observing 32 users, assuming a uniformly random alphabet of size 207. Fig. 3 depicts the entropy and expected number
of guesses for CV. Notice the range between images, and the drop in E(f(X)) from CU to values of CV. Comparison to the marked CU values for (1) H(X) and (2) E(f(X)) indicates that previous rough estimates are a security overestimate for practical
security in all images, some much more so than others. This is at least
partially due to click-points not being equi-probable in practice (as illustrated
by hot-spots), and apparently
also due to the previously suggested effective alphabet size (half of the full alphabet)
being an overestimate. Indeed, a large alphabet is precisely the theoretical security advantage that these graphical passwords have over text passwords. If the effective alphabet size is not as large as previously expected, or is not well-distributed, then we should reduce our expectations of the security. These results appear to provide fair approximation of the entropy and expected number of guesses for the larger set of users in the field study; we performed these same calculations again using the field study data. For both of the two images, the entropy measures were within one bit of values measured here (less than a bit higher for pool, and about one bit lower for cars). The number of expected guesses increased for both images (by 1.3 bits for cars, and 2.5 bits for pool).
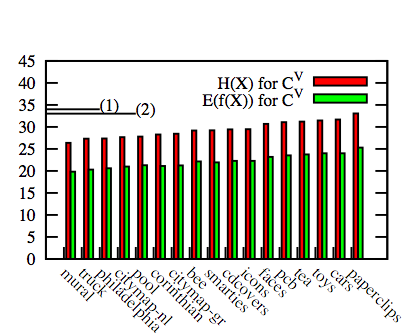
| Figure 3: Security measures for each image (in bits). CV is based
on data from lab user study of 32–40 passwords (depending on image). For comparison to a uniform distribution, (1) marks H(X) for CU, and (2) marks E(f(X)) for CU. |
The variation across all images
shows how much of an impact the background image can be, even when using images
that are “intuitively” good. For example, the image that showed the most impact from
hot-spotting was the mural image, chosen for an earlier PassPoints
usability study [46]. We note that
the paperclips image scores best in the charted security measures (its H(X) measure is within a standard deviation of CU);
however, 8 of 36 users who created a password on
this image could not perform the subsequent login (and skipped it – as noted
earlier), so the data for this image represents some passwords that are not repeatable,
and thus we suspect it would have lower relative security in practice.
Overall, one can conclude
that image choice can have a significant impact on the resulting security, and that developing reliable methods to filter out images
that are the most susceptible to hot-spotting would be an interesting avenue for future research.
We used these formal measures to make an informed decision on which images to use for our field study. Our goal was to give the PassPoints scheme the best chance (in terms of anticipated security) we could, by using one image (cars) that showed the least amount of clustering (with the best user success in creating a password), and also using another that ranked in the middle (pool).
4 Field Study and Harvesting Attacks
Here we describe a 7-week or longer (depending on the user), university-approved field study of 223 user accounts on two different background images. We collected click-based graphical password data to evaluate the security of this style of graphical passwords against various attacks. As discussed, we use the entropy and expected guesses measures from our lab study to choose two images that would apparently offer different levels of security (although both are highly detailed): pool and cars. The pool image had a medium amount of clustering (cf. Fig. 3), while the cars image had nearly the least amount of clustering. Both images had a low number of skips in the lab study, indicating that they did not cause problems for users with password creation. Experimental Details. We implemented a web-based version of PassPoints, used by three first-year undergraduate classes: two were first year courses for computer science students, while the third was a first year course for non-computer science students enrolled in a science degree. The students used the system for at least 7 weeks to gain access to their course notes, tutorials, and assignment solutions. For comparison with previous usability studies on the subject, and our lab study, we used an image size of 451 × 331 pixels. After the user entered their username and course, the screen displayed their background image and a small black square above the image to indicate their tolerance square size. For about half of users (for each image), a 19 × 19 T-region was used, and for the other half, a 13 × 13 T-region.1
The system enforced that each password had to be 5 clicks and that no click-point could be within t=9 pixels of another (vertically and horizontally). To complete initial password creation, a user had to successfully confirm their password once. After initial creation, users were permitted to reset their password at any time using a previously set secret question and answer. Users were permitted to login from any machine (home, school, or other), and were provided an online FAQ and help. The users were asked that they keep in mind that their click-points are a password, and that while they will need to pick points they can remember, not to pick points that someone else will be able to guess. Each class was also provided a brief overview of the system, explaining that their click-points in subsequent logins must be within the tolerance shown by a small square above the background image, and that the input order matters. We only use the final passwords created by each user that were demonstrated as successfully recalled at least one subsequent time (i.e., at least once after the initial create and confirm). We also only use data from 223 out of 378 accounts that we would consider, as this was the number that provided the required consent. These 223 user accounts map to 189 distinct users as 34 users in our study belonged to two classes; all but one of these users were assigned a different image for each account, and both accounts for a given user were set to have the same error tolerance. Of the 223 user accounts, 114 used pool and 109 used cars as a background image.
4.1 Field Study Hot Spots and Relation to Lab Study Results
Here we present the clustering results from the field study, and compare results to those on the same two images from the lab study.
Fig. 4b shows that the areas that were emerging as hot-spots from the lab study (recall Fig. 2a) were also popular in the field study, but other clusters also began to emerge. Fig. 4b shows that even our “best” image from the lab study (in terms of apparent resistance to clustering) also exhibits a clustering effect after gathering 109 passwords.
Table 2 provides a closer examination of the clustering effect observed.
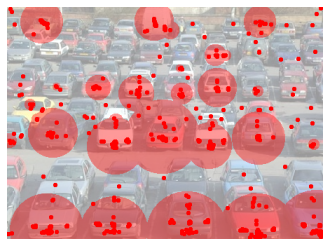 | | 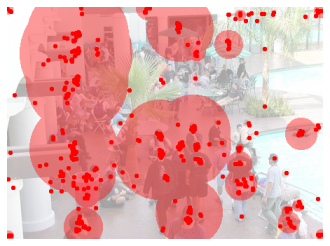 |
| (a) cars (originally from [5]). | | (b) pool (originally from [46, 47]). |
| Figure 4: Observed clustering (field study). Halo diameter is 5 × the number of underlying clicks. |
| Image | Size of most popular clusters | # clusters |
| Name | # 1 | # 2 | # 3 | # 4 | # 5 | of size |
| | | | | | | ≥ 5 |
| cars | 26 | 25 | 24 | 22 | 22 | 32 |
| pool | 35 | 30 | 30 | 27 | 27 | 28 |
| Table 2: Most popular clusters (field study). |
These values show that on pool, there were 5 points that 24-31% of users chose as part of their password. On cars, there were 5 points that 20-24% of users chose as part of their password. The clustering on the cars image indicates that even highly detailed images with many possible choices have hot spots. Indeed, we were surprised to see a set of points that were this popular, given the small amount of observed clustering on this image from our smaller lab study. The prediction intervals calculated from our lab study (recall Section 3) provide reasonable predictions of what we observed in the field study. For cars, the prediction intervals for 3 out of the 4 popular clusters were correct. For pool, the prediction intervals for 8 out of the 9 popular clusters were correct. The anomalous cluster on cars was still quite popular (chosen by 12% of users), but the lower end of the lab study's prediction interval for this cluster was 20%. The anomalous cluster on pool was also still quite popular (chosen by 18% of users), but the lower end of the lab study's prediction interval for this cluster was 19%.
These clustering results (and their close relationship to the lab study's results) indicate that the points chosen from the lab study should provide a reasonably close approximation of those chosen in the field.
This motivates our attacks based on the click-points harvested from the lab study.
4.2 Harvesting Attacks: Method & Results
We hypothesized that due to the clustering effect we observed in the lab study, human-seeded attacks based on data harvested from other users might prove a successful attack strategy against click-based graphical passwords. Here we describe our method of creating these attacks, and our
results are presented below. Table 3 provides the results of applying various attack dictionaries based on our harvested data, and their success rates when applied to our field study's password database.2 CuR is a dictionary composed of all 5-permutations of click-points collected from u users.
Note CuR bitsize is a slight overestimate, as there are some combinations of points that would not constitute a valid password, due to two or more points being within t=9 pixels of each other. If this were taken into account, our attacks would be slightly better. In our lab study, u=33 for cars, and u=35 for pool. Thus, the size of CuR for cars is P(165, 5) = 236.7 entries, and for pool is P(175, 5) = 237.1 entries.
CuV is a dictionary composed of all 5-permutations of the clusters calculated (using the method described in Section 3.1) from the click-points from u users. Thus, the alphabet size (and overall size) for CuV is smaller under the same number of users than in a corresponding CuR dictionary. Note that all of these dictionary sets can be computed on-the-fly from base data as necessary, and thus need not be stored.
| Set | cars (u=33) | pool (u=35) |
| | m | bitsize | # passwords | m | bitsize | # passwords |
| | | | guessed out of 109 | | | guessed out of 114 |
| | | | avg | min | max | | | avg | min | max |
| CuR | 165 | 36.7 | 37(34%) | † | † | 175 | 37.1 | 59(52%) | † | † |
| CuV | 104 | 33.4 | 22(20%) | † | † | 77 | 31.1 | 41(36%) | † | † |
| C25R | 125 | 34.7 | 24(22%) | 9(8%) | 35(32%) | 125 | 34.7 | 42(37%) | 29(25%) | 56(49%) |
| C25V | 85 | 31.9 | 21(19%) | 7(6%) | 27(25%) | 59 | 29.2 | 34(29%) | 19(17%) | 47(41%) |
| C20R | 100 | 33.1 | 22(20%) | 8(7%) | 32(29%) | 100 | 33.1 | 35(31%) | 24(21%) | 55(48%) |
| C20V | 72 | 30.6 | 17(16%) | 8(7%) | 30(28%) | 52 | 28.2 | 28(25%) | 18(16%) | 43(38%) |
| C15R | 75 | 30.9 | 14(13%) | 4(4%) | 25(23%) | 75 | 30.9 | 30(27%) | 20(18%) | 45(39%) |
| C15V | 56 | 28.8 | 12(11%) | 4(4%) | 24(22%) | 41 | 26.4 | 26(23%) | 14(12%) | 43(38%) |
| Table 3: Dictionary attacks using different sets. All subsets of users (after the first two rows) are the result of 10 randomly selected subsets of u short-term study user passwords. For rows 1 and 2, note that u=33 and 35. m is the alphabet size, which defines the dictionary bitsize. See text for descriptions of CV and CR. †The first two rows use all data from the short-term study to seed a single dictionary, and as such, there are no average, max, or min values to report. |
| Dictionary | cars | pool |
| | m | bitsize | # passwords | m | bitsize | # passwords |
| | | | guessed | | | guessed |
| C20, longtermR | 100 | 33.1 | 29/89 (33%) | 100 | 33.1 | 52/94 (55%) |
| C10, longtermR | 50 | 27.9 | 23/99 (23%) | 50 | 27.9 | 22/104 (21%) |
| Table 4: Dictionary attack results, using the first 20 and 10 users from the long term study to seed an attack against the others. m is the alphabet size. See text for descriptions of CV and CR. |
Table 3 illustrates the efficacy of seeding a dictionary with a small number of user's click-points. The most striking result shown is that initial password choices harvested from 15 users, in a setting where long term recall is not required, can be used to generate (on average) 27% of user passwords for pool (see C15R). As we expected, cars was not as easily attacked as pool; more user passwords are required to seed a dictionary that achieves similar success rates (see C25R). We also tried these attacks using a small set of field study user passwords to seed an attack against the remaining field study user passwords.
The result, in Table 4, shows a difference between the lab study and the field study (final) passwords; however, there remains sufficient similarity between the two groups to launch effective attacks using the lab-harvested data.
One possible reason for the differences in user choice between the two studies is that the field study users may not have been as motivated as the lab study users to create “difficult to guess” graphical passwords. It is unclear how a user might measure whether they are creating a graphical password that is difficult to guess, and whether in trying, if users would actually change their password's strength; one study [36] shows that only 40% of users actually change the complexity of their text passwords according to the security of the site. Another equally possible explanation might be that the lab study users chose more difficult passwords than they would have in practice, as they were aware there was no requirement for long term recall, and also did not have a chance to forget and subsequently
reset their passwords to something more memorable. With our current data, it is not clear whether we can conclusively determine a reason for these differences. Next we examined the effect of click-order patterns as one method to capture a user's association between points, and reduce our dictionary sizes. For each image, we select one dictionary to optimize with click-order patterns. This dictionary is one of the ten randomly selected CV subsets that were averaged (results of this average are in Table 3). We selected the dictionary whose guessing success was closest to the average reported in Table 3. The success rate that these dictionaries achieve (before applying click-order patterns) is provided in the first row of Table 5. We hypothesized that many users will choose passwords in one (or a combination) of six simple click-order patterns: right to left (RL), left to right (LR), top to bottom (TB), bottom to top (BT), clockwise (CW), and counter-clockwise (CCW). Diagonal (DIAG) is a combination of a consistent vertical and horizontal direction (e.g., both LR and TB).
Note that straight lines also fall into this category; for example, when (xi, yi) is a horizontal and vertical pixel coordinate, the rule for LR is (x1 ≤ x2 ≤ x3 ≤ x4 ≤ x5), so a vertical line of points would satisfy this constraint.We apply our base attack dictionaries (one for each image), under various sets of these click-order pattern constraints to determine their success rates and dictionary sizes. This method only initiates the exploration of other ways that click-based graphical passwords could be analyzed for patterns in user choice. We expect this general direction will yield other results, including patterns due to mnemonic strategies (e.g., clicking all red objects).
| | cars image |
pool image |
|
Click-order pattern | # passwords | dictionary | # passwords | dictionary |
| | guessed of 109 | size (bits) | guessed of 114 | size (bits) |
| C15V (with no pattern) | 13 (12%) | 29.2 | 22 (19%) | 27.1 |
| LR, RL, CW, CCW, TB, BT | 12 (11%) | 25.6 | 22 (19%) | 23.4 |
| LR, RL | 11 (10%) | 23.8 | 19 (17%) | 22.0 |
| TB,BT | 12 (11%) | 24.4 | 15 (13%) | 21.9 |
| CW, CCW | 0 (0%) | 24.0 | 4 (4%) | 21.7 |
| DIAG | 11 (10%) | 18.4 | 14 (12%) | 16.2 |
| Table 5: Effect of incorporating click-order patterns on dictionary size and success, as applied to a representative dictionary of clusters gathered from 15 users. Results indicate that the DIAG pattern produces the smallest dictionary, and still guesses a relatively large number of passwords. |
The results shown in Table 5 indicate that, on average for the pool image, using only the diagonal constraint will reduce the dictionary size to 16 bits, while still cracking 12% of passwords. Similarly, for the cars image, using only this constraint will reduce the dictionary to 18 bits, while still cracking 10% of passwords. The success rate of our human-seeded attack is comparable to recent results on cracking text-based passwords [23], where 6% of passwords were cracked with a 1.2 million entry dictionary (almost 2 bits larger than our DIAG dictionary based on harvested points of 15 users for cars, and 4
bits larger for DIAG based on 15 users for pool). Furthermore, unlike most text dictionaries, we do not need to store the entire dictionary as it is generated on-the-fly from the alphabet. At best, this
indicates that these graphical passwords are slightly less secure than the text-based passwords
they have been proposed to replace. However, the reality is likely worse. The analogy to
our attack is collecting text passwords from 15 users, and generating a dictionary based on all permutations of the characters harvested, and finding it generated a successful attack. The
reason most text password dictionaries succeed is due to known dependent patterns in language (e.g., using di or tri-grams in a Markov model [29]). The obvious analogy to this method has not been yet attempted, but would be another method of further reducing the dictionary size.
5 Purely Automated Attacks Using Image Processing Tools
Here we investigate the feasibility of creating an attack dictionary for click-based graphical
passwords by purely automated means. Pure automation would side-step the need for
human-seeding (in the form of harvesting points), and thus should be easier for an attacker to
launch than the attacks presented in Section 4.
We create this attack dictionary
by modelling user choice using a set of image processing
methods and tools. The idea is that these methods may help predict
hot-spots by automated means, leading to more efficient search orderings for
exhaustive attacks. This could be used for modeling attackers constructing attack dictionaries, and proactive password checking.
5.1 Identifying Candidate Click-Points
We begin by identifying details of the user task in creating a click-based
graphical password. The user must choose a set of points (in a specific order)
that can be remembered in the future. We do not focus on mnemonic strategies for these automated dictionaries (although they could likely be improved using the click-order patterns from Section 4.2), but rather the basic features of a point that define candidate
click-points. To this end, we identify a candidate click-point to be a
point which is:
(1) identifiable with precision within the system's error tolerance;
and
(2) distinguishable from its surroundings, i.e., easily picked out from
the background.
Regarding (1), as an example, the pool image has a red garbage can
that is larger than the 19 × 19 error tolerance; to choose the red
garbage can, a user must pick a specific part of it that can be navigated
to again (on a later occasion) with precision, such as the left handle.
Regarding (2), as an example, it is much easier to find a
white logo on a black hat than a brown logo on a green camouflage hat. For modelling purposes, we hypothesize that the fewer candidate click-points (as
defined above) that an image has, the easier it is to attack.
We estimate candidate click-points by implementing a
variation of Itti et al.'s bottom-up model of visual attention (VA) [17],
and combining it with Harris corner detection [16]. Corner detection picks out the areas of an image that have variations of
intensity in horizontal and vertical directions; thus we expect it should
provide a reasonable measure of whether a point is identifiable. Itti et al.'s
VA determines areas that stand out from
their surroundings, and thus we expect it should provide a reasonable measure of
a point's distinguishability. Briefly, VA calculates a saliency map of the
image based on 3 channels (color, intensity, and orientation) over multiple
scales. The saliency map is a grayscale image whose brighter areas (i.e., those
with higher intensity values) represent more conspicuous locations. A viewer's
focus of attention should theoretically move from the most conspicuous locations
(represented by the highest intensity areas on the saliency map) to the least.
We assume that users are more likely to
choose click-points from areas which draw their visual attention. We implemented a variation of VA and combined it with Harris corner detection to
obtain a prioritized list of candidate click-points (CCP-list) as follows.
(1) Calculate a VA saliency map (see Fig. 5(b)) using slightly
smaller scales than Itti et al. [17] (to reflect our interest in
smaller image details). The higher-intensity pixel values of the saliency map
reflect the most “conspicuous” (and distinguishable) areas.
(2) Calculate the corner locations using the Harris corner detection function
as implemented by Kovesi [22]3 (see Fig. 5(c)).
(3) Use the corner locations as a bitmask for the saliency map, producing what
we call a cornered saliency map (CSM).
(4) Compute an ordered CCP-list of the highest to lowest intensity-valued CSM
points. Similar to the focus-of-attention inhibitors used by Itti et al., we inhibit a CSM point (and its surrounding tolerance) once it
has been added to the CCP-list so it is not chosen again (see Fig.
5(d)). The CCP-list is at least as long
as the alphabet size (414), but is a prioritized list, ranking points from (the
hypothesized) most to least likely.
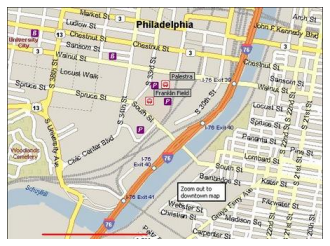 | | 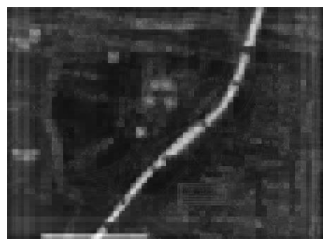 |
| (a) Original image [46]. | | (b) Saliency map. |
 | | 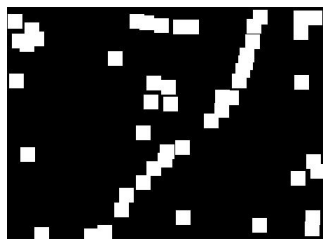 |
| (c) Corner detection output. | | (d) Cornered saliency map (CSM) after top 51 CCP-list |
| | | points have been inhibited. |
| |
| Figure 5: Illustration of our method of creating a CCP-list (best viewed electronically). |
5.2 Model Results
We evaluated the performance of the CCP-list as a model of user choice using
the data from both the lab and field user studies. We first
examined how well the first half (top 207) of the CCP-list overlaps with the observed
high-probability clusters from our lab user study (i.e., those clusters of size at
least 5). We found that this half-alphabet found all high-probability clusters
on the icons,
faces, and cars images, and most of the high-probability
clusters on 11 of the 17 images.
Most of the images that our model performed poorly on appeared to be due to the
saliency map algorithm being overloaded with too much detail (pcb,
citymap-gr, paperclips, smarties, and
truck images). The other image on which this approach did not
perform well (mural) appears to be due to the corner masking in step
(3); the high probability points were centroids of circles.
To evaluate how well the CCP-list works at modelling users' entire
passwords (rather than just a subset of click-points within a password), we used
the top ranked one-third of the CCP-list values (i.e., the top 138 points for
each image) to build a graphical dictionary and carry out a dictionary attack
against the observed passwords from both user studies (i.e., on all 17 images
in the lab study, and the cars and pool
images again in the field study). We found that for some
images, this 35-bit dictionary was able to guess a large number of user
passwords (30% for the icons image and 29% for the
philadelphia map image). For both short and long-term studies,
our tool guessed 9.1% of passwords for the cars image.
A 28-bit computer-generated dictionary (built from the top 51 ranked CCP-list
alphabet) correctly guessed 8 passwords (22%) from the icons image
and 6 passwords (17%) from the philadelphia image.
Results of this automated graphical dictionary attack are summarized in Table
6.
| Image | passwords | passwords |
| | guessed | guessed |
| | (lab study) | (field study) |
| 1. paperclips | 2/36 (5.5%) | – |
| 2. cdcovers | 2/35 (5.7%) | – |
| 3. philadelphia | 10/35 (28.6%) | – |
| 4. toys | 2/39 (5.1%) | – |
| 5. bee | 1/40 (2.5%) | – |
| 6. faces | 0/32 (0.0%) | – |
| 7. citymap-nl | 1/34 (2.9%) | – |
| 8. icons | 11/37 (29.7%) | – |
| 9. smarties | 5/37 (13.5%) | – |
| 10. cars | 3/33 (9.1%) | 10/109 (9.1%) |
| 11. pcb | 3/36 (8.3%) | – |
| 12. citymap-gr | 0/34 (0.0%) | – |
| 13. pool | 1/35 (2.9%) | 2/114 (0.9%) |
| 14. mural | 1/36 (2.8%) | – |
| 15. corinthian | 3/35 (8.6%) | – |
| 16. truck | 1/35 (2.9%) | – |
| 17. tea | 2/38 (5.3%) | – |
| Table 6: Passwords correctly guessed (using a 35-bit
dictionary based on a CCP-list).
The number of target passwords is different for most images (32 to 40 for the lab study). |
Figure 6 shows that the CCP-list does a good job of modelling observed user choices for some images, but not all images. This implies that on some images, an attacker performing an automated attack is likely to be able to significantly cut down his search space. This method also seems to perform well on the images for which the visual attention model made more definite decisions – the saliency map shows a smaller number of areas standing out, as indicated visually by a generally darker saliency map with a few high-intensity (white) areas. An attacker interested in any one of a set of accounts could go after accounts using a background image that the visual attention model performed well on. In essence, this method achieves a reduction (by leaving out some “unlikely” points) from a 43-bit full password space to a 35-bit dictionary. The 43-bit full password space is the proper base for comparison here, since an actual attacker with no a priori knowledge must consider all T-regions in an image. However, we believe this model of candidate click-points could be improved through a few methods. The images that the model performed poorly on appeared to be due to failure in creating a useful visual attention model saliency map. The saliency maps seem to fail when there are no areas that stand out from their surroundings in the channels used in saliency map construction (color, intensity, and orientation). Further, centroids of objects that “stand out” to a user will not be included in this model (as only corners are included); adding object centroids to the bitmask is thus an avenue for improvement.
6 Related Work
In the absence of password rules, practical text password security is understood
to be weak due to common patterns in user choice. In a dated but still often
cited study, Klein [21] determined a dictionary of 3 million words
(less than 1 billionth of the entire 8-character password space) correctly
guessed over 25% of passwords. Automated password cracking tools and
dictionaries that exploit common patterns in user choice include
Crack [28] and John the Ripper [30].
More recently, Kuo et al. [23] found John the Ripper's English
dictionary of 1.2 million words correctly guessed 6% of user passwords,
and an additional 5% by also including simple permutations.
In response to this well-known threat, methods to create less predictable passwords have emerged. Yan
[48] explores the use of passphrases to avoid password dictionary
attacks. Jeyaraman et al. [20] suggest basing a passphrase upon an
automated newspaper headline. In theory, creating passwords using these
techniques should leave passwords less vulnerable to automated password cracking
dictionaries and tools, although Kuo et al. [23] show this may
not be the case. Proactive password checking techniques (e.g.,
[38, 7, 2]) are commonly used to help prevent users from
choosing weak passwords. Many variations of graphical passwords are discussed in surveys by Suo et al.
[39] and Monrose et al. [27]. We discuss two general categories
of graphical passwords: recognition-based and recall-based. In the interest
of brevity, we focus on the areas closest to our work: click-based graphical
passwords, and practical security analyses of user authentication methods. Typical recognition-based graphical passwords require the user to recognize a
set (or subset) of K previously memorized images. For example, the user is
presented a set of N (> K) images from which they must distinguish a subset
of their K images. The user may be presented many panels of images before
providing enough information to login. Examples are Déjà Vu [10],
which uses random art images created by hash visualization [32];
Passfaces [35], whereby the set of images are all human faces;
and Story [8], whereby the images are from various photo
categories (e.g., everyday objects, locations, food, and people), with users
encouraged to create a story as a mnemonic strategy. In the cognitive
authentication scheme of Weinshall [44], a user computes a path through a
grid of images based on the locations of those from K. The end of the path
provides a number for the user to type, which was thought to protect the values
of K from observers; Golle et al. [14] show otherwise. Recall-based schemes can be further described as cued or uncued.
An uncued scheme does not provide the user any information from which to
create their graphical password;
e.g., DAS (Draw-A-Secret) [19] asks users to draw
a password on a background grid.
Cued schemes show the user something that they can base their graphical password upon.
A click-based password using a single background image
is an example of a cued graphical password scheme where
the user password is a sequence of clicks on a background image.
Blonder [4] originally proposed the idea of a graphical password with a
click-based scheme where the password is one or more clicks on predefined image regions.
In the Picture Password variation by Jansen et al. [18], the entire image is
overlayed by a visible grid; the user must click on the same grid squares on each login.
Birget et al. [3] allow clicking anywhere on an image
with no visible grid, tolerating error through “robust discretization”.
Wiedenbeck et al. [45, 46, 47] implement this method as PassPoints,
and study its usability including:
memorability, general perception,
error rates, the effect of allowed error tolerance,
the effect of image choice on usability, and
login and creation times. They report
the usability of PassPoints to be comparable to text passwords in most respects; the notable
exception is a longer time for successful login.
The implementation we study herein is also reported to have acceptable success rates, accuracy, and entry times [6].
Regarding explorations of the effect of user choice, Davis et al. [8]
examine this in a variation of Passfaces and Story (see above), two
recognition-based schemes which essentially involve choosing an image from one
or more panels of many different images. Their user study found very strong
patterns in user choice, e.g., the tendency to select images of attractive
people, and those of the same racial background. The high-level idea of
finding and exploiting patterns in user choice also motivated our current
work, although these earlier results do not appear directly extendable to
(cued recall) click-based schemes that select unrestricted areas from a single
background image. Thorpe et al. [41, 42] discussed likely patterns in
user choice for DAS (mirror symmetry and small stroke count), later
corroborated through Tao's user study [40]. These results also do not
appear to directly extend to our present work, aside from the common general
idea of attack dictionaries. Lopresti et al. [24] introduce the concept of generative attacks to behavioral biometrics. Ballard et al. [1] generate and successfully apply a generative handwriting-recognition attack based on population statistics of handwriting, collected from a random sample of 15 users with the same writing style. In arguably the most realistic study to date of the threats faced by behavioral biometrics, they found their generative attacks to be more effective than attacks by skilled and motivated forgers [1].
Our most successful attack from Section 4.2 may also be viewed as generative in nature; it uses click-points harvested from a small population of users from another context (the lab study), performs some additional processing (clustering), and recombines subsets of them as guesses. Our work differs in its application (click-based graphical passwords), and in the required processing to generate a login attempt.
7 Discussion and Concluding Remarks
Our results demonstrate that harvesting data from a small number of human users
allows quite effective offline guessing attacks against click-based graphical passwords.
This makes individual users vulnerable to targeted (spear) attacks,
as one should assume that an attacker could find out the background image associated with
a target victim, and easily gather a small set of human-generated data for that image by any
number of means. For instance, an attacker could collect points by protecting
an attractive web service or contest site with a graphical password. Alternatively, an attacker could pay a small group of people or use friends.
This at least partially defeats the hope to improve one's security
in a click-based scheme through a customized image. We found that our human-seeded attack strategy was quite successful, guessing 36% of passwords with a 31-bit dictionary in one instance, and 20% of passwords with a 33-bit dictionary in another. Preliminary work shows that click-order patterns can be used to further reduce the size of these dictionaries, while maintaining similar success rates.
The success of our human-seeded attack dictionaries appears to be
related to the amount of hot-spotting on an image. The prevalence and impact of hot-spots
contrasts earlier views which underplayed their potential impact,
and suggestions [47] that any highly detailed image may be a good candidate.
Our studies allow us to update previous
assumptions that half of all click-regions on an image
will be chosen by users. After
collecting 570 and 545 points, we only observed 111 and 133 click-regions (for pool and cars respectively); thus, one quarter to one third of all click-regions would be a more reasonable estimate even from highly detailed images, and the relative probabilities of these regions should be expected to vary quite considerably. Our purely automated attack using a combination of image processing measures (which likely can be considerably improved) already gives cause for concern.
For images on which Itti et al.'s [17] visual attention
model worked well, our model appeared to do a reasonable job of predicting
user choice. For example, an automatically-generated 28-bit dictionary
from our tools guessed 8 out of 37
(22%) observed passwords for the icons image, and 6 out of 35
(17%) for the philadelphia image. Our tools guessed 9.1% of passwords
for the cars image in both the short-term lab and long-term field studies.
Improvements to pursue include adding object centroids to the bitmask
used in creating the cornered saliency map. Our attack strategies (naturally) could be used defensively,
as part of proactive password checking [38, 7, 2].
Thus, an interesting avenue for future work would be to determine whether graphical password users
create other predictable patterns when their choices are disallowed by proactive checking.
Additionally, the visual attention model may be used proactively to determine background images
to avoid, as those images on which the visual attention model performed well
(e.g., identifies some areas as much more interesting than others) appear
more vulnerable to the purely automated attacks from Section 5.
An interesting remaining
question is whether altering parameters (e.g., pixel sizes of images,
tolerance settings, number of click-points) in an attempt to improve security
can result in a system with acceptable security and usability
simultaneously. Any proposal with significantly varied
parameters would require new user studies exploring hot-spotting and
usability. Overall, the degree of hot-spotting confirmed by our studies, and
the successes of the various attack strategies herein, call into
question the viability of click-based schemes like PassPoints in environments
where off-line attacks are possible. Indeed in such environments, a 43-bit
full password space is clearly insufficient to start with,
so one would assume some tolerable level of password stretching
(e.g., [15, 34]) would be implemented to increase the difficulty of attack.
Regardless of these implementation details, click-based graphical password schemes may still be a suitable alternative for systems where offline attacks are not possible, e.g., systems currently using PIN numbers.
Acknowledgments
We thank Sonia Chiasson and Robert Biddle for their cooperative effort with us in running the user studies.
We are grateful to Prosenjit Bose, Louis D. Nel, Weixuan Li, and their Fall 2006 classes for participating in our field study.
We also thank Anthony Whitehead for recommending
relevant work on visual attention and image segmentation.
The first author acknowledges NSERC for funding a Canada Graduate Scholarship.
The second author acknowledges NSERC for funding a NSERC Discovery Grant and his
Canada Research Chair in Network and Software Security.
We thank Fabian Monrose, and the anonymous reviewers
for their insightful suggestions for improving this paper.
References-
[1]
-
L. Ballard, F. Monrose, and D. Lopresti.
Biometric Authentication Revisited: Understanding the Impact of
Wolves in Sheep's Clothing.
In 15th Annual USENIX Security Symposium, pages 29–41, 2006.
- [2]
-
F. Bergadano, B. Crispo, and G. Ruffo.
High Dictionary Compression for Proactive Password Checking.
ACM Trans. Inf. Syst. Secur., 1(1):3–25, 1998.
- [3]
-
J.C. Birget, D. Hong, and N. Memon.
Robust Discretization, with an Application to Graphical Passwords.
IEEE Transactions on Information Forensics and Security,
1:395–399, 2006.
- [4]
-
G. Blonder.
Graphical Passwords.
United States Patent 5,559,961, 1996.
- [5]
-
Ian Britton.
https://www.freefoto.com, accessed Feb. 2, 2007.
- [6]
-
S. Chiasson, R. Biddle, and P.C. van Oorschot.
A Second Look at the Usability of Click-based Graphical Passwords.
In Symposium on Usable Privacy and Security (SOUPS), 2007.
- [7]
-
C. Davies and R. Ganesan.
BApasswd: A New Proactive Password Checker.
In 16th National Computer Security Conference, pages 1–15,
1993.
- [8]
-
D. Davis, F. Monrose, and M.K. Reiter.
On User Choice in Graphical Password Schemes.
In 13th USENIX Security Symposium, 2004.
- [9]
-
J.L. Devore.
Probability and Statistics for Engineering and the Sciences.
Brooks/Cole Publishing, Pacific Grove, CA, USA, 4th edition, 1995.
- [10]
-
R. Dhamija and A. Perrig.
Déjà Vu: A User Study Using Images for Authentication.
In 9th USENIX Security Symposium, 2000.
- [11]
-
P.F. Felzenszwalb and D.P. Huttenlocher.
Efficient Graph-Based Image Segmentation.
Int. J. Computer Vision, 59(2), 2004.
Code available from:
https://people.cs.uchicago.edu/~pff/segment/.
- [12]
-
FreeImages.com.
https://www.freeimages.com, accessed Feb. 2, 2007.
- [13]
-
Freeimages.co.uk.
https://www.freeimages.co.uk, accessed Feb. 2, 2007.
- [14]
-
P. Golle and D. Wagner.
Cryptanalysis of a Cognitive Authentication Scheme.
Cryptology ePrint Archive, Report 2006/258, 2006.
https://eprint.iacr.org/.
- [15]
-
J. A. Halderman, B. Waters, and E. W. Felten.
A Convenient Method for Securely Managing Passwords.
In Proceedings of the 14th International World Wide Web
Conference, pages 471–479. ACM Press, 2005.
- [16]
-
C.G. Harris and M.J. Stephens.
A Combined Corner and Edge Detector.
In Proceedings Fourth Alvey Vision Conference, pages 147–151,
1988.
- [17]
-
L. Itti, C. Koch, and E. Niebur.
A Model of Saliency-Based Visual Attention for Rapid Scene
Analysis.
IEEE Trans. on Pattern Analysis and Machine Intelligence,
20(11):1254–1259, 1998.
- [18]
-
W. Jansen, S. Gavrilla, V. Korolev, R. Ayers, and Swanstrom R.
Picture Password: A Visual Login Technique for Mobile Devices.
NIST Report: NISTIR 7030, 2003.
- [19]
-
I. Jermyn, A. Mayer, F. Monrose, M. Reiter, and A. Rubin.
The Design and Analysis of Graphical Passwords.
In 8th USENIX Security Symposium, 1999.
- [20]
-
S. Jeyaraman and U. Topkara.
Have the Cake and Eat it too - Infusing Usability into Text-Password
Based Authentication Systems.
In 21st ACSAC, pages 473–482, 2005.
- [21]
-
D. Klein.
Foiling the Cracker: A Survey of, and Improvements to, Password
Security.
In The 2nd USENIX Security Workshop, pages 5–14, 1990.
- [22]
-
P. D. Kovesi.
MATLAB and Octave Functions for Computer Vision and Image
Processing.
Univ. Western Australia.
Available from:
https://www.csse.uwa.edu.au/~pk/research/matlabfns/.
- [23]
-
C. Kuo, S. Romanosky, and L.F. Cranor.
Human Selection of Mnemonic Phrase-based Passwords.
In 2nd Symp. Usable Privacy and Security (SOUPS), pages
67–78, New York, NY, 2006. ACM Press.
- [24]
-
Daniel P. Lopresti and Jarret D. Raim.
The Effectiveness of Generative Attacks on an Online Handwriting
Biometric.
In AVBPA, pages 1090–1099, 2005.
- [25]
-
S. Madigan.
Picture Memory.
In John C. Yuille, editor, Imagery, Memory and Cognition, pages
65–89. Lawrence Erlbaum Associates, N.J., U.S.A., 1983.
- [26]
-
J.L. Massey.
Guessing and Entropy.
In ISIT: Proceedings IEEE International Symposium on
Information Theory, page 204, 1994.
- [27]
-
F. Monrose and M. K. Reiter.
Graphical Passwords.
In L. Cranor and S. Garfinkel, editors, Security and
Usability, ch. 9, pages 147–164. O'Reilly, 2005.
- [28]
-
A. Muffett.
Crack password cracker, 2006.
https://www.crypticide.com/users/alecm/security/c50-faq.html,
accessed Nov. 9, 2006.
- [29]
-
Arvind Narayanan and Vitaly Shmatikov.
Fast Dictionary Attacks on Passwords Using Time-space Tradeoff.
In CCS '05: Proceedings of the 12th ACM Conference on Computer
and Communications Security, pages 364–372, 2005.
- [30]
-
Openwall Project.
John the Ripper password cracker, 2006.
https://www.openwall.com/john/, accessed Nov. 9, 2006.
- [31]
-
Passlogix.
https://www.passlogix.com, accessed Feb. 2, 2007.
- [32]
-
A. Perrig and D. Song.
Hash Visualization: A New Technique to Improve Real-World Security.
In International Workshop on Cryptographic Techniques and
E-Commerce, pages 131–138, 1999.
- [33]
-
M. Peters, B. Laeng, K. Latham, M. Jackson, R. Zaiyouna, and C. Richardson.
A Redrawn Vandenberg and Kuse Mental Rotations Test: Different
Versions and Factors That Affect Performance.
Brain and Cognition, 28:39–58, 1995.
- [34]
-
N. Provos and D. Mazieres.
A Future-Adaptable Password Scheme.
In Proceedings of the USENIX Annual Technical Conference,
1999.
- [35]
-
Real User Corporation.
About Passfaces, 2006.
https://www.realuser.com/about/about passfaces.htm, accessed
Nov. 9, 2006.
- [36]
-
Shannon Riley.
What Users Know and What They Actually Do.
Usability News, 8(1), February 2006.
https://psychology.wichita.edu/surl/usabilitynews/81/Passwords.htm,
accessed March 10, 2007.
- [37]
-
SFR IT-Engineering.
The Grafical Login Solution For your Pocket PC - visKey.
https://www.sfr-software.de/cms/EN/pocketpc/viskey/index.html,
accessed March 18, 2007.
- [38]
-
E.H. Spafford.
OPUS: Preventing Weak Password Choices.
Comput. Secur., 11(3):273–278, 1992.
- [39]
-
X. Suo, Y. Zhu, and G.S. Owen.
Graphical Passwords: A Survey.
In 21st Annual Computer Security Applications Conference
(ACSAC), 2005.
- [40]
-
H. Tao.
Pass-Go, a New Graphical Password Scheme.
Master's thesis, University of Ottawa, 2006.
- [41]
-
J. Thorpe and P.C. van Oorschot.
Graphical Dictionaries and the Memorable Space of Graphical
Passwords.
In 13th USENIX Security Symposium, 2004.
- [42]
-
J. Thorpe and P.C. van Oorschot.
Towards Secure Design Choices for Implementing Graphical Passwords.
In 20th Annual Computer Security Applications Conference (ACSAC
2004). IEEE, 2004.
- [43]
-
J. Thorpe and P.C. van Oorschot.
Human-Seeded Attacks and Exploiting Hot-Spots in Graphical
Passwords.
Technical Report TR-05-07, School of Computer Science, Carleton
University, Feb. 20, 2007.
- [44]
-
D. Weinshall.
Cognitive Authentication Schemes Safe Against Spyware (short
paper).
In IEEE Symp. on Security and Privacy, pages 295–300, 2006.
- [45]
-
S. Wiedenbeck, J. Waters, J.C. Birget, A. Brodskiy, and N. Memon.
Authentication using graphical passwords: Basic results.
In Human-Computer Interaction International (HCII 2005), 2005.
- [46]
-
S. Wiedenbeck, J. Waters, J.C. Birget, A. Brodskiy, and N. Memon.
Authentication Using Graphical Passwords: Effects of Tolerance and
Image Choice.
In Symp. Usable Priv. & Security (SOUPS), 2005.
- [47]
-
S. Wiedenbeck, J. Waters, J.C. Birget, A. Brodskiy, and N. Memon.
PassPoints: Design and Longitudinal Evaluation of a Graphical
Password System.
International J. of Human-Computer Studies (Special Issue on HCI
Research in Privacy and Security), 63:102–127, 2005.
- [48]
-
J. Yan, A. Blackwell, R. Anderson, and A. Grant.
Password Memorability and Security: Empirical Results.
IEEE Security and Privacy, 2(5):25–31, 2004.
Appendix A - Subset of Images Used
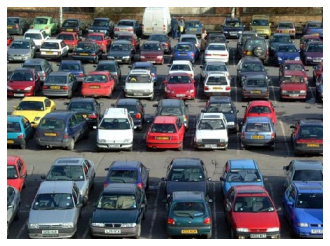 |
| (a) cars [5]. |
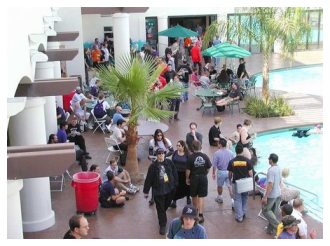 |
| (b) pool [46, 47]. |
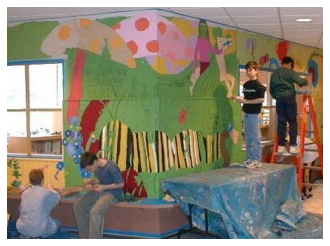 |
| (c) mural [46]. |
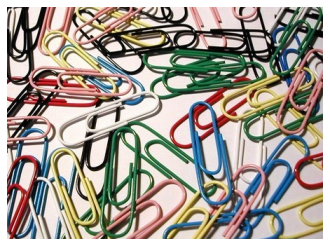 |
| (d) paperclips [13]. |
This document was translated from LATEX by
HEVEA.
|