To understand wildfire worm propagation, we simulate the outbreak of a worm in nine well-known US cities and Singapore. For this we relied on publicly available maps of Access Point locations from the Wigle.net [10] "wardriving" database, as well as empirically derived data for the city of Singapore. From these maps, we only consider open APs where the worm can spread without having to crack the encryption or the password.
Available war-driving maps chart APs but not connected hosts, so we had to populate them by randomly distributing hosts around APs. Based on our war-driving measurements and assuming a pervasive vulnerability, we distribute an average of 0.5 hosts per AP with Poisson distribution at an exponentially distributed distance of 10 m on average. We model effective AP range as omnidirectional with a radius of 90 m.
Finally, we do not consider the possibility of bypassing the AP to directly infect hosts within range using low level techniques because these depend on the available device driver and may not be widely available. We also ignore host mobility except that we assume the epidemic starts from 50 random locations to avoid artificially confining the worm to a sparse disconnected portion of the city.
The infection time for one hop is determined by four factors: scanning time, association time, IP acquisition time and transmission time. Based on our wildfire worm prototype, we assume a scanning and association time of about 1.5 seconds. We do not model DHCP interaction in our simulations as the worm can simply hijack an IP address. With an effective throughput of 14 mbps and 8 mbps for typical 802.11g and 802.11b networks respectively, the transmission speed is between 1 Mbytes and 1.7 Mbytes per second. Since the bandwidth will be shared among hosts, each host gets a transmission speed of a few hundreds kbytes/seconds. We assume a transmission speed of 100 kbytes/sec per host. For a worm size of 100K - which should be sufficient - the transmission time is about 1 second. A simulated worm-infected node infects its neighbours sequentially using these parameters.
Each simulation consists of 20 runs; for each run we start the infection from 50 different randomly selected hosts. We collect the mean values across runs of infection prevalence over time.
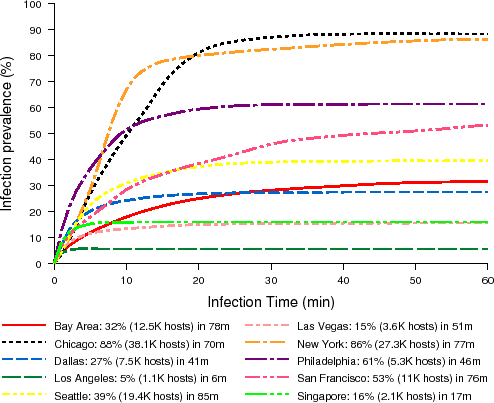
Figure 3 is a plot of infection prevalence over time for a "push" worm. Dense cities are infected very fast: 80% of New York and Chicago in less than 20 minutes. San Francisco and Philadelphia are infected fast as well: about 50% of San Francisco and Philadelphia are infected in 45 and 11 minutes respectively. A wild-fire worm does not spread significantly in Los Angeles and Las Vegas, but on a longer time scale a worm could still spread with the help of user mobility. The worm can spread fast as long as there are enough APs to maintain connectivity, but high density may even bog down the worm in some cases. In absolute numbers, we see that an attacker could quickly gain access to ten's of thousands of hosts in most cities. The attacker could start simultaneous, independent epidemics in many cities using the Internet to infect a few seed hosts.
As for pull worms, we briefly summarize the simulation results here without a figure. Their simulated spread is limited compared to push worms - prevalence of pull attacks is limited to 60% in 3 hours for New York and Chicago, but they are potentially more dangerous, as they can take advantage of more vulnerabilities. They are slower because the infection time must include waiting for the victim to offer an opportunity for infection in the form of a DNS requests or TCP connection. On the other hand, the worm can wait in parallel for any victim to become active. We use a very rough estimate of 10 minutes for waiting time to get an idea of the time scales involved, acknowledging that some machines may have no browsing activity at the time. The pull worm also requires higher density since we assume a shorter range of 60 m. Weaker antennas and increased interference typically weaken client transmission characteristics when compared with APs.
Overall, these time-scales suggest that automated defenses are crucial for defending against wildfire worms.