
This section presents quantitative experiments that demonstrate the effectiveness of memory sampling and idle memory taxation. Memory sampling is used to estimate the fraction of memory actively used by each VM. These estimates are then incorporated into the idle memory tax computations performed by the share-based memory allocation algorithm.
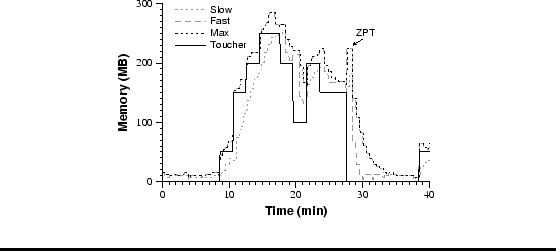 |
| Figure 6: Active Memory Sampling. A Windows VM executes a simple memory toucher application. The solid black line indicates the amount of memory repeatedly touched, which is varied over time. The dotted black line is the sampling-based statistical estimate of overall VM memory usage, including background Windows activities. The estimate is computed as the max of fast (gray dashed line) and slow (gray dotted line) moving averages. The spike labelled ZPT is due to the Windows ``zero page thread.'' |
Figure 6 presents the results of an experiment designed to illustrate the memory sampling technique. For this experiment, ESX Server was running on a dual-processor Dell Precision 420, configured to execute one VM running Windows 2000 Advanced Server on a single 800 MHz Pentium III CPU.
A user-level toucher application allocates and repeatedly accesses a controlled amount of memory that is varied between 50 MB and 250 MB. An additional 10-20 MB is accessed by standard Windows background activities. As expected, the statistical estimate of active memory usage responds quickly as more memory is touched, tracking the fast moving average, and more slowly as less memory is touched, tracking the slow moving average.
We were originally surprised by the unexpected spike immediately after the toucher application terminates, an effect that does not occur when the same experiment is run under Linux. This is caused by the Windows ``zero page thread'' that runs only when no other threads are runnable, clearing the contents of pages it moves from the free page list to the zeroed page list [22].
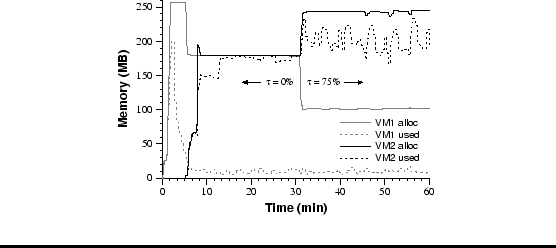 |
| Figure 7: Idle Memory Tax. Two VMs with identical share allocations are each configured with 256 MB in an overcommitted system. VM1 (gray) runs Windows, and remains idle after booting. VM2 (black) executes a memory-intensive Linux workload. For each VM, ESX Server allocations are plotted as solid lines, and estimated memory usage is indicated by dotted lines. With an initial tax rate of 0%, the VMs each converge on the same 179 MB allocation. When the tax rate is increased to 75%, idle memory is reclaimed from VM1 and reallocated to VM2, boosting its performance by over 30%. |
Figure 7 presents experimental results that demonstrate the effectiveness of imposing a tax on idle memory. For this experiment, ESX Server was running on a Dell Precision 420 multiprocessor with two 800 MHz Pentium III CPUs and 512 MB RAM, of which approximately 360 MB was available for executing VMs.6
Two VMs with identical share allocations are each configured with
256 MB ``physical'' memory. The first VM that powers on runs Windows
2000 Advanced Server, and remains idle after booting. A few minutes
later, a second VM is started, running a memory-intensive
dbench workload [28] under Red Hat Linux
7.2. The initial tax rate is set to ![]() , resulting in a pure
share-based allocation. Despite the large difference in actual memory
usage, each VM receives the same 179 MB allocation from ESX Server. In the
middle of the experiment, the tax rate is increased to
, resulting in a pure
share-based allocation. Despite the large difference in actual memory
usage, each VM receives the same 179 MB allocation from ESX Server. In the
middle of the experiment, the tax rate is increased to ![]() ,
causing memory to be reclaimed from the idle Windows VM and
reallocated to the active Linux VM running dbench. The
dbench workload benefits significantly from the
additional memory, increasing throughput by over 30% after the tax
rate change.
,
causing memory to be reclaimed from the idle Windows VM and
reallocated to the active Linux VM running dbench. The
dbench workload benefits significantly from the
additional memory, increasing throughput by over 30% after the tax
rate change.