4th USENIX Symposium on Networked Systems Design & Implementation
Pp. 299–311 of the Proceedings
Network Coordinates in the Wild
Jonathan Ledlie, Paul Gardner, and Margo Seltzer
Harvard School of Engineering and Applied Sciences and Aelitis
Network coordinates provide a mechanism for selecting and placing servers
efficiently in a large distributed system.
This approach works well as long as the coordinates continue to
accurately reflect network topology.
We conducted a long-term study of a subset of a million-plus node coordinate
system and found that it exhibited some of the problems for which
network coordinates are frequently criticized, for example,
inaccuracy and fragility in the presence of violations of the
triangle inequality.
Fortunately, we show that several simple techniques remedy many
of these problems.
Using the Azureus BitTorrent network as our testbed, we show
that live, large-scale network coordinate systems behave
differently than their tame PlanetLab and simulation-based
counterparts.
We find higher relative errors, more triangle inequality
violations, and higher churn.
We present and evaluate a number of techniques that, when applied
to Azureus, efficiently produce accurate and stable network
coordinates.
1 Introduction
The performance of many Internet applications, such as distributed
hash tables, web caches, and overlay networks, relies on accurate
latency estimation between participants (e.g., [30,11,15]).
Researchers propose acquiring these measurements using
various techniques, from
proxy measurement [29,14] to landmark
binning [26] to decentralized
network embeddings (e.g., [24,12,22,27,31]).
In a network embedding, a subset of inter-node latency measurements is
embedded into a low-dimensional metric space. Each node maintains a
network coordinate, such that the metric distance between two
coordinates in the abstract space predicts real-world latencies.
This paper examines the
performance of Internet-scale network embeddings through the study of
a subset of a million-node live coordinate system.
Although network coordinates have attractive properties for latency
prediction on the Internet, they have been criticized for
requiring expensive maintenance and having prediction accuracy
significantly worse than direct measurement methods such as
Meridian [32].
At the very least, critics say that
network coordinates are an unproven idea and unlikely to work in
practice because Internet routing policies cause too many triangle
inequality violations [34]. Supporters respond with claims that accuracies are
reasonable (8-15 percent), and they have demonstrated that coordinate
maintenance can be built on top of existing application communication.
They support these claims with simulations and small-scale live
deployments on
PlanetLab [9,27,18,23].
This paper provides the missing piece of the debate: data and analysis
of a truly large-scale and long-running network coordinate system.
The Azureus file-sharing network [1], which runs a
million-node network coordinate system, is the main artifact for our
analysis and experimentation.
This work is the result of a collaboration between the Azureus team
(Gardner) and a team from Harvard (Ledlie, Seltzer). Gardner
contacted the Harvard team because Azureus was exhibiting some of
the difficulties that Ledlie et al. had addressed in earlier work
with a PlanetLab-based coordinate system [18].
We merged the techniques from Ledlie's
previous work into the test branch of the Azureus code, used by
approximately ten thousand clients.
While our previous techniques did work ``in the wild,'' Azureus
continued to experience unsatisfactorily high errors.
This occurred because its gossip pattern stifled convergence: as all
coordinate maintenance is ``piggybacked'' on other traffic, each
coordinate became heavily skewed to small segments of the network and
failed to become globally accurate.
We created a simple new technique called neighbor decay
that smoothly manages these skewed neighbor sets while retaining the
appealing zero-maintenance property of Azureus' coordinates.
With these techniques in place, Azureus' coordinates and, by
inference, Internet-scale coordinate systems in general, can now
tackle a basic goal: quickly and efficiently optimizing anycast decisions
based on correct latency estimates.
Because even with these approaches Internet-scale coordinates are still
partially untamed,
we isolated and analyzed a set of major remaining impediments.
The contributions of this work are:
Improvements to the live Azureus coordinate system, producing
a 43 percent improvement in accuracy and a four order-of-magnitude
improvement in stability.
The new coordinates optimize DHT traversal, helping the application
pick physically close nodes; this trims lookup delay by 33 percent
compared to the most direct logical path.
A new technique for managing neighbors in coordinate systems where
all gossip is ``piggybacked'' on existing traffic -- i.e. where there are zero maintenance messages.
A new, large-scale latency matrix providing a valuable new
portal into Internet behavior.
Previous large matrices were between DNS servers and did not capture
latencies between actual nodes [9,32].
Evidence why Internet-scale latency estimation with
coordinates works. We find the intrinsic dimensionality of
large-scale systems to be less than previous work, which studied
smaller networks [31], and we show why the world
flattens into near-planar Euclidean coordinates.
Analysis of five major barriers to accuracy: churn, drift,
intrinsic error, corruption, and latency variance.
We present techniques for lowering these barriers and
show how latency variance requires a fundamentally new approach
to latency prediction.
In Section 2, we explain why practitioners, such
as the Azureus developers, use network coordinates in large-scale
deployments and review how Azureus' network coordinate algorithm works.
In Section 3, we use a dense latency matrix to
analyze the characteristics of the Azureus' latency distribution,
determining its intrinsic dimensionality and the extent of its triangle
inequality violations.
In Section 4, we describe three techniques
integrated into the Azureus code. In Section 5 we
review metrics for evaluating coordinate systems.
In Section 6, we examine the live performance of Azureus
through three methods: (a) Azureus clients we ran on PlanetLab, (b)
crawling instrumented clients run by approximately ten thousand
Azureus users, and (c) an application-level benchmark: using
coordinates to optimize DHT hop selection.
In Section 7, we examine five primary causes of the
remaining difference between the current live accuracy and what appears to be
achievable based on simulation results.
In Section 8, we review the different approaches for estimating
latencies in large distributed systems.
In Section 9, we conclude.
2 Background
Azureus is currently one of the most popular clients for BitTorrent, a
file sharing protocol [7]. For a given file, the
protocol embodies four main roles: an initial seeder,
new seeders, a tracker, and peers.
Initial seeders, new seeders, and peers are all
transient clients; trackers are typically web servers. The
initial seeder is the source of the file. It divides the file into
small pieces, creates a metadata description of the file and
sends this description to the tracker. Peers discover this file
description through some out-of-band mechanism (e.g., a web page) and
then begin looking for pieces of the file. Peers contact the tracker
to bootstrap their knowledge of other peers and seeds.
The tracker returns a randomized subsets of other peers and seeds.
Initially, only the initial seeder has pieces, but soon peers are
able to exchange missing pieces with each other, typically using a
tit-for-tat scheme. Once a peer acquires all of the pieces for a
file, it becomes a new seeder. This collection of clients actively sharing
a file is called a swarm.
In Azureus, file descriptors and other metadata are stored in a DHT,
in which all clients participate, and any node can be assigned the
role of tracker if it is or is near the root of the hash of a given
file's descriptor.
In practice, there can be many possible trackers from which to choose
for a particular file and even more possible clients for a given
piece. A key challenge in efficiently implementing this protocol is
providing a simple method for node selection, an example of
anycast.
Distributed systems developers are beginning to use network
coordinates as a mechanism to support anycast. The Azureus developers
use them for two distinct purposes: (a) to optimize DHT traversal and
(b) to select nearby nodes for application-level congestion
monitoring.
We are currently testing another coordinate-based optimization:
biasing the set of nodes the tracker returns to be nearby the caller.
Bindal et al. show in simulation how these locally-biased swarms reduce
download times and inter-ISP traffic [3].
Future plans call for using network coordinates to optimize media
streaming over the Azureus network.
We worked with the Azureus developers to analyze and improve the
coordinates maintained by their system, which contains more than a
million clients.
We were able to modify the Azureus code internals and watch its
behavior on a subset of the network because
approximately ten thousand Azureus users run a plugin that automatically
upgrades their version to the latest CVS release.
According to the Azureus developers,
the clients who use the latest release exhibit normal user
characteristics, so we expect that our results generalize to the
larger system.
Azureus uses the Vivaldi network coordinate update
algorithm [9].
The Vivaldi algorithm calculates coordinates as the solution to
a spring relaxation problem. The measured latencies between nodes are
modeled as the extensions of springs between massless bodies. A
network embedding with a minimum error is found as the low-energy
state of the spring system.
Figure 1:
Vivaldi update algorithm.
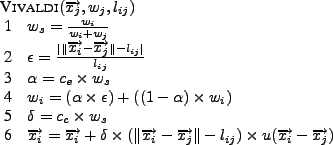 |
Figure 1 shows how a new observation, consisting of
a remote node's coordinate
 , its confidence , its confidence  ,
and a latency measurement ,
and a latency measurement  between the two nodes, between the two nodes,  and and  ,
is used to update a local coordinate. The confidence, ,
is used to update a local coordinate. The confidence,  ,
quantifies how accurate a coordinate is believed to be. Note that
confidence increases as it approaches ,
quantifies how accurate a coordinate is believed to be. Note that
confidence increases as it approaches  .
The algorithm first calculates the sample confidence .
The algorithm first calculates the sample confidence  (Line 1)
and the relative error (Line 1)
and the relative error  (Line 2).
The relative error expresses the accuracy of the coordinate in
comparison to the true network latency.
Second, node updates its
confidence with an exponentially-weighted moving
average (EWMA) (Line 4). The weight (Line 2).
The relative error expresses the accuracy of the coordinate in
comparison to the true network latency.
Second, node updates its
confidence with an exponentially-weighted moving
average (EWMA) (Line 4). The weight  for the EWMA is set according to
the sample confidence (Line 3). Also based on the sample
confidence, for the EWMA is set according to
the sample confidence (Line 3). Also based on the sample
confidence,  dampens the change applied to the
coordinate (Line 5). As a final step, the coordinate is updated in
Line 6 ( dampens the change applied to the
coordinate (Line 5). As a final step, the coordinate is updated in
Line 6 ( is the unit vector). Constants is the unit vector). Constants  and and  affect
the maximum impact an observation can have on the confidence and the
coordinate, respectively. affect
the maximum impact an observation can have on the confidence and the
coordinate, respectively.
Height is an alternative to a purely Euclidean distance metric.
With height, the distance between nodes is measured as their
Euclidean distance plus a height ``above'' the hypercube that
models the latency penalty of network access links, such as DSL
lines [9].
Each node successively refines its coordinate
through periodic updates with other nodes in its neighbor set.
In Azureus, the information used to maintain the network coordinate
system is entirely piggybacked on existing messages, such as routing
table heartbeats. While this does mean the coordinates induce no
additional overhead (beyond 24 bytes per message for four
dimensions, height, and confidence), it also means
that the algorithm needed to be modified to function
passively.
In Section 4.2,
we describe a technique we developed to incorporate
information from highly transient members of the neighbor set.
3 Latencies in the Wild
Before we examine the accuracy with which Internet-scale latencies can
be embedded into a coordinate space, we compare latencies in Azureus
to those in other networks to gain insight into the causes of error in
Internet-scale embeddings.
We generate a dense latency matrix of a subset of Azureus and compare
it to PlanetLab and to the MIT King data set, a square
matrix containing the median latencies between 1740 DNS servers
collected using the King method [9,14].
Researchers found PlanetLab and MIT King can be reduced to low
dimensional coordinates with less than or equal to 10 percent median
error [18,9].
We examine three characteristics: inter-node round trip
times, violations of the triangle inequality, and the intrinsic
dimensionality of the data sets.
We instrumented clients that we ran
on PlanetLab to record the
application-level latency between them and the rest of the network
creating a dense latency matrix.
These clients ran on 283 PlanetLab nodes for 24 days starting on July
19th 2006, collecting approximately 950,000,000 latency
measurements to 156,658 Azureus nodes.
To reduce these raw measurements into a dense latency matrix, we used
the following process: first, we summarized each edge with the median
round trip time for this edge, discarding edges with fewer than a
minimum number of samples (4);
second, we discarded all nodes that had fewer than half of the maximum
number of edges (280). This process resulted in a 249x2902
matrix with 91 percent density, where 83 percent of the entries were the
median of at least ten samples.
We derived the PlanetLab data set from the Azureus matrix by
simply selecting the subset of nodes that were PlanetLab hosts.
3.2 Round Trip Times
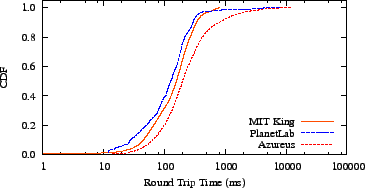
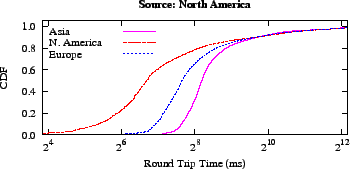
Figure 2:
A comparison of round-trip times shows that Azureus,
typifying Internet end-users, spreads
across a range one order-of-magnitude larger than MIT King, based on
inter-DNS latencies. This larger spread tends to lead to lower
accuracy embeddings.
|
In Figure 2, we illustrate the distribution of
inter-node round trip times between nodes in the three data sets.
The King measurements were limited to a maximum of
800ms. The data exhibit one important characteristic: spread.
The application-level, Azureus round trip times spread across four
orders-of-magnitude, while the inter-DNS, King data set spreads across
three. In theory, this is not a harbinger of higher embedding error;
in practice, however, as Hong et al. have shown, the error between
nodes whose distance is near the middle of the latency distribution
tends to be the lowest [33]: with longer tails
to this distribution, there are more edges to be inaccurate.
(We found ICMP measurements exhibit a similarly wide distribution; see
Section 7.5.)
This wide spread is a warning sign that Azureus will have higher error
than a system with a narrower round trip time distribution.
3.3 Violations of the Triangle Inequality
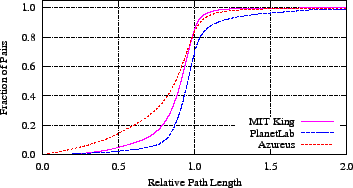
Figure 3:
In all three data sets, over half of all node pairs
fail the Tang/Crovella triangle inequality test, because there exists
a third node between the nodes in the pair that produces a shorter path
than the direct path between the two nodes.
A large fraction of these violating pairs have paths
that are significantly faster.
|
Network coordinate embeddings that use Euclidean distances make the
assumption that the triangle inequality is not violated to a great
extent by a large fraction of pairs of nodes.
The triangle inequality states that for any triangle the length of a
given side must be less than the sum of the other two sides but
greater than the difference between the two sides, i.e., the sides must
be able to form a triangle.
When the latencies between node triples cannot form a triangle, they
are said to violate the triangle inequality.
Nodes with large and frequent violations tend to be the ones with the
largest individual prediction error and their existence decreases
overall accuracy (see [18] and
Section 7.3).
We use a method from Tang and Crovella to examine the severity of
triangle inequality violations [31]. This method
normalizes the severity of each violation, permitting an all-pairs
comparison.
For each node pair, we find the shortest path between the two that
passes through a third node. Thus, for all pairs of nodes i and
j, we find the best alternative path through a node  and
normalize by the latency between i and j: and
normalize by the latency between i and j:
Figure 3 illustrates the cumulative distribution of this
quantity, the relative path length.
Note that any fraction below 1 is a violation: there exists a path
through an alternative node that is faster than the direct path.
83 percent of the Azureus pairs, 85 percent of MIT King, and 68 percent of
the PlanetLab subset violate the triangle inequality.
In contrast to earlier work that examined several small-scale data
sets [31], we find the fraction of pairs with the
largest violations to be quite large: Tang and Crovella found only
10 percent of nodes had an alternative path that is greater than or
equal to 20 percent faster;
here 37 percent of Azureus pairs and 22 percent of MIT King pairs exhibit this
large level of violation.
We examined the cause of the large fraction of pairs with very low
rpl (less than  ) in Azureus.
We found that only a few nodes were members of many of these low
rpl pairs.
What distinguished these nodes -- and what was the cause of their
frequent participation in triangle inequality violations -- was that
their delay to non-PlanetLab nodes was atypically large, on the order
of seconds, while their delay to other PlanetLab nodes remained
typical (less than a second).
In effect, this extended one side of the triangles these nodes
participated in: d(i,j) became large while d(i,k) and
d(k,j) did not.
Because PlanetLab nodes that exhibited this behavior were co-located,
we conjecture that the Azureus traffic to non-PlanetLab sites was
being artificially limited at site gateways, while traffic to
PlanetLab nodes avoided this traffic shaping.
Rather than being a construct of the PlanetLab environment, this
effect, leading to bi- or multi-modal latency distributions,
will be the norm for at least some participants in Internet-scale
applications that use well-known ports and consume a large amount of
bandwidth, such as Azureus, because some sites will limit traffic and
some will not.
Like the round trip time spread, Azureus' violations foreshadow a
higher embedding error. ) in Azureus.
We found that only a few nodes were members of many of these low
rpl pairs.
What distinguished these nodes -- and what was the cause of their
frequent participation in triangle inequality violations -- was that
their delay to non-PlanetLab nodes was atypically large, on the order
of seconds, while their delay to other PlanetLab nodes remained
typical (less than a second).
In effect, this extended one side of the triangles these nodes
participated in: d(i,j) became large while d(i,k) and
d(k,j) did not.
Because PlanetLab nodes that exhibited this behavior were co-located,
we conjecture that the Azureus traffic to non-PlanetLab sites was
being artificially limited at site gateways, while traffic to
PlanetLab nodes avoided this traffic shaping.
Rather than being a construct of the PlanetLab environment, this
effect, leading to bi- or multi-modal latency distributions,
will be the norm for at least some participants in Internet-scale
applications that use well-known ports and consume a large amount of
bandwidth, such as Azureus, because some sites will limit traffic and
some will not.
Like the round trip time spread, Azureus' violations foreshadow a
higher embedding error.
3.4 Dimensionality
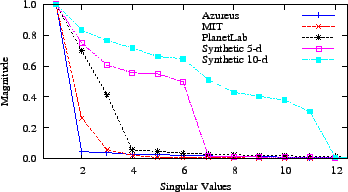
Figure 4:
Scree plots suggest the inherent dimensionality of MIT
King, PlanetLab, and Azureus datasets is small. Two synthetic matrices of five
and ten dimensions are included for comparison.
|
Network coordinates would be less useful if a large number of
dimensions were needed to capture the inter-node latencies of the
Internet. Tang and Crovella used Principal Component Analysis (PCA)
to hint at the number of dimensions required to encompass this
information for several small data sets [31].
Because we wanted to know if few dimensions would be sufficient for a
large, broad spectrum of endpoints, we used the same method to examine
the intrinsic dimensionality of Azureus.
PCA is a linear transformation from one coordinate system to a new,
orthogonal coordinate system. The new system is chosen such that each
subsequent axis captures the maximum possible remaining variance in
projections from points in the old system to points in the new: the
first new axis captures the most variance, the second less, and so on.
While an input system of k elements will produce an output system
also of k elements, often only the first several dimensions of the
output system will summarize all or part of the same distance
information of the original set of points.
Singular values are a result of the PCA transformation: each new axis
has a corresponding singular value that describes the amount of
variance captured by this axis.
Thus, if a singular value is very small or zero, this suggests that
this axis is unnecessary in describing the variance in a particular
data set.
Because PCA requires a full matrix, we first used the following two
techniques to fill in the remaining 9 percent of the Azureus matrix and
the missing  percent of the MIT matrix. We filled half of the missing
Azureus values with the King technique [14] (King
fails in certain cases, e.g., when the endpoint cannot be resolved). We
interpolated the remaining values in both matrices by embedding each
matrix and extracting the missing values. percent of the MIT matrix. We filled half of the missing
Azureus values with the King technique [14] (King
fails in certain cases, e.g., when the endpoint cannot be resolved). We
interpolated the remaining values in both matrices by embedding each
matrix and extracting the missing values.
We use a scree plot to illustrate how much variance each new singular
value is capturing, which in turn hints at the inherent
dimensionality of the underlying data set.
The independent variables of a scree plot are the singular values,
sorted by their magnitude; the dependent variables are their
corresponding magnitudes. At the point where the magnitude of the
singular values becomes zero or nearly zero, the relative importance
of this and subsequent singular values (i.e., dimensions) is low. Up to
this point, these dimensions are necessary to capture the values in
the original input matrix, which in this case is made up of inter-node
latency values.
We show the normalized singular values for the King, PlanetLab, and
Azureus data sets in Figure 4. For comparison, we
created synthetic 5d and 10d systems each containing 250 random
points in a unit hypercube and found their singular values.
As one would expect, the synthetic 5d and 10d data sets show a
sharp knee soon after 5 and 10 singular values, respectively. In
contrast, the bulk of the inter-node latency information from two
Internet-based data sets requires very few dimensions. Azureus, in
particular, is dominated by a single dimension, and MIT King by two.
However, the next several dimensions remain significant for the few
nodes that need to navigate around the clusters of nodes that have
found good positions. In the data, this is shown by the continued
relevance of singular values when compared to synthetic data sets.
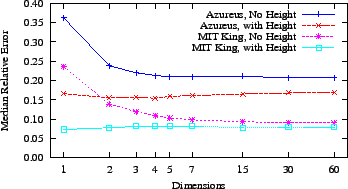
To lower the error for these nodes, we find 4-5
dimensions is appropriate for Internet-scale network coordinates.
While the previous two characteristics, round trip times and
violations of the triangle inequality, suggest that the Azureus
latency distribution will experience higher error than MIT King, its
intrinsic dimensionality does not appear to be an additional impediment.
3.5 Intercontinental Latency Distributions
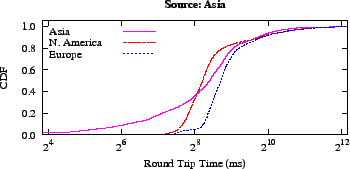
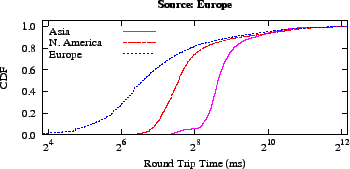
Figure 5:
Intercontinental Latency Distributions illustrate why a
Euclidean distance metric works for network coordinates on the
Internet: messages from Asia to Europe (and from Europe to Asia) go
through North America.
|
While the Azureus data set is clearly of low dimensionality, a more
concrete way to examine the ``flatness'' of this large-scale network
is to look at its intercontinental latency distribution.
In a way, it is surprising that embedding latencies found on a globe
(the Earth) into a Euclidean space works at all.
If messages could be routed in any direction of the Earth's surface,
using a Euclidean metric would be a poor choice. Previous work on
spherical coordinates, however, found they had significantly
larger error than Euclidean ones [9].
Anecdotal evidence suggested that the main reason why the Internet
embeds into a low dimensional Euclidean space is because the world is
flat: traffic between Asia and Europe flows through North
America [9].
An examination of our Azureus data set confirms that this
traffic flow is indeed the case. We mapped the IP addresses in the
data set to countries through their autonomous system record and, in
turn, mapped these countries to continents.
As Figure 5 illustrates, no messages from Asia to
Europe were faster than those from Asia to North America; the same
holds in the other direction.
All paths between Asia and Europe appear to travel in a line across
two oceans.
This trend continues until the speed of the connection to ISPs or
other coarse delays begin to dominate.
This flatness suggests why hyperbolic
coordinates [28] also work well: North America maps
to the center of the hyperbolic space.
Indeed, research comparing these two methods found neither a Euclidean nor a
hyperbolic metric dominates in all cases [19].
Thus, because the distribution of latencies is ``flat'' - at least at
a high level - using a Euclidean metric is sufficient.
In the future, new direct transmission lines between Europe and Asia
may change the Internet's shape, perhaps driving a shift to spherical
coordinates.
4 Taming Live Coordinate Systems
From our experience tuning a network coordinate system on
PlanetLab, we developed two techniques that
lead to more stable and accurate coordinates on a small ``live''
system [18].
The Azureus and Harvard teams worked together to integrate these techniques
into the Azureus code.
After confirming that these techniques worked as expected, we found
and resolved a new problem: skewed neighbor sets. This problem
particularly disrupts large-scale, live coordinate systems like Azureus that
rely solely on other application communication for maintenance
(i.e. they have zero maintenance costs) and has
has been suggested as a goal for coordinate
systems [9].
Through experimentation with these techniques in simulation and
periodic measurement of the live system, we arrived at coordinates
that are not perfect, but are a satisfactory start. We include a
review of the techniques we developed as part of our previous research in
Section 4.1 and describe our new technique,
neighbor decay, in Section 4.2.
4.1 Latency and Update Filters
In previous work, we developed two simple filters that had
distinct beneficial effects on a coordinate system running on
PlanetLab [18]. The first type, which we call a
latency filter, takes the stream of latency measurements from a
remote node and turns these into an expected latency value. For a
stream of measurements between nodes i and j, the goal of the
latency filter is to summarize the measurements, providing a current
and stable description of the expected latency between i and j.
There were two main considerations affecting the value ![$Ex[rtt(i,j)]$](img26.png) .
First, anomalous measurements, sometimes several orders-of-magnitude
larger than the baseline, would appear in the stream of measurements.
For example, we would measure a round-trip time of 1000ms when
typical measurements were 200ms. Although we were using
application-level UDP measurements, we found these anomalies also
occurred with ICMP. Second, the expected value could not be fixed at
a single value. Due to congestion and BGP changes, the underlying
latency between pairs of nodes changes. We found that using a simple,
short, moving median worked as a latency filter compensating for
both anomalous measurements and plateau shifts. .
First, anomalous measurements, sometimes several orders-of-magnitude
larger than the baseline, would appear in the stream of measurements.
For example, we would measure a round-trip time of 1000ms when
typical measurements were 200ms. Although we were using
application-level UDP measurements, we found these anomalies also
occurred with ICMP. Second, the expected value could not be fixed at
a single value. Due to congestion and BGP changes, the underlying
latency between pairs of nodes changes. We found that using a simple,
short, moving median worked as a latency filter compensating for
both anomalous measurements and plateau shifts.
The second type of filter we developed on PlanetLab focuses on making
coordinates more stable, not more accurate.
These update filters tackle a problem shared across many types
of applications that use network coordinates: discerning when a
coordinate has changed ``enough'' to potentially necessitate an
application-level reaction (e.g., a service migration).
In an early application we developed that used network
coordinates [25], we found it was hard for the
application to immediately determine if it should react to coordinate
updates, which were occurring several times per minute.
A single threshold (``react if moved more than 50ms'') did not work
for all nodes because the volume through which each coordinate moved was
node-dependent.
We developed a generic filtering technique to allow applications to
easily determine when to update coordinates.
Applications that find all updates useful can bypass the filters.
Update filters make the distinction between constantly evolving
``system-level'' coordinates and stable ``application-level''
coordinates, providing a barrier between these two:
system-level coordinates fine tune the coordinate further with each
measurement, while application-level coordinates change only when the
underlying coordinate has undergone a significant migration to a new
location relative to other coordinates.
In our previous work, we examined several heuristics for
distinguishing between a system-level coordinate that was moving
around a single point (not requiring application-level notification)
and one that had migrated to a new location (potentially requiring
application activity).
We found heuristics that compare windows of previous system-level
coordinates to one another, especially those that augment this
comparison with distances to other nodes in the system, perform well.
Applications can tune how much these windows may differ before being
notified.
4.2 Neighbor Decay
Researchers have posited that a network coordinate subsystem could
become a useful component of numerous large-scale distributed
applications, particularly if it could perform its job passively,
that is, without generating any extra traffic. In our Azureus
implementation, this passivity was forced upon us: we had no control
over the selection of which nodes we gossipped with or when we
gossipped with them, because the information necessary for a
coordinate update was piggybacked on to other application-level
messages, e.g., DHT routing table maintenance. Due to this passivity
and to churn, nodes did not have fixed sets of neighbors with
which they could expect regular exchanges. In fact, nodes would
frequently receive 1-3 updates from a remote node as that node was
being tested for entry into the routing table and then never hear from
that node again.
The net effect of these limited exchanges was that each node's
``working set'' was much smaller than the number of nodes with which
it actually communicated. Nodes were having blips of communication with many
nodes, but constant communication with few. The goal of
neighbor decay is to expand the size of the working set,
which in turn improves accuracy.
A standard, gossip-based coordinate update involves taking new
information from a single remote node and optimizing the local coordinate
with respect to that node. If some set of remote nodes is sampled at
approximately the same frequency, a node's coordinate will become
optimized with respect to these remote coordinates (which are in turn
performing the same process with their neighbors). However, if some
remote nodes are sampled at a far greater frequency than others, the
local coordinate optimization process will become skewed toward these
nodes.
In the theoretical limit, the result would be the same, but in
practice, these skewed updates - a problem that could be expected in
any passive implementation - slow the global optimization process.
Our solution to the problem of skewed neighbor updates is simple.
Instead of refining our coordinate with respect to the remote node
from which we just received new information, we refine it with respect
to all nodes from which we have recently received an update. To
normalize the sum of the forces of this recent neighbor set, we
scale the force of each neighbor by its age: older information
receives less weight. This allows nodes that we hear from only a few
times to have a lasting, smooth effect on our coordinate.
Algorithmically, we set the effect of a neighbor j on the aggregate force
F to be:

where  is the age of our knowledge
of j and is the age of our knowledge
of j and  is the age of the oldest neighbor.
This use of an expanded neighbor set that decays slowly over time has
two main benefits. First, because the force from each update is
effectively sliced up and distributed over time, nodes' coordinates do
not jump to locations where they have high error with respect to other
members of the neighbor set. Second, by keeping track of recent, but
not old, neighbors, neighbor decay acts to increase the
effective size of the neighbor set, which in turn leads to higher
global accuracy. In our implementation, nodes expired from the
recent neighbor set after 30 minutes.
Note the distinct effects of neighbor decay from both
latency and update filters. Latency filters generate a
current, expected round trip time to a remote node and update filters
prevent system-level coordinate updates from spuriously affecting
application behavior. Neighbor decay, in contrast, handles the
problem of skewed updates that can occur when network coordinates are
maintained as a passive subsystem. It allows the smooth incorporation
of information from a wider range of neighbors, particularly in a
system where contact between nodes is highly transient.
In simulation, we confirmed that neighbor decay substantially increased
stability and moderately improved continuous relative error.
5 Measuring Coordinate Systems
In this section, we review metrics used to evaluate coordinate
systems and other latency services.
Relative Error.
Relative error, the most basic and intuitive measure of accuracy, is
the difference between the expected and actual
latencies between two nodes:
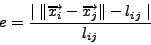
where the expected latency is the distance between the two coordinates.
Relative error comes in three forms: global, continuous, and neighbor.
Global relative error is the accuracy from the viewpoint of an
omniscient external viewer: at one instant, the metric is computed for
all links.
With the simulations that use a latency
matrix, this is what we compute because we do indeed have this viewpoint.
Continuous error is what a node computes on-the-fly as it receives
new observations from remote notes. This error is added to a
statistic, such as an EWMA, as in Vivaldi's confidence.
Two disadvantages to continuous error are (a) a single measurement
may result in a large change in value and (b) it can become
skewed by a handful of remote nodes if the ``working set'' of active
gossip is small.
Instead of continuous error,
we use neighbor error as a proxy for global error when live nodes are
performing the computation themselves, e.g., within live Azureus clients.
Neighbor error is the distribution of relative errors
for a set of recently contacted nodes.
With a large number of
neighbors, neighbor error generally provides a close approximation of
global error.
Stability.
Stable coordinates are particularly important when a coordinate change triggers application
activity.
In our distributed streaming query system, for example, a coordinate
change could initiate a cascade of events, culminating in one or more
heavyweight process migrations [25]. If the systems'
coordinates have not changed significantly, there is no reason to
begin this process.
A stable coordinate system is one in which coordinates are
not changing over time, assuming that the network itself is
unchanging.
We use the rate of coordinate
change
to quantify stability. The units for stability are
ms/sec.
Descriptions of and results from other metrics are included in technical
report version of this paper [17].
6 Internet-Scale Network Coordinates
Using a latency matrix can only tell part of the story of an Internet
coordinate system. It helps describe the network's characteristics,
e.g., its intrinsic dimensionality, but misses out on problems that may
occur only in a running system, such as churn, changes in latencies
over time, and measurement anomalies.
We used three distinct methods to understand the online performance of
Azureus' coordinates:
(a) on PlanetLab, we ran instrumented Azureus clients that
recorded the entirety of their coordinate-related behavior
(Section 6.2), (b) we crawled approximately ten
thousand Azureus clients that internally tracked the performance of
their coordinates using statistics we inserted into the Azureus code
(Section 6.3), and (c) we ran a benchmark to
determine the effectiveness of the coordinates on application-level
decisions (Section 6.4).
Because updates to the CVS tree could take weeks to proliferate to a
majority of users, changing single variables or techniques was not
feasible. Instead we relied on simulations and on-going measurement
to guide the roll-out of two major coordinate versions.
Azureus' coordinates originally used two dimensions, height,
and none of the three filtering techniques we described in
Section 4. We call this version 2D+H.
To create version 5D, we incorporated the two techniques from our
previous research, latency and update filters, into the code. Based
on our on-going PlanetLab coordinate service, which did not use height
and reliably exhibited low error, we also dropped height and
added three more dimensions.
Unfortunately, removing height proved to be a mistake. Through
simulations of the Azureus latency matrix (see
Figure 6), we realized we could expect a substantial
improvement in accuracy by converting the last dimension of the 5d
implementation to height without changing the gossip packet structure.
We also found the highly skewed neighbor sets slowed convergence and
developed the neighbor decay technique to compensate. We
combined these changes and rolled out version 4D+H.
Figure 6:
Because height had a major, positive impact on Azureus
in simulation, we returned it to the 4d+h version.
|
6.2 PlanetLab Snapshots
We took snapshots of each version by running clients on approximately
220 PlanetLab nodes. Each snapshot lasted for at least three days,
and logged updates with approximately 10,000 Azureus nodes. We
collected a snapshot for each of the three versions in March, July,
and September 2006, respectively.
Note that these instrumented clients never stored or transferred any
content that travels over the Azureus network.
Figure:
The combination of filtering, neighbor decay, and height lead
to substantially more accurate coordinates on PlanetLab nodes
participating in the Azureus network coordinate system. Comparing
2D+H to 4D+H, the data show a 43 percent improvement in
relative error and a four orders-of-magnitude
improvement in stability.
|
We compare data gathered from the different versions in
Figure 7. Because the data are aggregated across
roughly the same source PlanetLab nodes, the three snapshots provide a
reasonable, though imperfect, way to isolate the effects of the
different techniques.
In all cases, we find 4D+H is more accurate and stable than both
the original 2D+H and our initial rollout of 5D.
Our first revision had mixed results. Based on
this data and on simulations with and without height, the data convey
that the removal of height damaged accuracy more than the filters
aided it. In retrospect, given the Azureus round trip time
distribution (see Section 3.2), in which 7.6 percent of the node
pairs exhibit round trip times greater than or equal to one second,
it is not surprising that using height helped many nodes
find a low error coordinate. In addition, given that two dimensions
are enough to capture much of Azureus' inherent dimensionality, it is
also not surprising that the addition of three dimensions did not
radically improve accuracy. Although the 5D coordinates are
less accurate, they are more than 2-1/2 orders-of-magnitude more
stable because the latency filters prevent anomalous measurements from
reaching the update algorithm.
Our second change was more successful.
The introduction of neighbor decay and the re-introduction of
height in 4D+H create a much more accurate coordinate space than
either of the previous two snapshots.
This increase in accuracy occurs because neighbor decay enables nodes
to triangulate their coordinates with a larger fraction of the network
(and their neighbors are doing the same) and because height
supplies the numerous nodes on DSL and cable lines with the additional
abstract distance over which all their physical communication must travel.
We first evaluated neighbor decay in simulation.
To confirm its continued effectiveness in a live
system, we performed an experiment where we monitored the convergence
of a node
with and without neighbor decay enabled as part of the
4D+H coordinate system.
In an average of three trials, we found neighbor decay improved median
accuracy by 35, 40, and 54 percent at the 15, 30, and 60 minute
marks respectively.
6.3 End-Host Live Coordinates
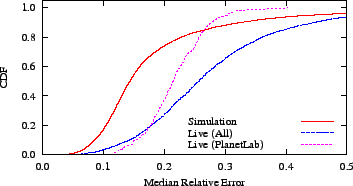
Figure 8:
Reality does not live up to expectations: a comparison of
probed statistics from live Azureus nodes to those from simulation
suggests that accuracy could be improved by as much as 45 percent.
Section 7 explores the major remaining impediments.
|
The logs from our Azureus clients running on PlanetLab nodes
provide a detailed view of a narrow slice of the system. To obtain a
picture of the broader system, we inserted online statistics collection
into the Azureus CVS tree.
Using its recent neighbor set, each node computed its neighbor error
and stability statistics on demand when probed.
We present results from Azureus end-hosts running version 4D+H.
Figure 8 ``live (all)'' illustrates the data from a crawl
of 9477 end-hosts.
We exclude live nodes with fewer than 10 percent of the maximum 512
neighbors because their metrics are skewed to a very small percentage
of the network.
The data show that the bulk of the Azureus system experiences accuracy
similar to clients running on PlanetLab.
However, the error on the greater Azureus network has a long tail: at
the 95th percentile, its accuracy is 76 percent worse.
As we discuss in Section 7.1, we conjecture that the high
rate of churn causes much of this difference in the tail.
In order to hint at the exigencies caused by running ``in the wild''
as opposed to safely in the lab, we compared the statistics from live
Azureus nodes to those from our simulated embeddings of the Azureus
latency matrix. In Figure 8, we compare live and
simulated relative error.
The data show a significant gap between live and simulated performance.
(Prior work using the same simulator found simulations of PlanetLab mirrored live
results [18].) The medians of the relative error
distributions are 26 percent and 14 percent for live and simulated
coordinates, respectively, a difference of 45 percent.
The data suggest that network coordinates have been partially tamed, but
can be made substantially more accurate, and, therefore, more useful for
distributed applications that would like to make cheap, quick
decisions between providers of the same service.
We show how the current level of accuracy affects these anycast decisions
in the following section.
6.4 Application-Level Performance
Figure 9:
By choosing paths that are small detours in the logical
space but lower latency, network coordinates improve lookup delay in
Azureus's DHT.
|
Accuracy and stability metrics capture application-independent,
low-level behavior. To understand how Internet-scale coordinate
systems can affect application-level behavior, we also examined how
Azureus uses them to make higher-level, anycast decisions in one of
its common tasks: DHT key lookup.
Azureus performs this operation for each tracker announcement, torrent
rating lookup and publish, and NAT traversal rendezvous lookup and
publish (for tunnelling through NATs).
We modified an Azureus client so that it used network coordinates to
optimize lookup delay.
Our experiment to evaluate the change in lookup delay first stored a
set of keys in the DHT, then looked up each key using four distinct
node selection methods, recording the time for the lookup operation.
For each key, we ran the methods in random order.
Each method selects one node from a small set, i.e., is performing an
anycast: all choices will make logical progress toward the target,
some have lower latency than others.
Azureus uses Kademlia, which defines the logical distance between two
DHT keys as the exclusive-or of their bits [20].
Starting with the logically nearest known nodes to the target:
XOR picks the logically nearest node, 2D+H picks the node
whose latency as predicted by the 2D+H coordinates is smallest,
4D+H picks the lowest latency node as predicted by the
4D+H coordinates, and RANDOM picks randomly from the set.
Each node contacted returns its neighbors that are logically close to
the target.
This repeats until either a node storing the key is found or the
lookup fails.
Because Azureus performs DHT lookups iteratively, we were able to
experiment with the lookup algorithm through code updates on only a
single node.
We plot the distribution of delays from storing 250 keys and
performing 2500 lookups in Figure 9.
Compared to the XOR method, which always chooses the nearest
logical node, the data show that 4D+H reduces lookup delay by
33 percent at the 80th percentile. It is 12 percent faster than the
early version of the coordinates, 2D+H, also at the 80th
percentile.
Because no latency prediction information is currently returned to the
caller, the optimization only affects the selection of the first hop.
In addition, we were not able to predict latencies to 34 percent of nodes
due to version incompatibilities.
Both of these factors suggest these improvements are conservative.
We excluded lookups that timed out due to dropped UDP messages to
avoid dependence on a particular timeout handling mechanism.
These data show that using network coordinates can provide a
substantial improvement to an application-level process.
7 Barriers to Accuracy
In this section, we examine five primary causes of the remaining
difference between the current live accuracy and what appears to be
achievable based on simulation results. The five barriers are: churn,
drift, intrinsic error, corruption, and latency variance. We present
techniques that address the first three barriers and non-malicious
corruption. However, malicious corruption and latency variance remain
unsolved; indeed, the latter requires a fundamentally new approach to
latency prediction.
Based on our simulation and PlanetLab results and on monitoring
Azureus over time, we have added the techniques that address churn,
drift, and non-malicious corruption to the Azureus code. While
preliminary experiments suggest they function as expected, we have not
yet fully quantified their effects and do not include results for them
here.
7.1 Churn
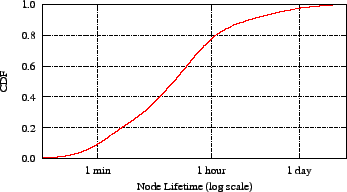
Figure 10:
Azureus nodes follow a typical peer-to-peer lifetime
distribution curve. With 78 percent of its nodes in the
system for less than one hour, it is difficult to
incorporate the steady stream of newcomers with coordinates
starting at the origin.
|
Distributed network coordinate algorithms traditionally consider churn as
part of their network model. Researchers ask the question:
given an existing, stable system, how quickly can a new node find a
stable, accurate coordinate? Unfortunately, implicit in this question
is the assumption that
the existing system has converged, and this assumption breaks
down in many large-scale distributed systems, including Azureus.
As Figure 10, illustrates, Azureus follows the
long-tailed lifetime distribution
typical of peer-to-peer systems [4].
(Azureus clients track uptime using an internal, query-able statistic.)
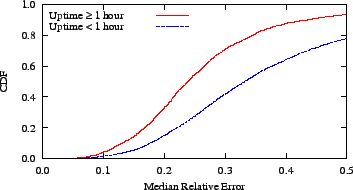
Figure 11:
Azureus nodes that have been in the system for longer periods
have more accurate coordinates. This suggests that churn may hurt
convergence of Internet-scale coordinate systems.
|
Because coordinate updates were on the order of tens of seconds or
sometimes minutes apart, nodes often did not have much time to settle
into a stable position before they exited the system.
Using the data from our crawl of the live network, we separated nodes
into ones that had been in the system for an hour or more and
those that had not. We plot the relative error experienced by these
two groups in Figure 11. The data confirm
that these short-lived nodes, which make up the majority of the
system, are substantially less accurate than long-lived ones.
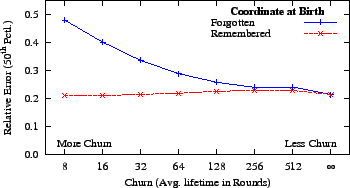
Figure 12:
Coordinate systems that experience high churn rates and do
not allow nodes to ``remember'' their previous coordinates have
trouble converging.
|
We considered three potential solutions to the problem of sustaining a
coordinate system under high churn rates. First, nodes could perform
a rapid initial triangulation process before shifting to a lower
update rate. However, adjusting the gossip rate over time has two
problems: (a) ``passive'' (i.e. maintenance-free) coordinate
systems have no control over gossip and (b) in an ``active'' system,
it would be a new, complex knob. Second, we considered ``greedy
optimization,'' where instead of just stepping once through the update
process, nodes would repeat until a (local) minimum had been reached
with respect to the currently known neighbors. Unfortunately, we
found that this form of optimization does not work well until many
neighbors are known, which is not the case early in a node's lifetime.
Finally, we found a solution that is both extremely simple and had
positive results in simulation: instead of starting from scratch when
restarting a client, have it begin where it left off. We performed an
experiment where we varied the amount of churn in simulation and
toggled whether or not nodes ``remembered'' their coordinate on
re-entry. In Figure 12, we show the results of this
experiment. We found that when nodes started at the origin on
re-entry, they had a deleterious effect not only on themselves, but on
overall system convergence. In contrast, with this simple technique,
accuracy remained about the same as when there was no churn. While
this technique assumes limited drift (see next section), it appears to
be a promising start to resolving the noxious effect of churn on live
coordinate systems.
Monitoring our PlanetLab-based coordinate service over several
months revealed that coordinates migrated in a fairly constant
direction. That is, the centroid of the coordinates did not move in a
``random walk,'' but instead drifted constantly and repeatedly in a
vector away from the origin. This was surprising because our previous
study, based on a shorter, three-day trace, had not exhibited this
pattern [18].
While coordinates are meant to provide relative distance
information, absolute coordinates matter too. One problem with
drift is that applications that use them often need to make
assumptions on maximum distances away from the ``true'' origin. For
example, one could use Hilbert functions to map coordinates into a
single dimension [5]. This requires an
a priori estimate of the maximum volume the coordinates may
fill up. Mapping functions like Hilbert require that the current
centroid not drift from the origin without bound. As Freedman et
al. note, a second, more practical problem with drift is that it
limits the amount of time that cached coordinates remain
useful [13].
A ``strawman'' solution to drift would be to continuously redefine the
origin as the centroid of the systems coordinate. Unfortunately, this
would require accurate statistical sampling of the coordinate
distribution and a reliable mechanism to advertise the current
centroid.
Our solution to drift is to apply a polynomially-increasing
gravity to coordinates as they become farther away from the
true origin. Gravity G is a force vector applied to the node's
coordinate  after each update: after each update:
where  tunes G so that its pull is a small fraction of
the expected diameter of the network. Hyperbolic coordinates could use a
similar equation to compute gravity. tunes G so that its pull is a small fraction of
the expected diameter of the network. Hyperbolic coordinates could use a
similar equation to compute gravity.
Table 1:
A small amount of gravity limits drift without preventing
coordinates from migrating to low-error positions.
| Gravity's rho |
Migration |
Pct. Error |
| 64 |
8ms |
25 |
| 256 |
17ms |
10 |
| 1024 |
74ms |
10 |
| 2048 |
163ms |
10 |
| None |
179ms |
10 |
|
Drift does not occur in simulation if one is using a
latency matrix and updating nodes randomly, because this form
of simulation does not capture time-dependent RTT variability.
Instead, we used a 24-hour trace of our PlanetLab service to
simulate the effect of gravity; we show the effect of different
strengths of gravity in Table 1. The data show
that this simple technique does, in fact, keep the coordinate centroid
highly stationary without affecting accuracy.
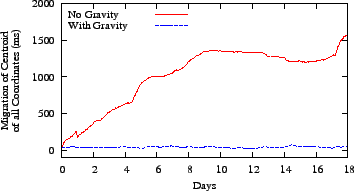
Figure 13:
With gravity, coordinates did not drift away from their
original origin as they had done before.
|
To confirm the effect of gravity on a live system, we added it to our
on-going PlanetLab service, which had approximately 300 participants.
In Figure 13, we compare drift before and
after adding gravity over two 18 day periods.
The data show that gravity effectively eliminates drift. In addition,
it did not reduce accuracy, which, in both cases, had a median of
about 10 percent.
While gravity does not actively limit rotation, we did not observe a
rate greater than one full rotation per three days.
Determining the cause of drift is beyond the scope of this work.
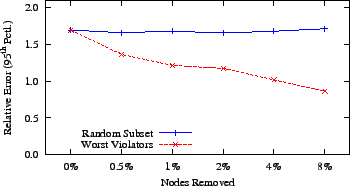
7.3 Intrinsic Error
Violations of the triangle inequality occur more frequently and to a
greater extent on Azureus than either on PlanetLab or for sets of DNS
servers (see Section 3.3).
We found, perhaps surprisingly, that removing
a small number of the worst violators causes a large improvement in
global accuracy. Not only do the violations these nodes take part in
damage their own coordinates, but the damage they cause continues to
reverberate throughout the system.
We performed an experiment where we removed a small percentage of the
nodes with the largest triangle violations from the Azureus latency
matrix and compared this to removing a random subset of nodes of the
same size. We then computed a system of coordinates and found
the relative error of each link. As Figure 14
illustrates, removing only the worst
0.5 percent
of nodes leads to a
20 percent
improvement in global accuracy.
This data parallels results from theoretical work that showed how to
decrease embedding distortion by sacrificing a small fraction of
distances to be arbitrarily distorted [2].
These results show that if a mechanism could prevent these
nodes from affecting the rest of the system, it would improve overall
accuracy.
Two example mechanisms for node self-detection and removal from the
coordinate system are:
(a) directly evolving an estimate of the extent of their violations by
asking neighbors for latencies to other neighbors,
and (b) determining if they are subject to traffic shaping (based on
the modality of their latency distribution), and therefore a major
cause of triangle violations.
Preliminary experiments with self-exclusion based on a simple
bimodality test show an improvement in accuracy of 8 percent at the
95th percentile.
Figure 14:
Removing only a small percentage of nodes with the worst
triangle violations has a large effect on global accuracy.
|
An insipid fact of running a large system where users can choose when
to upgrade is that not everyone is running the same version. One of
the problems we found with our original deployments was that about
13 percent of the remote coordinates received during gossip were at the
origin; that is, ![$[0]^d$](img45.png) . After much discussion (Is that incredible
churn rate possible? Do nodes behind firewalls never update their
coordinates?), we realized that this problem was due to a portion of
the network running an old code version. In fact, during one crawl of
the Azureus network, we found only about 44 percent of the approximately 9000
clients crawled were using the current version. While not very
exciting, realizing this fact allowed us to compensate for it both in
the coordinate update process and in active statistics collection
through the explicit handling of different versions within the code. . After much discussion (Is that incredible
churn rate possible? Do nodes behind firewalls never update their
coordinates?), we realized that this problem was due to a portion of
the network running an old code version. In fact, during one crawl of
the Azureus network, we found only about 44 percent of the approximately 9000
clients crawled were using the current version. While not very
exciting, realizing this fact allowed us to compensate for it both in
the coordinate update process and in active statistics collection
through the explicit handling of different versions within the code.
Kaafar et al. have begun investigating the more interesting side
of the problem of coordinate corruption: malicious
behavior [16]. They divide attacks into four
classes: disorder, isolation, free-riding, and landmark control.
While we did not see any evidence of intentionally corrupt messages,
it would be trivial to install a client, or a set of clients, that
responded with random values, for example (just as the MPAA runs
clients with spurious content advertisements to squelch piracy). As
Internet-scale coordinate systems come into wider use, they will need
to grapple with both oblivious and malicious corruption.
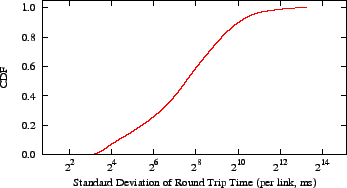
7.5 Latency Variance
Figure 15:
When round trip times vary by a median of 183ms,
what does it mean to summarize a latency prediction with a single value?
|
The prior ``barriers to accuracy'' paint a rosy picture; most
problems have a fairly simple solution that practitioners can use to
build more accurate, live coordinate systems. The existence of wide
variation in latency measurements between the same pair of nodes over
a short period of time is a harder problem with broad ramifications.
If variances are very large what does it actually mean to ``predict''
the latency from one node to another? Using the data from our
longest snapshot (5D), we show the standard deviation of latency between
each pair of nodes in Figure 15. This problem affects
other latency prediction systems as well.
A reactive measurement service,
such as Meridian, will be more error-prone or have higher overhead if
small numbers of pings do not sufficiently measure the latency to a high variance
target. In fact, coordinate systems may be in a better position to
address this problem because they can retain histories of inter-node
behavior.
As reviewed in Section 4.1, we developed latency
filters in previous work. They act as a low-pass filter: anomalies
are ignored while a baseline signal passes through. Additionally,
they adapt to shifts in the baseline that BGP route changes cause, for
example. These filters assign a link a single value that
conveys the expected latency of the link. While we found these simple
filters worked well on PlanetLab, describing a link with a single
value is not appropriate with the enormous variance we observe on some
of Azureus' links.
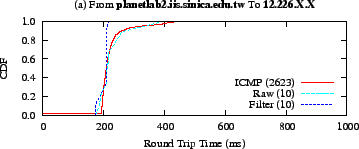
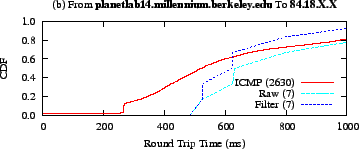
Figure 16:
A comparison of round trip times between two sets of node
pairs using ICMP, raw application-level measurements, and filtered
measurements. Pair (a) exhibits some variance, but shows a
consistent baseline.
|
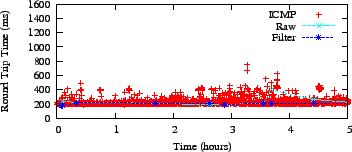
Figure 17:
With pair (b), the variance is so large that
assigning this node a coordinate -- or putting it into a consistent
Meridian ring -- is bound to be an error-prone process. The number
in parentheses in the legend is the number of round trip time
measurements in the cumulative distribution function.
|
We ran an experiment where we compared ICMP, filtered, and raw latency
measurements that were taken at the same time. To determine which
destination nodes to use, we started Azureus on three PlanetLab nodes
and chose five ping-able neighbors after a twenty-minute
start-up period. We then let Azureus continue to run
normally for six hours while simultaneously measuring the latency to
these nodes with ping. We plot the data in
Figures 16 and 17.
Figure 16 illustrates a pair similar to our
PlanetLab observations: there was raw application-level and ICMP
variance, but a consistent baseline that could be described with a
single value.
In contrast, Figure 17 portrays a high variance
pair: while the filter does approximate the median round trip time, it
is difficult to say, at any point in time, what the latency is between
this pair.
The impact of the dual problems of high latency variance and
modifying algorithms to deal with high latency variance is not limited
to network coordinate systems. Latency and anycast services
deployed ``in the wild'' need to address this problem. While there
may exist methods to incorporate this variance into coordinate systems
-- either through ``uncertainty'' in the latency filters or in the
coordinates themselves -- resolving this problem is beyond the scope
of this paper.
8 Related Work
Early work on latency prediction services focused on reducing the
intractability of all-pairs measurements through clustering. Based on
the assumption that nodes in the same cluster would have similar
latencies to nodes in another cluster, researchers examined how to
create accurate clusters and how to minimize inter- and intra-cluster
measurement overhead.
Francis et al. created clusters based on IP address prefixes, but found
that prediction error was heavily dependent on the initial choice of
representatives [12].
Chen et al. addressed this problem through the automatic formation of
clusters and representatives; they found the cluster size and, more
generally, the amenability of the network to clustering had a large
effect on accuracy [6].
Ratnasamy et al. proposed a hybrid approach: nodes that are similar
distances away from fixed landmarks place themselves into the same
cluster; they also found error was highly dependent on the number of
bins [26].
Because all of this clustering involves measurement and lower network
layers are already performing much of this measurement, Nakao et al.
proposed reducing overhead by tapping into this existing information;
unfortunately, this requires a change in the interface of
Internet routers [21].
While this research and the work on network coordinates that grew out
of it focus on generalized latency prediction --
maintaining an infrastructure that works well for most queries -- a
separate body of work has focused more directly on the problem of
finding the nearest of many replicated services.
In direct response to an application-level request, Meridian finds the
nearest overlay node (i.e., one running Meridian) to an arbitrary point
in the Internet through a set of pings that progress
logarithmically closer to the target [32].
Freedman et al. developed OASIS, a distributed service
explicitly designed to help clients find and choose a ``good'' server
out of many [13]. Building on Meridian, OASIS
primarily focuses on network locality, but also incorporates liveness
and load. OASIS employs a reliable core of hosts to map clients to
nearby servers, which are assumed to be long-lived.
Note the distinct purposes of these anycast services from those of
network coordinates: Meridian and OASIS are designed for the case
where contact with the service will be frequent and long-lived enough
to outweigh the high upfront cost of finding the best service. With
their current levels of accuracy (good but not perfect) and
maintenance (zero), network coordinates fall to the other side of the
trade-off: short-lived, cheap decisions for which finding the exact
answer is not worthwhile, but repeatedly finding a good answer leads
to aggregate savings.
While Meridian (and OASIS) are inherently reactive - acting in
response to a query - they too could be more tightly integrated with
an application, using its messages to dampen ring maintenance, for example.
8.1 Network Coordinates
There exist two main classes of algorithms for calculating coordinates:
landmark-based schemes, in which overlay
nodes use a fixed number of landmark nodes to calculate their coordinates, and
simulation-based schemes, which are decentralized and calculate
coordinates by modeling nodes as entities in a physical system.
Landmark-based.
In GNP [22], nodes contact multiple landmark nodes
to triangulate their coordinates. The drawbacks of this approach are that the
accuracy of the coordinates depends on the choice of landmark nodes and
landmark nodes may become a bottleneck.
Lighthouses [24] addresses this by supporting
multiple independent sets of landmarks with their own coordinate systems. These
local coordinates map into a global coordinate system.
PIC [8] does not use explicit landmarks, incorporating
measurements to any node using a simplex optimization algorithm to obtain an
up-to-date coordinate.
These landmark-based schemes require a reasonably stable
infrastructure and, to the best of our knowledge, have not been
adopted for wide-spread use.
Simulation-based.
Vivaldi [9] and Big Bang
Simulation [27] determine coordinates using
spring-relaxation and force-field simulation, respectively. In both,
nodes attract and repel each other according to network distance
measurements. The low-energy state of the physical system corresponds
to the coordinates with minimum error.
de Launois et al. propose
a different method for stabilizing coordinates:
asymptotically dampening the effect of each
new Vivaldi measurement [10]. While this factor does
mitigate oscillations in a fixed network, it prevents the algorithm
from adapting to changing network conditions.
9 Conclusion
We have demonstrated that network coordinates in the wild do behave
somewhat differently than do tame coordinates on PlanetLab or in
simulation.
Fortunately, even these wild coordinates can be tamed.
Our analysis of a large, Internet-scale coordinate system has
convinced us to join the network coordinate supporters camp. While
the initial network coordinate implementation illustrated some of the
problems that critics often cite, we found that simple, but effective
techniques overcame nearly all these issues. In Azureus, network
coordinates provide a simple and efficient mechanism for anycast, as
part of DHT lookups, and may soon be used to optimize streaming media.
In addition to providing a wealth of data and analysis from a live,
large-scale deployment, we have deployed and evaluated six techniques
that improve the accuracy and/or stability of network coordinate
systems: latency filters, update filters, neighbor decay, coordinate
memory, gravity, and violator exclusion.
Together, these yield efficient, accurate, and stable network
coordinates in the million-node Azureus network.
In the future, we plan to add the remaining techniques to the Azureus
code and monitor their effectiveness.
We wish to thank Peter Pietzuch for early discussions on the myriad
potential reasons for the discrepancy between simulated and real
network coordinates, Olivier Chalouhi
of Aelitis
for allowing us to tinker with the Azureus source code, and
Michael Parker of UCLA for putting us in touch with Aelitis and for
porting our implementation to Java.
In addition, we wish to thank our anonymous reviewers and our shepherd,
Emin Gün Sirer, who provided extremely detailed constructive criticism.
- 1
-
Azureus BitTorrent Client.
https://azureus.sourceforce.net/.
- 2
-
Y. Bartal, N. Linial, M. Mendel, and A. Naor.
On metric ramsey-type phenomena.
In Proc. of Symposium on Theory of Computing, San Diego, CA,
2003.
- 3
-
R. Bindal, P. Cao, W. Chan, J. Medved, G. Suwala, T. Bates, and A. Zhang.
Improving traffic locality in bittorrent via biased neighbor
selection.
In Proc. of International Conference on Distributed Computing
Systems, Lisbon, Portugal, July 2006.
- 4
-
F. Bustamante and Y. Qiao.
Friendships that last: Peer lifespan and its role in P2P protocols.
In Proc. of International Workshop on Web Content Caching and
Distribution, Hawthorne, NY, October 2003.
- 5
-
A. R. Butz.
Alternative Algorithm for Hilbert's Space-Filling Curve.
IEEE Transactions on Computers, pages 424-426, April 1971.
- 6
-
Y. Chen, K. H. Lim, R. H. Katz, and C. Overton.
On the Stability of Network Distance Estimation.
SIGMETRICS Performance Evaluation Review, 30(2), 2002.
- 7
-
B. Cohen.
Incentives Build Robustness in BitTorrent.
In Proc. of Workshop on Economics of Peer-to-Peer Systems,
Berkeley, CA, June 2003.
- 8
-
M. Costa, M. Castro, A. Rowstron, and P. Key.
PIC: Practical Internet Coordinates for Distance Estimation.
In Proc. of International Conference on Distributed Computing
Systems, Tokyo, Japan, March 2004.
- 9
-
F. Dabek, R. Cox, F. Kaashoek, and R. Morris.
Vivaldi: A Decentralized Network Coordinate System.
In Proc. of SIGCOMM, Aug. 2004.
- 10
-
C. de Launois, S. Uhlig, and O. Bonaventure.
A Stable and Distributed Network Coordinate System.
Technical report, Universite Catholique de Louvain, December 2004.
- 11
-
J. Dilley, B. Maggs, J. Parikh, H. Prokop, R. Sitaraman, and B. Weihl.
Globally Distributed Content Delivery.
IEEE Internet Computing, September/October 2002.
- 12
-
P. Francis, S. Jamin, C. Jin, Y. Jin, D. Raz, Y. Shavitt, and L. Zhang.
IDMaps: a global internet host distance estimation service.
IEEE/ACM Trans. Networking, 9(5), 2001.
- 13
-
M. Freedman, K. Lakshminarayanan, and D. Mazières.
OASIS: Anycast for Any Service.
In Proc. of the Symposium on Networked Systems Design and
Implementation, San Jose, CA, May 2006.
- 14
-
K. P. Gummadi, S. Saroiu, and S. D. Gribble.
King: Estimating Latency between Arbitrary Internet End Hosts.
In Proc. of Internet Measurement Workshop, Marseille, France,
Nov. 2002.
- 15
-
J. Jannotti, D. K. Gifford, K. L. Johnson, et al.
Overcast: Reliable Multicasting with an Overlay Network.
In Proc. of Symposium on Operating Systems Design and
Implementation, San Diego, CA, Oct. 2000.
- 16
-
M. A. Kaafar, L. Mathy, T. Turletti, and W. Dabbous.
Virtual Networks under Attack: Disrupting Internet Coordinate
Systems.
In Proc. of Second CoNext Conference, Lisbon, Portugal, 2006.
- 17
-
J. Ledlie, P. Gardner, and M. Seltzer.
Network Coordinates in the Wild.
Technical Report TR-20-06, Harvard University, Cambridge, MA, Oct.
2006.
- 18
-
J. Ledlie, P. Pietzuch, and M. Seltzer.
Stable and Accurate Network Coordinates.
In Proc. of International Conference on Distributed Computing
Systems, Lisbon, Portugal, July 2006.
- 19
-
C. Lumezanu and N. Spring.
Playing Vivaldi in Hyperbolic Space.
Technical Report 4843, University of Maryland at College Park, Nov.
2006.
- 20
-
P. Maymounkov and D. Mazières.
Kademlia: A peer-to-peer information system based on the xor metric.
In Proc. of International Workshop on Peer-to-Peer Systems,
Cambridge, MA, March 2002.
- 21
-
A. Nakao, L. Peterson, and A. Bavier.
A Routing Underlay for Overlay Networks.
In Proc. of SIGCOMM, Karlsruhe, Germany, Aug. 2003.
- 22
-
T. S. E. Ng and H. Zhang.
Predicting Internet Network Distance with Coordinates-Based
Approaches.
In Proc. of INFOCOM, June 2002.
- 23
-
L. Peterson, T. Anderson, D. Culler, and T. Roscoe.
A Blueprint for Introducing Disruptive Technology into the
Internet.
In Proc. of Workshop on Hot Topics in Networks, Princeton,
New Jersey, October 2002.
- 24
-
M. Pias, J. Crowcroft, S. Wilbur, T. Harris, and S. Bhatti.
Lighthouses for Scalable Distributed Location.
In Proc. of International Workshop on Peer-to-Peer Systems,
Berkeley, CA, February 2003.
- 25
-
P. Pietzuch, J. Ledlie, J. Shneidman, M. Welsh, M. Seltzer, and
M. Roussopoulos.
Network-Aware Operator Placement for Stream-Processing Systems.
In Proc. of International Conference on Data Engineering,
Atlanta, GA, April 2006.
- 26
-
S. Ratnasamy, P. Francis, M. Handley, B. Karp, and S. Shenker.
Topology-Aware Overlay Construction and Server Selection.
In Proc. of INFOCOM, June 2002.
- 27
-
Y. Shavitt and T. Tankel.
Big-Bang Simulation for embedding network distances in Euclidean
space.
In Proc. of INFOCOM, San Francisco, CA, June 2003.
- 28
-
Y. Shavitt and T. Tankel.
On the Curvature of the Internet and its usage for Overlay
Construction and Distance Estimation.
In INFOCOM, Hong Kong, June 2004.
- 29
-
N. Spring, D. Wetherall, and T. Anderson.
Scriptroute: A Public Internet Measurement Facility.
In Proc. of the Symposium on Internet Technolgies and Systems,
Seattle, WA, Mar. 2003.
- 30
-
I. Stoica, R. Morris, D. Karger, M. F. Kaashoek, and H. Balakrishnan.
Chord: A Scalable Peer-to-peer Lookup Service for Internet
Applications.
In Proc. of SIGCOMM, San Diego, CA, Aug. 2001.
- 31
-
L. Tang and M. Crovella.
Virtual Landmarks for the Internet.
In Proc. of Internet Measurement Conference, Oct. 2003.
- 32
-
B. Wong, A. Slivkins, and E. G. Sirer.
Meridian: A Lightweight Network Location Service without Virtual
Coordinates.
In Proc. of SIGCOMM, Aug. 2005.
- 33
-
R. Zhang, Y. C. Hu, X. Lin, and S. Fahmy.
A Hierarchical Approach to Internet Distance PredictionStable and
Accurate Network Coordinates.
In Proc. of International Conference on Distributed Computing
Systems, Lisbon, Portugal, July 2006.
- 34
-
H. Zheng, E. K. Lua, M. Pias, and T. G. Griffin.
Internet Routing Policies and Round-Trip-Times.
In Proc. of Passive and Active Measurement Workshop, Mar. 2005.
Network Coordinates in the Wild
This document was generated using the
LaTeX2HTML translator Version 2002-2-1 (1.71)
Copyright © 1993, 1994, 1995, 1996,
Nikos Drakos,
Computer Based Learning Unit, University of Leeds.
Copyright © 1997, 1998, 1999,
Ross Moore,
Mathematics Department, Macquarie University, Sydney.
The command line arguments were:
latex2html -split 0 -show_section_numbers -local_icons wild-web.tex
The translation was initiated by Jonathan Ledlie on 2007-02-23
Jonathan Ledlie
2007-02-23
|