In this section, we answer the question: What bandwidth guarantees are realizable on a virtual link?
Recall that the statistical bandwidth guarantee achievable along a
virtual link is given by ![]() such that
such that
![]() ,
where
,
where ![]() represents the instantaneous bandwidth along the virtual
link, and
represents the instantaneous bandwidth along the virtual
link, and ![]() represents the probability with which the guarantee is
not met. The Rate Estimator module updates
represents the probability with which the guarantee is
not met. The Rate Estimator module updates ![]() once every window of
packets (
once every window of
packets (![]() (RTT) sec) based on the feedback information received from
the next OverQoS hop.
(RTT) sec) based on the feedback information received from
the next OverQoS hop.
|
Across the ![]() pairs of nodes between the 19 end-hosts in our
testbed, we monitored
pairs of nodes between the 19 end-hosts in our
testbed, we monitored ![]() unique virtual links over a period of 7
working days. Figures 8(a) and (b) show the distribution
of
unique virtual links over a period of 7
working days. Figures 8(a) and (b) show the distribution
of ![]() for
for ![]() and
and ![]() . We make two
observations. First, the value of
. We make two
observations. First, the value of ![]() is greater than
is greater than ![]() Kbps
for more than
Kbps
for more than ![]() of the links.
of the links. ![]() of the links are
predominantly connected to broadband hosts. Second, in many cases,
of the links are
predominantly connected to broadband hosts. Second, in many cases,
![]() is at least
is at least ![]() of the average throughput along the
virtual link. In specific cases,
of the average throughput along the
virtual link. In specific cases, ![]() is as large as
is as large as ![]() of
the average throughput. The median value of
of
the average throughput. The median value of
![]() is
is ![]() and
and ![]() for
for ![]() and
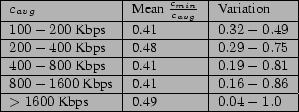
and ![]() respectively. Figure 9 shows the variation of
respectively. Figure 9 shows the variation of
![]() as a function of
as a function of ![]() . As
. As ![]() increases,
we notice that the maximum value of
increases,
we notice that the maximum value of
![]() increases while
the minimum value decreases. The minimum decreases because we notice
self-induced losses across some of the links thereby causing
MulTCP to drastically reduce its sending rate and thereby reducing
increases while
the minimum value decreases. The minimum decreases because we notice
self-induced losses across some of the links thereby causing
MulTCP to drastically reduce its sending rate and thereby reducing
![]() .
.
Stability of ![]() : If the underlying distribution of
: If the underlying distribution of ![]() is
stable, the estimated value of
is
stable, the estimated value of ![]() will roughly be a constant.
However under dynamic conditions, we need to continuously re-estimate
will roughly be a constant.
However under dynamic conditions, we need to continuously re-estimate
![]() and flows need to renegotiate their bandwidth
reservations. For a given value of
and flows need to renegotiate their bandwidth
reservations. For a given value of ![]() , we estimate
, we estimate ![]() using
using
![]() samples of
samples of ![]() . As an example, given
. As an example, given ![]() msec and
msec and
![]() , we can calculate
, we can calculate ![]() based on the last
based on the last ![]() samples (representing a history of 200 seconds). In this scenario,
flows renegotiate their bandwidth requirements every few minutes.
samples (representing a history of 200 seconds). In this scenario,
flows renegotiate their bandwidth requirements every few minutes.
Figure 8(c) shows the variation as a function of time
across four separate virtual links from Europe to North America. We
make two observations: First, the value of ![]() is very stable
compared to variations in the available bandwidth,
is very stable
compared to variations in the available bandwidth, ![]() . Across these
links,
. Across these
links, ![]() does not deviate more than
does not deviate more than ![]() around its mean
value. Second, an on-line algorithm for estimating
around its mean
value. Second, an on-line algorithm for estimating ![]() based on
past history is a reasonable approach. While we set
based on
past history is a reasonable approach. While we set
![]() to
be
to
be ![]() , the actual value of
, the actual value of ![]() is less than the estimated
is less than the estimated ![]() in no more than
in no more than ![]() of the cases across all four virtual links.
of the cases across all four virtual links.
![\includegraphics[width=2.2in,height=1.6in]{figures/guarbw.eps}](img118.png)
![\includegraphics[width=2.2in,height=1.6in]{figures/cminvscavg.eps}](img119.png)
![\includegraphics[width=2.2in,height=1.6in]{figures/cminstab.eps}](img120.png)