|
NSDI '04 Paper
[NSDI '04 Technical Program]
Path-Based Failure and Evolution Management
Mike Y. Chen, Anthony Accardi, Emre K c man, Jim Lloyd, Dave Patterson, Armando Fox, Eric Brewer
UC Berkeley, TellmeNetworks, Stanford University, eBay Inc.
{mikechen, patterson, brewer}@cs.berkeley.edu, anthony@tellme.com, {emrek, fox}@cs.stanford.edu, jlloyd@ebay.com
Abstract
We present a new approach to managing failures and evolution in large,
complex distributed systems using runtime paths. We use the paths that
requests follow as they move through the system as our core abstraction, and
our "macro" approach focuses on component interactions
rather than the details of the components themselves. Paths record
component performance and interactions, are user- and
request-centric, and occur in sufficient volume to enable statistical
analysis, all in a way that is easily reusable across applications.
Automated statistical analysis of multiple paths allows for the detection
and diagnosis of complex failures and the assessment of evolution issues. In particular, our
approach enables significantly stronger capabilities in failure
detection, failure diagnosis, impact analysis, and understanding
system evolution. We explore these capabilities with three real
implementations, two of which service millions of requests per day. Our
contributions include the approach; the maintainable, extensible, and
reusable architecture; the various statistical analysis engines; and the
discussion of our experience with a high-volume
production service over several years.
1 Introduction
| Path Framework | Site | Description | Physical Tiers | # of Machines | Live Requests | Apps Hosted | |
| Pinpoint | - | research prototype | 2-3 | - | - | Java |
| ObsLogs | Tellme | enterprise voice application network | - | hundreds | millions/day | VoiceXML[55] |
| SuperCal | eBay | online auction | 2-3 | thousands | millions/day | C++, Java |
Table 1: A comparison of three systems that support path-based analysis.
The rise of large, highly available, networked systems
[10,26] reinforces a trend towards complex,
heterogeneous architectures composed of distributed, replicated
components. Such systems may be built from thousands of machines,
each running a diverse set of software components that exhibit
complicated interactions [18,23]. This trend
undermines basic system management tasks, from detecting and diagnosing
failures to understanding current and future system behavior.
Although there are many tools for dealing with individual components,
such tools are less effective in understanding aggregate system
behavior, and worse, lose sight of the impact of specific
components on the user experience.
Existing monitoring and debugging techniques use tools such as
code-level debuggers, program slicing [53], code-level and process
profiling [22,31,42], and application-level logs.
Although these techniques provide valuable information about
individual components, this localized knowledge fails to capture the
component interactions that characterize the overall system behavior
and determine the user experience. Although some tools, such as
distributed debuggers, cover multiple components, they focus on a
homogeneous subset of the system and usually consider one node at a
time. Some such tools require additional component
knowledge, which may be difficult to obtain for "black box"
components.
Our goal is to design tools that help us understand large
distributed systems to improve their availability, reliability, and manageability.
We trace paths from user requests,
through distributed black-box components, until service completes.
Examples include the request/response interaction in
Internet systems and one-way flows in messaging systems.
We apply statistical techniques to the
data collected along these paths to infer system behavior.
We draw on two main principles:
- Path-Based Measurement:
- We model the target system as a collection
of paths through abstract, black-box, heterogeneous components. Local
observations are made along these paths, which are later accessed via query
and visualization mechanisms.
- Statistical Behavior Analysis:
- Large volumes of system requests
are amenable to statistical analysis. We use classical techniques to
automatically identify statistically significant deviations from
normal behavior for both performance and correctness, and for both
live system operation and off-line analysis.
The path abstraction has been used in many other areas, typically as a
form of control flow. Paths are used in Scout for a single-node OS
[38], are the foundation for integrated-layer-processing
[1], and play a key role in many compiler optimization
techniques [5]. Several recent systems have also
used paths to profile distributed systems. Magpie [7]
and WebMon [49] both trace web requests across multi-tiered
web systems for performance tuning and diagnosis. Aguilera et al.
present both statistical and message-by-message algorithms to infer
causal paths and thereby debug performance problems in distributed
systems of black boxes [3].
Our use of paths is novel in that we focus on correctness rather than
performance. We use paths to detect and diagnose failures, and to understand
the evolution of a system. Although we
have also applied paths to profile the performance of two large
production services, this work is less novel and we omit it for space.
We stress that our "macro" approach [12], where we focus on
component-level abstractions over component details,
complements and does not replace traditional component-oriented systems approaches.
We often use such tools to flesh out issues identified via macro analysis. For example,
our failure diagnosis typically can determine the specific requests
and component(s) involved in a failure, but resolving the actual
cause may require looking at source code or component logs.
In this paper we apply path-based macro analysis to two broad classes
of tasks encountered with large, distributed systems:
failure management and evolution.
Failure Management consists of the full process of detection, diagnosis, and repair of hardware and software failures. Paths help with three tasks in particular:
- Detection:
- Failures can result in unplanned downtime, and
failure detection remains a hard problem, especially at the application
level. Tellme Networks, one of the two commercial sites we have
analyzed, estimates that roughly 75% of application-level failure
recovery time is spent on detection. The difficulty is that overt
symptoms caused by abnormal component behavior or bad component
interactions may only be visible to the user. However, such problems can
impact path structure in many ways, affecting control flow, path latency
profiles, and user behavior. Using paths, we can reduce failure
detection time and notice developing problems before the
consequences become more severe. The key approach is to define
"normal" behavior statistically, and then to detect statistically
significant deviations.
- Diagnosis:
- Traditionally, once a failure is reported,
engineers attempt to reproduce the problem with a simulated workload and
verbose logging enabled, and proceed to correlate events in logs
on different machines to reconstruct the failure timeline. Our approach
differs in that our goal is to isolate problems using solely the recorded
path observations, and to subsequently drive the diagnosis process with
this path context. This works because correlations across the large
number of paths that traverse the system imply which components and
requests are involved (and not involved!) in a given failure scenario.
This typically requires only a few queries once a
failure is detected, and allows us to quickly identify and rank probable
root causes. We can also "trap" errors by increasing the amount of detailed logging for
isolated components in a live system.
- Impact Analysis:
- After a problem is diagnosed, we would like to
understand the impact that it had on users. In this case, we are
estimating how many paths have the same profile as the faulty path.
Knowing the scale of the problem allows us to prioritize the
solution. In the case of failures that affect a Service-Level
Agreement (SLA), such as an error in an ad server, impact analysis
allows us estimate the damage and determine compensation.
Evolution is challenging for these systems because it is
very difficult to replicate the precise timing and behavior of the production system.
Thus most upgrades are rolled out in stages to a live system after
extensive testing on a
smaller "test system" with a simulated load. Systems evolve through
both changes to their components and changes in how they interact.
Paths help by revealing the actual system structure and dependencies,
and tracking how they change. More importantly, our statistical
approach allows us to simultaneously detect a wide range of
performance and correctness issues across system versions. For each
statistically significant change, we can drill down to understand the
requests and components affected. This allows for both the validation
of expected changes as well as the detection and diagnosis of
unexpected changes.
We present our evaluation of path-based analysis on three
implementations, summarized in Table 1.
- Pinpoint
- is an analysis framework for an open-source, 3-tier Java 2
Enterprise Edition (J2EE) [47]
application platform, JBoss [30].
- ObsLogs
- are part of a path-based
infrastructure at Tellme Networks, an enterprise voice application network.
- SuperCal
-
is the logging infrastructure at eBay, an online auction site.
eBayand Tellmeare geo-redundant systems.
We believe, but do not show, that paths apply equally well to wide-area distributed
systems, including peer-to-peer networks and sensor networks.
The primary limitation of our approach is the need
to aggregate the logs for analysis (described in the next two sections),
as we do not present a wide-area distributed query system.
For our purposes, JBoss, eBay, and Tellme's networkcan be considered cluster-based application servers that provide
a platform upon which applications are developed and run. Legacy
applications can take advantage of our path-based tools without modification.
Although Pinpointis a research prototype, Tellme's real-time, geo-redundant system has
serviced many billions of requests since the end of 2001, when ObsLogs(short
for Observation Logs) were deployed. eBayservices hundreds of millions of requests a day, all
of which are monitored using SuperCal, producing hundreds of gigabytes of compressed
SuperCallogs.
We will describe our analysis framework before presenting our two main applications: failure management and evolution.
In Section 2 we explain our path analysis architecture.
We describe relevant
implementation details
in Section 3.
In Section 4, we
detect failures based on deviations in path structure and interval
distributions, show how to accurately and quickly diagnose
such failures, and gauge their importance via impact analysis.
We show how to evolve the system by
deducing structure and regressing changes across system and application versions in
Section 5. Finally, we discuss lessons learned in Section 6, and
related work in Section 7.
2 Design
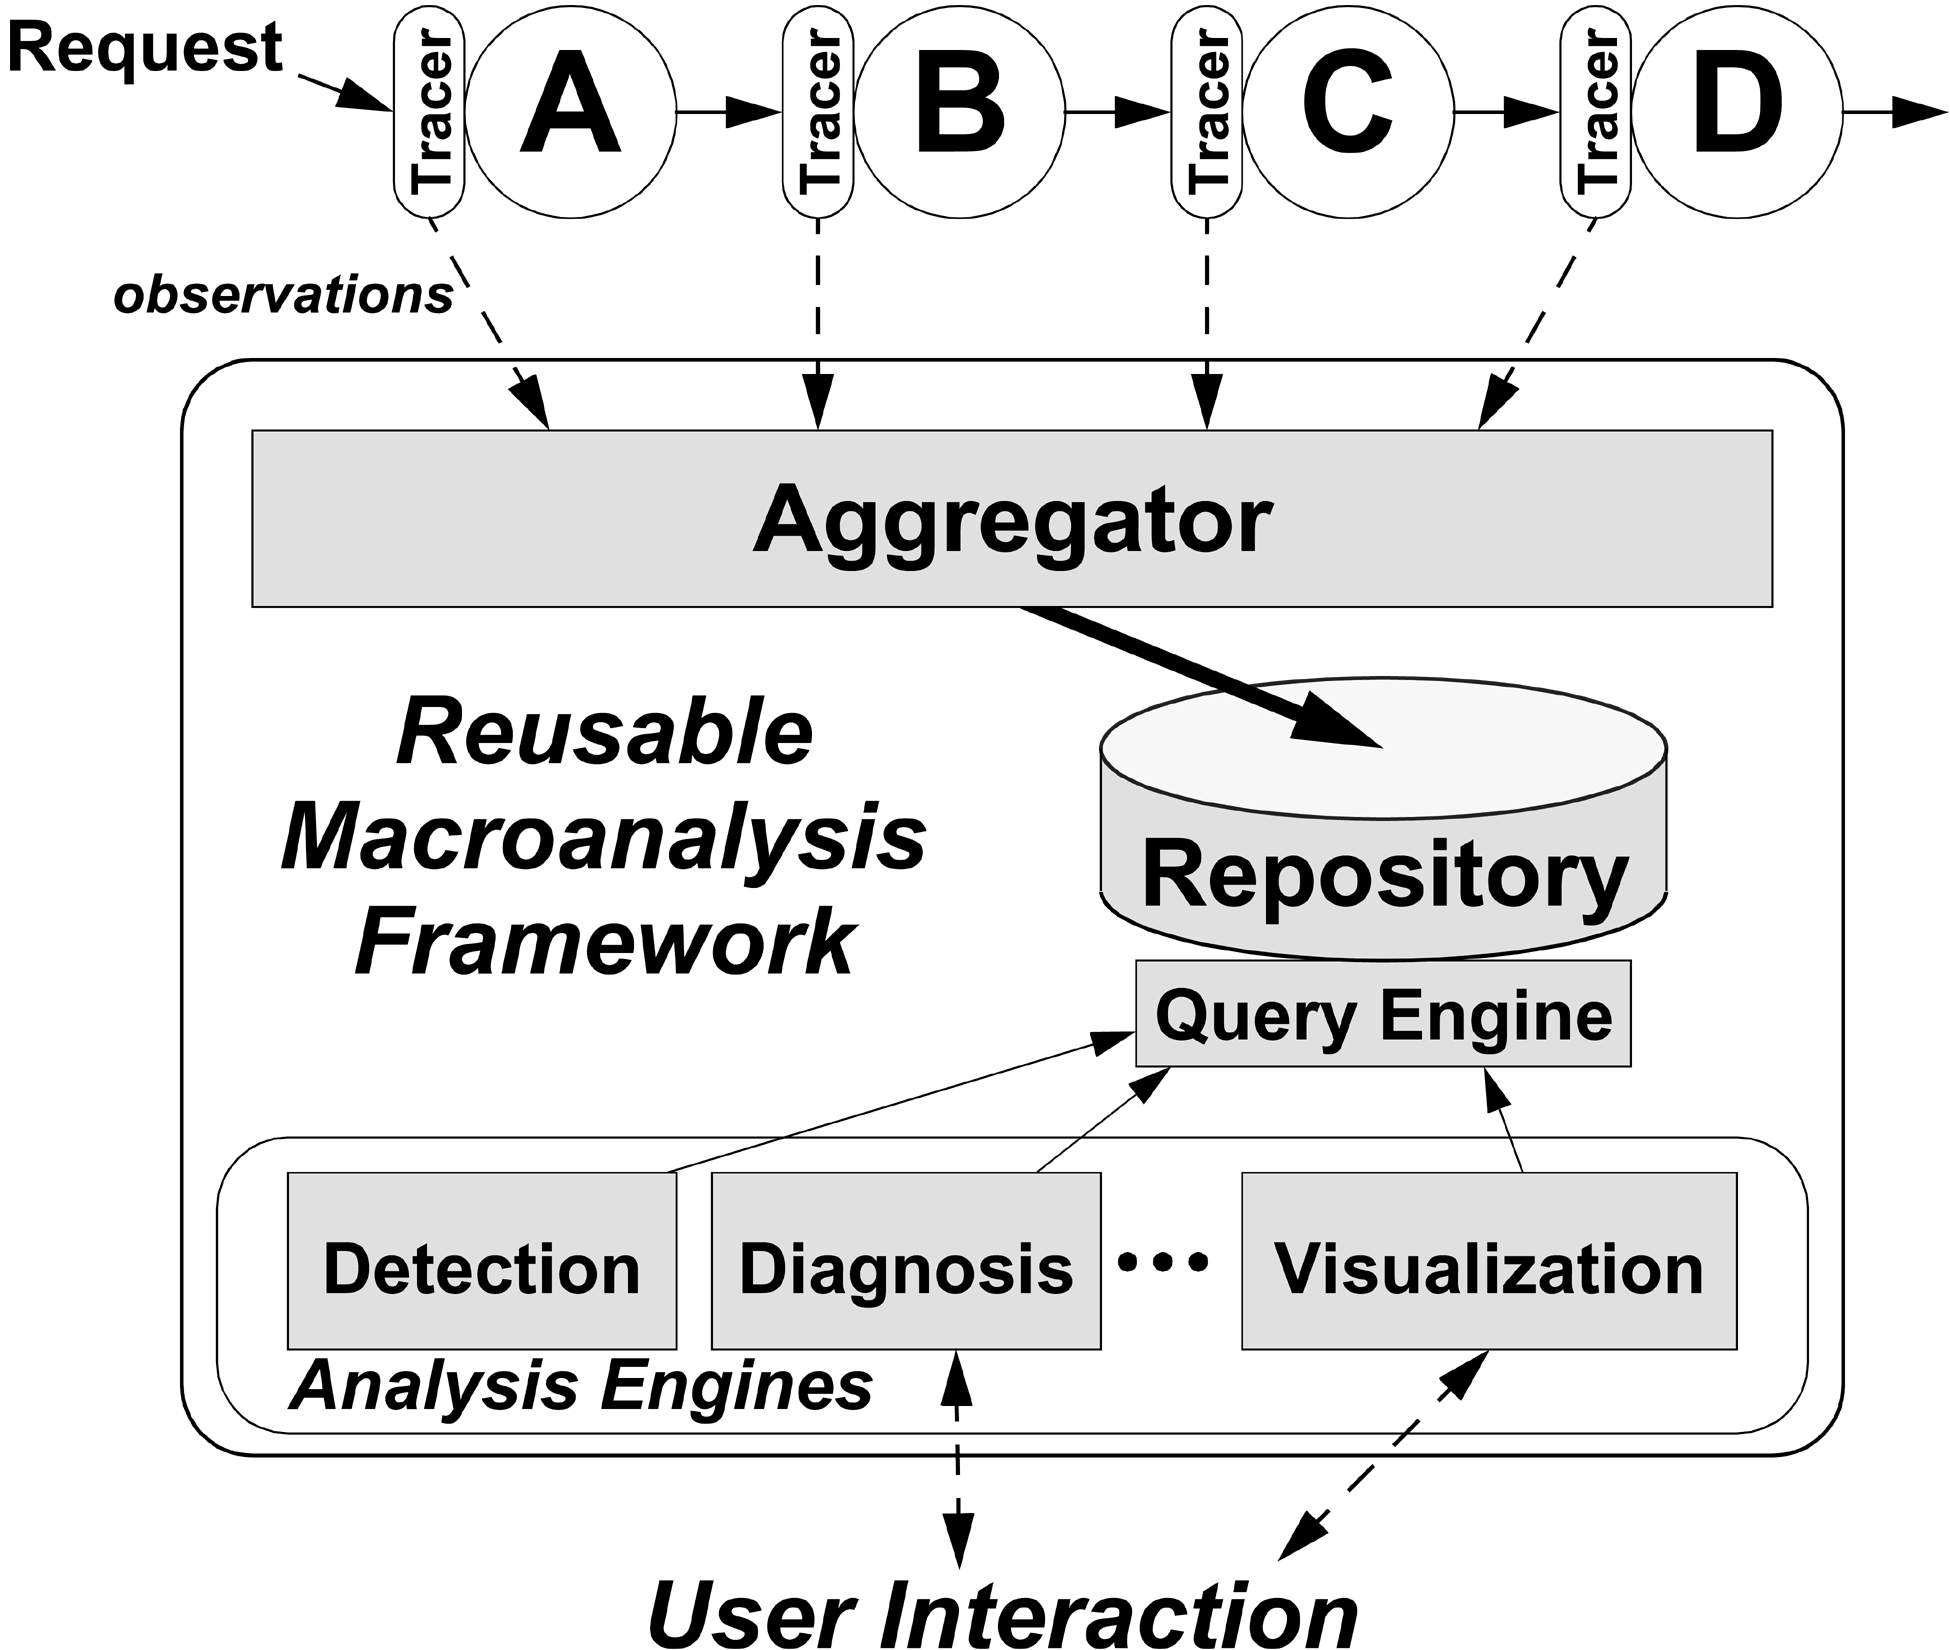 Figure 1: Path-based analysis
architecture, illustrating the collection of observations
from Tracers via the Aggregator for storage in the
Repository. Various Analysis Engines
perform statistical or visual analyses of path data via the
Query Engine.
Our primary architectural goals are to enable path-based measurement for a
variety of systems and to decouple the recording, storage, and analysis
functionality, so that these subsystems may scale and evolve independently.
Because we are interested in real failures,
the framework must be feasible to use on a live system.
In a path-based implementation, a path is a collection of observations,
which are local, discrete system measurements at particular points during
the system's response to a request. Example observations include
timestamps, component and host names, and version numbers. The
observations are recorded by Tracers, shown in Figure 1,
and the path data is aggregated, stored, and analyzed statistically or
visualized. After defining paths, we describe the main modules of Figure
1 in more detail.
Figure 1: Path-based analysis
architecture, illustrating the collection of observations
from Tracers via the Aggregator for storage in the
Repository. Various Analysis Engines
perform statistical or visual analyses of path data via the
Query Engine.
Our primary architectural goals are to enable path-based measurement for a
variety of systems and to decouple the recording, storage, and analysis
functionality, so that these subsystems may scale and evolve independently.
Because we are interested in real failures,
the framework must be feasible to use on a live system.
In a path-based implementation, a path is a collection of observations,
which are local, discrete system measurements at particular points during
the system's response to a request. Example observations include
timestamps, component and host names, and version numbers. The
observations are recorded by Tracers, shown in Figure 1,
and the path data is aggregated, stored, and analyzed statistically or
visualized. After defining paths, we describe the main modules of Figure
1 in more detail.
2.1 Defining Paths
A path embodies the control flow, resources, and performance characteristics
associated with servicing a request. We use the term "request" in a
broad sense for whenever any external entity asks the system to perform
some action. The request may result in a response delivered back
(e.g., HTTP) or in some action with remote consequences
(e.g., UDP packets). Paths may have inter-path dependencies
through shared state or resources such as database tables, file
systems, or shared memory.
Multiple paths are often grouped together in sessions, just as a
user's requests collectively contribute to a higher-level goal.
Multiple stateless HTTP requests may be tied together with a
cookie containing a session ID. For P2P systems, a lookup session may contain several one-way
message paths, including queries and result delivery. On Tellme's network, a
phone call is a session.
Pinpointand SuperCaluse the natural definition of a path for web services:
a web server's response to an HTTP request.
The Tellmesystem paths, shown in Figure 2, need more explanation.
VoiceXML end users call a phone number, interact with the system via
speech and touch-tone, and ultimately end their call by hanging up or
transferring to another number. The user is usually undertaking
a high-level application-specific task, such as retrieving driving directions or placing stock trades.
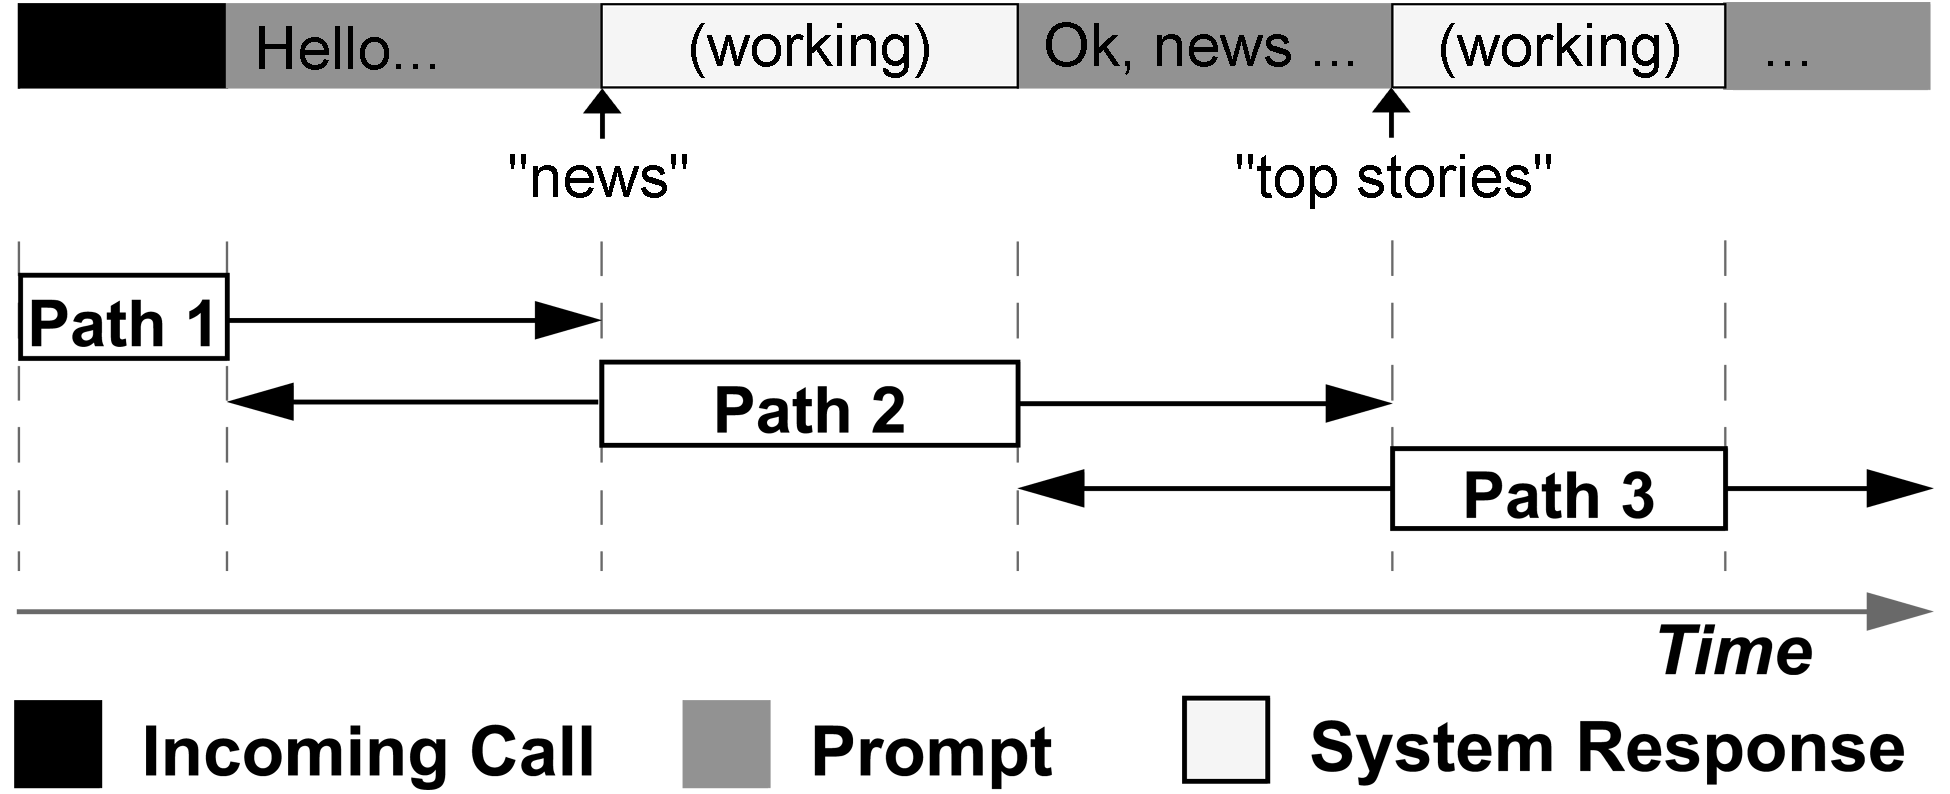 Figure 2: Breaking down a phone call into overlapping paths:
each box represents the logical extent of the path, while arrows illustrate
the actual range of observations. After connecting, the user says
"news", and then later "top stories".
A request-response interaction occurs whenever the user waits for the
system to respond. Since the behavior of these response paths directly
characterizes a user's experience with the system, and serves as a
foundation upon which successful applications can be built, understanding
this behavior is extremely important. We thus define paths in
Tellme's networkas originating when a user provides input and ending when
the system responds. For example, a user initiates a path by speaking and
ends when they hear an aural response. For completeness, we also record
path information past these logical endpoints, as shown in Figure
2.
Figure 2: Breaking down a phone call into overlapping paths:
each box represents the logical extent of the path, while arrows illustrate
the actual range of observations. After connecting, the user says
"news", and then later "top stories".
A request-response interaction occurs whenever the user waits for the
system to respond. Since the behavior of these response paths directly
characterizes a user's experience with the system, and serves as a
foundation upon which successful applications can be built, understanding
this behavior is extremely important. We thus define paths in
Tellme's networkas originating when a user provides input and ending when
the system responds. For example, a user initiates a path by speaking and
ends when they hear an aural response. For completeness, we also record
path information past these logical endpoints, as shown in Figure
2.
3 Implementation
We describe our path-based macro analysis implementations,
organized by the subsystems shown in Figure 1.
3.1 Tracers
Tracers are responsible for tracking a request through the target system
and recording any observations made along the way. Our approach is to
associate each request with a unique identifier at the system entry point,
and to maintain this association throughout. This
is similar to Magpie [7] and WebMon, although our tracers record
additional information such as resource dependencies and version numbers
for failure analysis. We do not record all low-level resources,
such as the network packets that Magpie tracks. Although paths may be inferred
without them [3,36], explicit path identifies
are essential in linking specific observations with specific failures.
We require that the request identifier be accessible from all areas of
the platform that make observations.
If threads process requests one at a time, storing IDs in
thread-local storage is an attractive option.
If
protocols with extensible headers are used, such as HTTP or SOAP, we can
add the ID as part of a header. Failing that, we can modify the existing
protocols, interfaces, class members, etc., so that the request ID follows
the control flow.
Alternatively, the entire path state, including the ID and all recorded observations,
can be threaded through the system. This
simplifies observation aggregation, but there is overhead in
moving observations through component boundaries. To optimize
performance, we use both techniques: the entire path state where shared
memory is available, and just the request ID otherwise.
Although Tracers are platform-specific, they can remain
application-generic for platforms that host application components
(e.g., J2EE, .NET [35]).
This can be done by monitoring requests at application component
boundaries, or, more generally, by recording platform-internal notions
of content (e.g., URLs, module names, function symbols) along paths.
Pinpoint, ObsLogs, and SuperCalall have platform Tracers to
enable monitoring for all applications, without
modification. We also provide
interfaces for application developers to insert their own data, such as
data hashes and references to other data sources,
so that in the extreme case, all system logging may be done via paths.
We modified the Jetty web server to generate a unique ID for each
HTTP request. Because Jetty is integrated with JBoss in the same JVM and
has a simple threading model, we use Java's ThreadLocal class to store
request IDs. When the server invokes a remote Enterprise Java
Bean (EJB), our modified Remote Method Invocation
protocol passes the ID transparently to the target EJB.
We augmented the Java Server Pages (JSP), Servlets, EJB containers,
and JDBC driver to report observations on component and database usage.
These observation points report the names of the application component,
the methods invoked, and the SQL queries.
The total code modification was less than 1K lines, and
took about a week of a graduate student's time.
To minimize performance overhead and optimize for observation insertion,
we store the in-process portion of each path in a linked
list of fixed-size memory segments.
Each observation contains a table index, relative timestamp,
and identifier, for a total of 12 bytes. The index identifies the
precise location in the system where the observation was made, and the identifier
points to other logging sources that provide further contextual
information. Recording an observation simply involves copying these 12
bytes into (usually) pre-allocated memory. At current usage levels on modern hardware,
there is no statistically significant measurable
impact on the CPU usage and end-to-end latencies of the instrumented
processes.
The Tellmeplatform also records how paths interact.
Paths may split as parallel subtasks, merge when results
are aggregated, or interrupt each other during an abort.
All these behaviors are easily tracked since the path state follows the
underlying logic: path pointers may be passed to multiple software modules
each working on a subtask, code that aggregates results may link one path
pointer to another, etc.
Using the path identifiers, paths across
different processes may be logged in pieces and fully reconstructed
by the Aggregator.
3.2 Aggregator and Repository
The Aggregator receives observations from the Tracers, reconstructs
them into paths using the request IDs,, and stores them in the Repository.
The path data may flow
from distributed local storage to a central data repository, and filters
may be applied to reduce the data volume, creating a multi-tiered cache for
paths.
Pinpointsupports two independent logging modes. The first uses the
asynchronous Java Messaging Service to publish observations to
(remote) subscribers. In the second mode, observations are written
directly to local storage. We use Java's serialization routines to store
and retrieve paths from files, and can insert paths into MySQL and Oracle
databases over JDBC.
Although Tellme's Tracers frequently process paths with many hundreds of
observations, this data rate cannot be sustained with disk writes on the critical path; such delays impact the user experience. Hiccups
on the order of several hundred milliseconds are intolerable along this
critical path, so blocking disk writes are performed by
another, dedicated thread.
This thread also implements a dynamically configurable filter, so that
observations within a path are selectively logged based on the structure
and latency profile of that path. For example, we may only wish to log
a particular observation if another specific observation is present in the
same path, or if a pair of observations were made far enough away from each
other in time. This way, we can specify greater logging detail for paths
of particular interest.
Observations are always recorded internally, so that all path details are
available in a core file, but only critical observations (including those
required by monitoring logic) are regularly written to disk. Once on disk,
ObsLogsare aggregated and stored remotely.
3.3 Analysis Engines and Visualization
We support
both single and multi-path analysis, and use dedicated engines to run
various statistical tests.
Simpler algorithms can be executed in a database, since
descriptive statistics such as mean, count, and sum are cheap SQL
operations. Some data mining tools are also supported by Oracle
[40], so more complicated algorithms such as
clustering and classification can be performed, although off-line analysis is a
better option at scale. We also use analysis
engines written in C++, Java, and Perl, including non-parametric
two-sample and analysis of variance (ANOVA) [44] tests.
Visualization is another analysis engine that complements
statistical test output to help engineers and operators quickly
understand system behavior. We have found Tukey's
boxplots1 useful in summarizing distributions, and survivor
plots2 helpful when focusing on high quantiles and outliers.
These plots are generated using GNU
Octave [21]. Directed graphs depicting system structure are
drawn using Graphviz [6].
4 Failure Management
We now turn to our first path-based analysis application, failure
management.
Given the inevitability of failures, it is important to
improve the mean time to recovery (MTTR) as well as to increase
the mean time to failure [10,19].
The goal of failure management is to minimize failure impact
on availability and service quality.
Although proven large-scale system design principles such as replication and
layering improve scalability and availability, the resulting
componentization impedes failure management, as the execution context is
distributed throughout the system. Paths aid in failure management by
observing request-centric system behavior, identifying the components involved,
linking the symptoms with the distributed state responsible, and providing an
effective means of validating system assumptions made while attempting to
explain the undesirable behavior.
Paths contribute to failure management at each of the following steps:
- Detection: We first learn of some new, undesired behavior (in QA,
development, or production), ideally from an automated analysis engine but
sometimes from a human's description.
- Isolation:
Analysis engines quickly find representative paths. These tell us which components are
involved, and their structure allows us to isolate the problem to a small
subset, often just a single component. Such components are
immediately cut off from the remainder of the system so they can no
longer impact users.
- Diagnosis: A human gets involved at this point, as human
response time can no longer impact service quality. The human visualizes
several representative paths, and studies the statistically significant
deviant component interactions and behaviors. Path-based tools are used
to validate or refute hypotheses during the investigation. Path
pointers to application-level logs, process images, etc., lead to root
cause identification. Paths do not replace traditional local
analysis tools, but rather complement them by guiding the diagnosis.
- Impact Analysis: In parallel with diagnosis, the path
structure that led to detection is refined so we can use paths to
determine the extent of the user impact; i.e., the extent to which other paths exhibit the same problem. This allows us to prioritize
the ongoing diagnosis and subsequent repair efforts.
- Repair: We fix the problem.
- Feedback: In parallel with repair, we use the experience as
feedback to enhance future detection. If the specific problem could have
been caught more quickly with traditional monitoring mechanisms, we now
know enough from the paths to implement these. Or perhaps by
generalizing our path detection, we could catch a broader class of
problems.
We now focus our discussion on three failure management tasks:
detection, diagnosis, and impact analysis. We single out some feedback
examples as we proceed.
4.1 Failure Detection
Traditional monitoring methods use either low-level mechanisms,
such as pings and heartbeats, or high-level application functionality
tests. These low-level methods work well for fail-stop faults, but do
not detect more subtle application-level failures. On the other hand,
end-user tests such as web page content validation can detect broken
applications, but the validation logic must be maintained and versioned
along with the applications. Many services do not use these techniques
because of the development and maintenance costs involved
[39]. Neither approach works well for more
subtle behaviors that affect performance or a small portion of requests.
Our approach is to characterize distributions for normal paths and
then look for statistically significant deviations to detect
failures. This can be applied to structural changes in paths. For example,
an error handler could cut a path short, and a non-responsive or
sluggish component could stall a path. This approach can also be
applied to performance anomalies, which are visible as changes in
latency distributions.
4.1.1 Path Collisions
While servicing a user request, a system may receive a second, new request that effectively aborts the first. For example, users frequently interrupt HTTP requests either by reloading the page (reissuing the request), or by clicking on a new link before the current request completes.
Similarly, for Tellmeapplications, users may abort by hanging up, or issue new requests via touch-tone commands.
We wish to tie these independent but related requests together
to better understand their interaction.
The first path was interrupted and never completed. Incomplete paths
often indicate some of the most challenging problems, as they
capture scenarios in which the user aborts a request (or hang ups) on
the system before receiving a response. For example, stalled system
components often fail to exhibit faulty behavior directly, but instead
show up via an increase in aborted requests.
Because of their importance, we wish to retain more context for incomplete
paths. An incomplete, aborted path references the completed path that
interrupted it, so we have a broader picture of how the user and other
system components react to the potential problem. This is accomplished
by the code that processes the abort, which associates the corresponding
paths using path identifiers, memory pointers, etc. Then to find path
collisions, we need only look for paths that are linked in this manner.
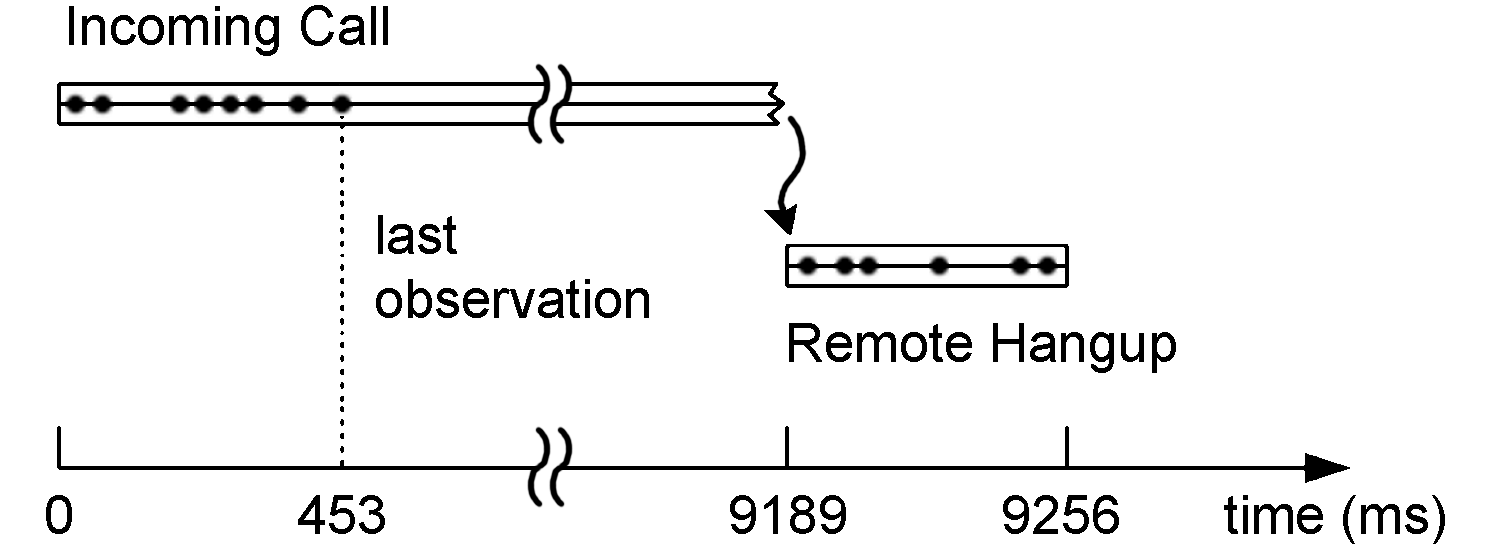 Figure 3: A stalled and subsequently interrupted
Tellmeresponse path, where an engineer hangs up after hearing dead air during a test.
We consider a Tellmepath collision problem in Figure
3. This was caused by
a race condition that resulted in a test caller hearing complete silence, or
"dead air". The paths for such stalled calls provide a clear diagnosis.
The last observation recorded during the incoming call path was made just
453 ms after receiving the call. An observation indicating that playback
was about to proceed should have swiftly followed this one, but is instead
absent. This pointed the developer to the few lines of code where the
stall occurred; he then resolved the bug.
Figure 3: A stalled and subsequently interrupted
Tellmeresponse path, where an engineer hangs up after hearing dead air during a test.
We consider a Tellmepath collision problem in Figure
3. This was caused by
a race condition that resulted in a test caller hearing complete silence, or
"dead air". The paths for such stalled calls provide a clear diagnosis.
The last observation recorded during the incoming call path was made just
453 ms after receiving the call. An observation indicating that playback
was about to proceed should have swiftly followed this one, but is instead
absent. This pointed the developer to the few lines of code where the
stall occurred; he then resolved the bug.
| Fault Type | OmittedCalls | RuntimeExceptions | ExpectedExceptions | Overall | |
| Structuralanomalies | 17% | 4% | 9% | 10% |
| HTTP errors | 13% | 17% | 22% | 17% |
Table 2: Miss-rate comparison of structural anomaly detection and HTTP errors.
We omit log file monitoring because of the high false positive rate; in our
experiments, some failure was always declared whether or not we injected faults.
4.1.2 Structural Anomalies
We can also detect failures by searching for anomalies in path
structure. We model normal path behavior using a probabilistic
context free grammar (PCFG) [34], a structure borrowed
from statistical natural language processing. The PCFG models the
likelihood of a given path occurring based on the paths seen during
training. Magpie [7] also proposes using a PCFG,
but has not applied it to anomaly detection.
To generate the PCFG for normal path behaviors, we represent each path
as a tree of component function calls. Based on the calls made by each
component across all our paths, we generate probabilistic expansion
rules, representing the probability that any given component will call a
particular set of other components. For example, Figure 4
shows the rules trained from two short paths.
| S � A | p=1.0 | | B � C | p=0.5 |
| A � B | p=0.5 | | B � $ | p=0.5 |
| A � BC | p=0.5 | | C � $ | p=1.0 |
Figure 4: A sample PCFG, trained on
two simple paths: one where A calls B which calls C,
and another where A calls both B and C directly.
S and $ are the start and end symbols,
respectively.
One advantage of the PCFG is that the resultant grammar loosely
bounds the acceptable set of paths in our system. Because the
grammar is context-free, the learned PCFG actually represents a
super-set of the observed paths in the system, providing
robustness to false positives. For example, a PCFG model of a
user-customizable system, such as a personalizable web portal,
could accept many more combinations of personalization features
than it had actually observed in its training set. This also
means the PCFG might generate false negatives, allowing bad
paths to slip through. Though this false-negative effect has
not been a major factor in our experimental results, a
context-sensitive grammar would make a different tradeoff,
allowing fewer false-negatives but likely more false-positives.
Once deployed, we single out rare paths, as determined by our trained
PCFG. In the results presented here, we
only consider a path's structure to be anomalous
if it does not fit our PCFG at all.
We implemented and evaluated this algorithm in Pinpoint, testing it
by injecting a series of failures into two implementations of Sun's
sample e-commerce site for J2EE, a clustered Petstore v1.1.2 and
a rearchitected single-node Petstore 1.3.1.
We modified the J2EE platform to allow us to inject various
failures, including expected and unexpected exceptions, as well as
omitted method calls. In our experiments, we injected in
turn each of the three kinds of failures into each of the
24 EJBs in the Petstores. For each failure experiment, we
stressed the system with an application-specific workload
for 5 minutes. We used our own trace-based load generator
for each site, with a workload mix approximating that of
the TPC web e-commerce ordering benchmark, TPC-W WIPSo [50].
We first trained Pinpoint's PCFG
model with the paths from a fault-free run of
the application under a 5 minute workload. Then, we
used this model to score the paths observed during each experiment.
Table 2 summarizes our
results. We successfully detected 90%
of all the failures. Overall,
structural anomaly tests performed as well as or better
than simple HTTP error and log monitoring. Also, HTTP monitoring
found almost exclusively secondary faults, without noticing requests
directly injected with faults. In comparison, structural
anomaly detection correctly identified both types of faulty requests.
Although our path structure anomaly detection implementation excelled in
these experiments, there are a number of realistic scenarios where it would
not fare as well. During a software upgrade, an application's
behavior may change significantly, and the PCFG may require explicit retraining.
Also, some failures may have a subtle impact on path structure, so that
the critical details
are not instrumented as observations. For example, a data manipulation
bug may not impact the associated path structure or the
latencies recorded.
4.1.3 Latency Anomalies
Paths allow us to construct
performance models for components that vary by request type, such as URLs. Such modeling
details are valuable, since many components behave very differently when
presented with different inputs. For example, a UserProfile component may
service getProfile requests more quickly than updateProfile requests.
Deviations in system latencies often signal problems. An
increase in latency outliers may indicate partial failures, while an
increase in average latency might suggest overload. Latency decreases may
be caused by errors preventing a request from being fully serviced.
In an empty audio clip example at Tellme, an audio server experienced an
internal fault, so that it produced much
shorter audio playbacks than the desired ones. This failure is not
catastrophic at the system level; a rare, short audio playback typically goes
unnoticed by the user. The problem is therefore
difficult to detect via low-level system monitoring and would otherwise
require significant application knowledge to handle effectively.
Despite this challenge,
we were able to query the ObsLogsto detect all similar occurrences
once
we understood the path latency characteristics for this failure: observations
for the beginning and end of playback spaced too closely together in time. We
correlated across multiple failure paths to deduce
which components affected which applications, so we could isolate the
failing components and assess application impact. With this new knowledge,
we crafted a monitor to use these sub-path latency deviations to
detect any future failures in both our production and testing environments; this is an example of the feedback aspect of failure management.
4.2 Diagnosis
Paths aid in diagnosis by identifying the components involved and
linking the symptoms with the distributed state responsible.
Although a single path may be sufficient to guide developers to
identify the root causes, multiple paths enable the use of statistical
techniques to build automated diagnosis tools.
We stress that this process involves system data from when the problem is
first witnessed. We treat offline failure reproduction as a backup plan
for when we do not have enough information to determine the root cause.
4.2.1 Single-path Diagnosis
A single path, when sufficiently instrumented with details such as
function arguments and database queries, is sufficient for debugging many
software problems. The control flow embodied by paths guides the use of
local analysis tools, such as application-level logs, to discover and
associate component details with a particular request. Without paths, the
individual component logs are less useful for lack of an association
between log entries and other system state for common requests.
Correlating traditional debug logs for a large number of different
components is painful and prone to error.
A path's latency profile may help isolate problematic components so that
individual component logs yield a diagnosis.
In the empty audio clip case at Tellme(see Section 4.1.1), an engineer familiar with a
particular application noticed a short audio playback and provided the timestamp and caller ID of a
phone call that enabled us to quickly locate the relevant path.
Once we had visualized the latency profile, a short 20 ms playback time suggested an empty audio clip.
The preceding observations confirmed that a remote audio server thought
it had successfully serviced the audio request, when in fact a rare error
had occurred. We identified the particular remote process from the path information, and
text logs on that machine subsequently revealed the root cause.
4.2.2 Multi-path Diagnosis
Statistical techniques help rapidly narrow down potential causes of failure by
correlating data across multiple paths [13]. This works with black-box
components, and can be done automatically and independently of
system upgrades.
The heavy traffic presented to a large,
live system exposes rare behavior and strengthens all our statistical tools
by narrowing confidence intervals. In many systems, it is cost-prohibitive
to reproduce such large, realistic input loads offline. For the rest, these
techniques prove equally powerful offline.
To isolate faults to the components responsible, we search for
correlations between component use and failed requests.
Such components frequently cause the failures, or at least provide
more insight into the chain of events leading to the failures.
This can be cast as a feature selection problem in the statistical
learning domain, where the features are the components and resources
used by each request.
We have explored both a statistical machine learning approach and
a data mining approach. The former involves training a decision tree [9]
to differentiate between classes of success and failure,
where the tree edges leading to failures become root cause candidates. The
latter approach, called association rules [2], uses brute force to formulate
all feature combinations (the rules) that are observed
to co-occur with failures, and then ranks these by
the conditional probability of failure.
We used two heuristics in implementing these algorithms. The first
is noise filtering. Because large systems rarely operate with perfect
consistency, they usually exhibit minor but acceptable abnormal behavior.
When diagnosing failures, we
are interested in identifying the root causes that result in a large
portion of overall abnormal behavior. Therefore, we discard those
root causes that fail to explain a sizable portion.
The second heuristic trims the set of identified causes by eliminating redundant features that correlate
perfectly with each other.
To evaluate these approaches, we collected 10 failure
traces from eBay's production site. Four traces had two independent
failures each for a total of 14 root causes, consisting of machine, software, and
database faults. Each trace had roughly 50 features that tracked 260
machines, 300 request types, 7 software versions, and
40 databases.
Both techniques correctly
identified 93% of the root causes. The decision tree produced 23% false
positives, compared with 50% for the association rules.
We have deployed an online diagnosis tool based on a greedy variant of the decision tree approach
to eBay's production site. Instead of building a full decision tree, the algorithm
locates the single fault that results in the largest number of failures.
The tool analyzes 200K paths in less than 3 seconds, and sends diagnosis results via real-time
Tivoli alerts to the operations team.
4.3 Impact Analysis
Failure impact on a system's users is a key component of many service
quality metrics. For billing purposes, it is important
to measure such impact accurately. It is also important to measure it
quickly, so that problem solving resources may be
correctly prioritized.
We measure
the proportion of requests that are successfully serviced, as defined in a
Service Level Agreement (SLA).
A thorough SLA takes high-level, end-user factors into
consideration, such as the quality of various responses or of the
entire session. These are richer service metrics than availability.
Paths provide a means to accurately and rapidly compute such metrics.
This is similar to the detection problem, but different in that
we are not satisfied with just knowing whether a problem is happening, but
rather want to identify every request impacted by the root cause,
regardless of the different possible manifestations.
Using the details in the path collision example,
we were able to perform an accurate impact
analysis for a stress test, where we predict how often such race conditions
would occur and be user-visible in a production environment. This is
predictive impact analysis, because we are using results in an offline
test environment to predict potential outcomes in a production
environment. We can also perform retroactive impact analysis, where
as part of a failure postmortem, paths help us answer a different set of
questions, including how particular applications are impacted and to what
degree.
For example, we queried for incoming call paths that stalled at the last recorded
observation in Figure 3 for at least 100 ms before being
interrupted by a call disconnect. All phone calls experiencing this
problem stall at the same place, where the only input the user can provide
is to hang up the phone. Therefore, our query would not miss
any callers that experience the problem's symptoms. Our experience with
the working, production version of this system indicates that this last
observation is always followed by another within 10 ms, even when
presented with a simulated input load (call traffic) that
stresses the system past its normal operating point.
Given the large amount of traffic and long time frames over which the correct
behavior was observed, we can empirically bound the probability of a false
alarm to less than 1 ×10⁻⁶. Now, after little work, we had
an accurate understanding of how this problem would impact live users,
and could appropriately prioritize fixing it.
Note that this information also allows us to craft a targeted monitor
for future occurrences of this problem, an example of failure management
feedback. We can also generalize our queries to capture a
larger class of problems by focusing on the user behavior. For
example, we can search for callers who hang up on an incomplete
path after a long period of inactivity.
5 Evolution
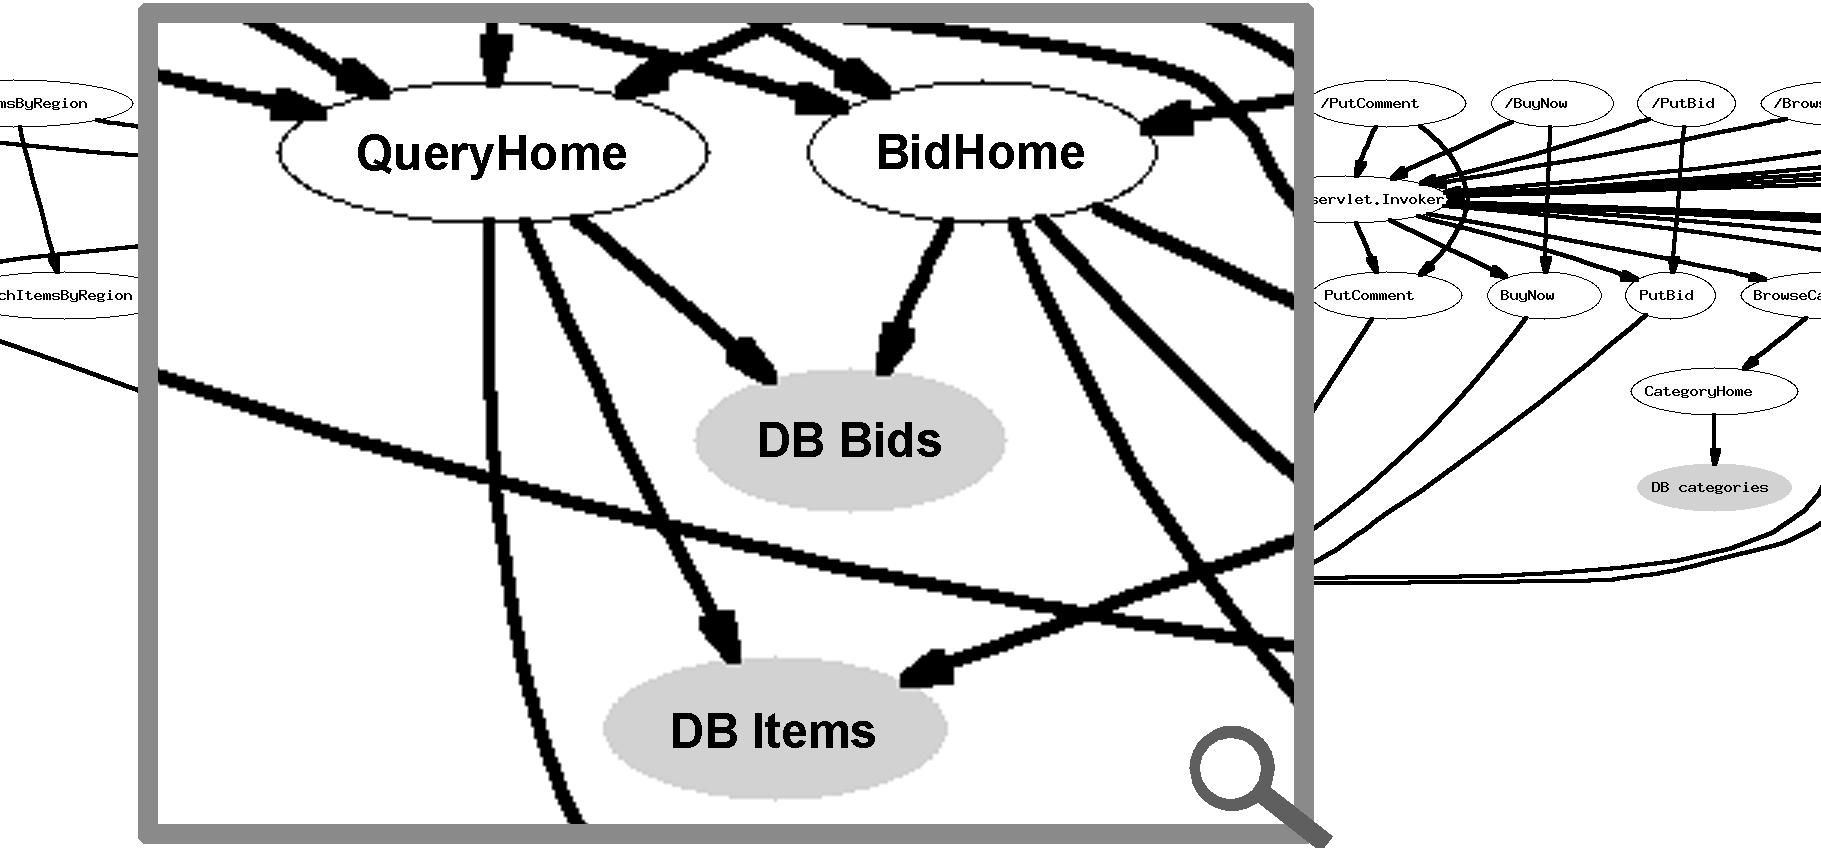 Figure 5: A portion of the derived application structure for
RUBiS (a J2EE benchmark [11]) showing a subset of its 33 components, including JSPs,
Servlets, EJBs, and database tables (in gray). The
nodes are requests, components, and database tables.
The directed edges represent observed paths.
Systems change over time, as software updates fix bugs and introduce new
bugs and features, and hardware additions increase capacity as well as improve
performance. Paths address system evolution in two ways:
Figure 5: A portion of the derived application structure for
RUBiS (a J2EE benchmark [11]) showing a subset of its 33 components, including JSPs,
Servlets, EJBs, and database tables (in gray). The
nodes are requests, components, and database tables.
The directed edges represent observed paths.
Systems change over time, as software updates fix bugs and introduce new
bugs and features, and hardware additions increase capacity as well as improve
performance. Paths address system evolution in two ways:
- Paths capture system structure and component dependencies, and can be
used to observe systems without a priori knowledge of their inner workings.
- When applied to testing during a system release process, paths enable
developers and Quality Assurance (QA) engineers to quickly and accurately
validate new behavior and identify subtle regressions across system
versions. This can be done efficiently, so that a single test run may
simultaneously detect and diagnose multiple regressions.
5.1 Deducing Application Structure
Modern applications tend to have intricate, dynamic structures containing
components with complex dependencies. An accurate view of such structure
increases code accessibility, enables more efficient development, aids in
system testing, and increases the visibility of configuration failures.
Current techniques for understanding application structure rely on static analysis or
human diligence to document and track application changes, sometimes with
the aid of a modeling language, such as UML. Manually tracking
changes is time consuming, prone to error, and difficult to enforce
consistently. Paths can be used to discover this structure and provide
more accurate details. With
instrumented application servers, it is possible to deduce application
structure without any knowledge of the application.
Note a key distinction between our approach
and static analysis: paths capture actual, observed component
dependencies, including runtime resources, instead of
potential component dependencies. Figure 5 shows
an example of an automatically derived application structure. We ran
an unmodified J2EE benchmark, RUBiS[11], hosted on
Pinpoint, and generated workload using the client emulator from the
RUBiS package. The observed paths are aggregated to show the dependency
between the various application components, including Java Server Pages,
Servlets, Enterprise Java Beans, and database tables.
| Database Tables | |
| Request Type | Product | Signon | Account | Banner | Inventory | |
| verifysignin | R | R | R | | |
| cart | R | | | R | R/W |
| commitorder | R | | | | W |
| search | R | | | R | |
| productdetails | R | | | | R/W |
| checkout | | | | | W |
Table 3: An automatically
generated partial state dependency table for Pet Store. To
determine which request types share state, group the rows by common
entry under the desired column. For example, the checkout request
only writes to the Inventory table, which is shared with three
other requests: cart, commitorder, and productdetails.
Paths can also be used to derive more complex application structure. For
example, a database table containing end-user information is typically
read and modified by several components, including those for register,
login, and update operations. A bug in one of these operations may
cause the others to fail. Table 3 is an
automatically derived state-dependency table for an unmodified Pet
Store application, showing the actual
database tables read and written by various requests. Such knowledge is
useful when diagnosing state-dependent bugs or data corruption, and
understanding inter-path dependencies.
5.2 Versioning
Identifying differences in system performance and behavior is an important
part of upgrading applications and the platform they run on. During QA
testing at Tellme, we use a telephone call simulator to stress systems in
a carefully controlled test environment. We analyze the resulting paths
and compare them with similar data for previous platform and application versions, in order
to identify regressions as well as validate performance improvements. We
run 10-15 performance tests per release, each of which involves hundreds of
distinct sub-path comparisons. Although we focus on latency data here, it
is straightforward to apply these techniques to other resource usage and
performance metrics.
The path-based approach is particularly appealing to a QA team, as many
meaningful comparisons may be derived from the embedded sub-paths. This
allows a QA engineer to approach the analysis task with a
different perspective than the developer, and as a result, QA often
identifies interesting, unanticipated path structures.
For simplicity, we consider a sample of three such tests, using three
different interval types from six different applications. Search
time is a user-perceived latency, defined as the time from when a
user stops speaking to when he hears audio in response. This consists
of several disjoint subintervals. Recognition time covers up to
speech recognition completion, at which point the platform conjectures
what was said. VXML interpretation follows, and represents the
time spent evaluating the application content in response to the
user's input. The final portion of search time is spent preparing the
desired prompt for playback.
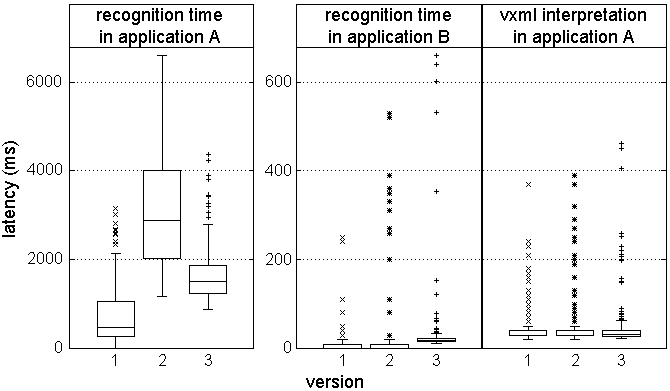 Figure 6: A trend specific to recognition time in
Tellmeapplication A suggests a regression in a speech grammar in
that application. Recall that the Tukey boxplots shown illustrate a
distribution's center, spread, and asymmetries by using rectangles to
show the upper and lower quartiles and the median, and explicitly
plotting each outlier [44].
In our first test, shown in Figure 6, we see that recognition
time in application A changed drastically in version 2. However,
recognition time in all other applications for this test remained steady
(as exemplified by the plot for application B in the middle),
and other intervals in application A, such as VXML interpretation time, did
not change either (shown on the right). This narrows the problem down considerably.
An application history check revealed a feature addition in version 2, that
wound up consuming more resources than desired. A more efficient alternative
was subsequently implemented in version 3.3
Figure 6: A trend specific to recognition time in
Tellmeapplication A suggests a regression in a speech grammar in
that application. Recall that the Tukey boxplots shown illustrate a
distribution's center, spread, and asymmetries by using rectangles to
show the upper and lower quartiles and the median, and explicitly
plotting each outlier [44].
In our first test, shown in Figure 6, we see that recognition
time in application A changed drastically in version 2. However,
recognition time in all other applications for this test remained steady
(as exemplified by the plot for application B in the middle),
and other intervals in application A, such as VXML interpretation time, did
not change either (shown on the right). This narrows the problem down considerably.
An application history check revealed a feature addition in version 2, that
wound up consuming more resources than desired. A more efficient alternative
was subsequently implemented in version 3.3
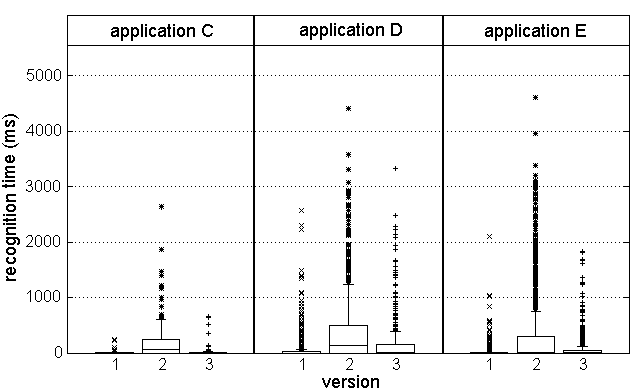 Figure 7: Consistent trends in Tellmerecognition time
profiles across applications suggest systemic changes.
A variety of other regressions can be identified in similar ways.
Recognition times for 3 applications are shown in Figure
7. What is normally an extremely quick response takes a
significant amount of time in version 2. Furthermore, this behavior was
evident in all recognition times for this particular stress test, for
all applications. These facts point to a systemic problem with
the recognition subsystem, and indeed, this test was conducted with
different recognition hardware. The latencies are all reduced in version
3, running on the usual hardware.
Figure 7: Consistent trends in Tellmerecognition time
profiles across applications suggest systemic changes.
A variety of other regressions can be identified in similar ways.
Recognition times for 3 applications are shown in Figure
7. What is normally an extremely quick response takes a
significant amount of time in version 2. Furthermore, this behavior was
evident in all recognition times for this particular stress test, for
all applications. These facts point to a systemic problem with
the recognition subsystem, and indeed, this test was conducted with
different recognition hardware. The latencies are all reduced in version
3, running on the usual hardware.
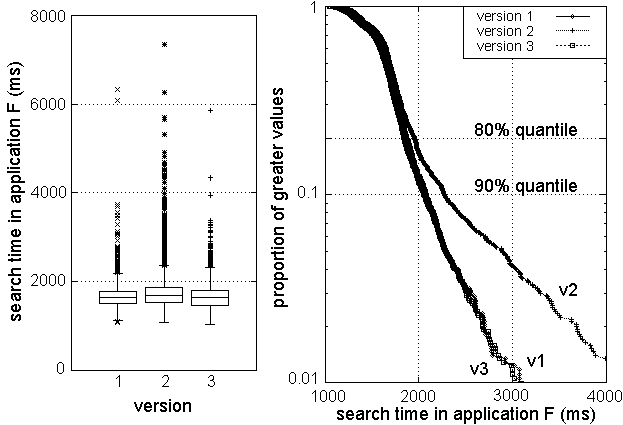 Figure 8: The regression in Tellmeapplication F
is difficult to discern in the boxplot, but is easily visible in the
logarithmic survivor plot. It is also detectable quantitatively using a
statistical two-sample test, and diagnosed with sub-path information.
Our last application reveals a more subtle regression in Figure
8. The version 2 distribution appears slightly
extended, although it is not visually apparent from the boxplot how
statistically significant this difference is. We use standard
two-sample tests [44] to quantify such
differences.4 In fact, Tellmeconducts such tests on all its
data to automate the analysis process, so a human is only required
when a significant behavior change is detected. The p-value for the
Mann-Whitney test for versions 1 and 2 is 1.5 ×10⁻⁴, so we
have high confidence that median search time increased in version
2.5
However, taking a different look at this data provides more insight.
At the right of Figure 8, we focus our attention on the
search time outliers by using sample survivor functions on a logarithmic
scale. The aberrant version 2 behavior is now clear: all quantiles above
80% have increased.
The culprit became evident
after using the path information to identify the responsible subinterval:
application F's data feed changed in version 2, and we were witnessing
erratic web server performance.
In summary, paths offer powerful tools for evolving systems.
Automatically deriving system structure and dependencies helps
development, QA, and operations teams better understand the system.
We can also automatically detect statistically
significant changes in performance and perceived latency across versions.
Some differences are only visible in distribution outliers, and not in the
mean, but they are still captured by this approach. We may further employ
paths to understand the cause behind each change, per Section 4.2.
Figure 8: The regression in Tellmeapplication F
is difficult to discern in the boxplot, but is easily visible in the
logarithmic survivor plot. It is also detectable quantitatively using a
statistical two-sample test, and diagnosed with sub-path information.
Our last application reveals a more subtle regression in Figure
8. The version 2 distribution appears slightly
extended, although it is not visually apparent from the boxplot how
statistically significant this difference is. We use standard
two-sample tests [44] to quantify such
differences.4 In fact, Tellmeconducts such tests on all its
data to automate the analysis process, so a human is only required
when a significant behavior change is detected. The p-value for the
Mann-Whitney test for versions 1 and 2 is 1.5 ×10⁻⁴, so we
have high confidence that median search time increased in version
2.5
However, taking a different look at this data provides more insight.
At the right of Figure 8, we focus our attention on the
search time outliers by using sample survivor functions on a logarithmic
scale. The aberrant version 2 behavior is now clear: all quantiles above
80% have increased.
The culprit became evident
after using the path information to identify the responsible subinterval:
application F's data feed changed in version 2, and we were witnessing
erratic web server performance.
In summary, paths offer powerful tools for evolving systems.
Automatically deriving system structure and dependencies helps
development, QA, and operations teams better understand the system.
We can also automatically detect statistically
significant changes in performance and perceived latency across versions.
Some differences are only visible in distribution outliers, and not in the
mean, but they are still captured by this approach. We may further employ
paths to understand the cause behind each change, per Section 4.2.
6 Discussion
In this section, we summarize some important lessons that we
have learned while working with paths.
6.1 Maintainability and Extensibility
For Tracers to be practical, the instrumentation must be: 1)
maintainable, so that it is not likely to break in light
of ongoing platform changes, and 2) extensible, so new platform additions
can easily make use of the measurement infrastructure. Path-based instrumentation
succeeds in this regard because it keeps the reporting and analysis logic
external to the instrumented system.
Consider the common problem of instrumenting software to measure the
latency of a certain interval, that begins in one software module and ends
in another. These modules know little of each other's internals.
The naive point-based approach would have the two modules log
the start and end events respectively, and attempt to pair them up
externally. Without a path to link these two endpoints to the same request,
it is easy to get confused about the pairings. Although it is possible to
statistically infer the common pairings [3], we are
often interested in precise matches.
We could internalize (but not eliminate) the pairing task by explicitly
tracking and propagating timestamps inside the system. This interval-based
approach offers limited flexibility for adding and modifying measurements,
and adds intricate, and often overlooked, dependencies between modules.
The path-based approach provides the flexibility without the
dependencies. The modules simply report observations with timestamps,
and paths ensure a correct pairing of these two events.
In addition, measurements of new internals (sub-paths) can be easily
added without new instrumentation.
At Tellme, we have repeatedly watched measurements made using older
approaches break, while path-based measurements have remained robust in the face
of rapid change. With path-based measurement, developers estimate that
they now spend 23-28 fewer person-hours per new, medium-sized software
component validating correctness and overall performance impact.
6.2 Trapping Failures
Given the difficulty of perfectly simulating real workloads during testing,
our philosophy is to accept the fact that failures will happen, but to be
well prepared to recover quickly [14]. The sheer size and large
request rate of a full production system expose rare behavior more
frequently than offline tests. We sometimes cannot afford to wait for the
problem to recur, and attempts to reproduce subtle timing conditions on a
smaller test system can be difficult.
Paths allow us to isolate a problem the first time it happens, and if we
cannot immediately diagnose the problem, we can identify the areas where we
need to enable additional instrumentation to catch the problem the next
time. Tellmehas used this failure trapping approach to successfully diagnose rare and
obscure bugs. We use the dynamic filter described in
Section 3.2 to enable the aggregation of verbose
observations and trap problems in this manner.
This is one application area where paths aid in data mutation detection.
If content is a key part of the critical path of a system, such as audio in
Tellme's network, it is advantageous to record data signatures (e.g.,
hashes) as observations at various points along a path, so that the
content's integrity can be validated throughout. If it is not obvious
a priori what data to validate, or validation generates too much data to
handle during normal operation, then data validation is best enabled when
attempting to trap an existing, known failure.
6.3 Designing for Path-Based Macro Analysis
Our black-box path observation approach provides visibility into
application behavior and structure without requiring any application
changes. Pinpointhas four applications and Tellmeruns
hundreds of voice applications that are all observed and analyzed with zero
attention required of the application developers.
Large-scale system design is moving toward the application server model
[8,35,45],
where the platform acts as a cluster-based operating system that provides
resource management, scheduling, and other services for applications. We
believe that the path abstraction should be a core design principle
inherent in these systems.
We offer several design guidelines for building path-based analysis
support into a system. The first is to track path request state, including
unique path IDs, as close to the control flow in the code as possible.
Develop interfaces, classes, and messaging protocols with this in mind,
rather than addressing versioning issues later.
The second guideline is to use a high-throughput logging mechanism and a
space-efficient data representation, so that the system's critical path is
minimally impacted. Although text logs are easier to parse and understand,
we have found that compressed binary representations
significantly reduce logging overhead.
The third is to design the query interface not only with the expected
formal use in mind, but to also plan for exploratory data analysis. Engineers
tend to form new questions when working with path data, and the
interface must be general enough to support such experimentation.
The fourth guideline is to design efficient, flexible query and
aggregation sub-systems. Centralized versus distributed storage and
processing tradeoffs must be weighed based on expected use - a distributed
design leverages parallel I/O and processing, but adds complexity and
runtime overhead to each node in the system. We stress that
data is cheap in large systems. A lot of data goes a long way with
simple, inexpensive statistical tests. These simple tests also tend
to scale better.
6.4 Distributed Timestamps
Latency distribution analysis is challenging when a path runs through
machines with different clocks and the intervals of interest are
short. We recommend using local timestamps (e.g., Solaris gethrtime)
when possible to avoid clock drift concerns, and to use system
timestamps (e.g., gettimeofday) with a time-synchronization protocol
such as NTP [37] to compute intervals between hosts on different
clocks. ObsLogscontain a system timestamp per path
per machine, and all observations are made with 32-bit local timestamps.
So far the extra noise of inter-machine intervals has not been a limitation in practice, although there are improved time synchronization algorithms that we could deploy to reduce the noise [16].
6.5 Path Limitations
The path-based approach has proven useful in many applications. However,
the path concept itself does not solve problems. Rather, paths provide a
framework by which existing techniques may be better focused to tackle
common challenges encountered while managing large, distributed systems.
We must decide which observations to include in
paths for the system of interest.
Software bugs may be so focused that they slip between two observations, so
that their impact is not noticed but for the coarse path detail. Deciding
what to instrument is an iterative process that evolves with the system.
We prefer to err on the side of excess, and dynamically filter out noisy
observations that are not as frequently useful.
For example, our current PinpointTracer implementations generate
observations at the application level but do not yet account for
lower-level components, such as transparent web caches and RAID disks.
Extending Tracers to include such information can help us detect and
diagnose low-level configuration errors and failures (e.g., buggy RAID
controllers).
7 Related Work
In this section we discuss previous work in path-based profiling,
paths, diagnosis, and anomaly detection.
7.1 Path-based Profiling
There are many profiling tools that provide more complete solutions for
specialized tasks, such as performance modeling.
None of these systems are
applicable to the failure management tasks discussed in this paper except for performance failures.
Similar to our approach, several systems use explicit identifiers to trace requests
through multi-tier systems for performance profiling. Some also implement
the tracing in the platform so that no application modification is required.
Magpie [7] profiles distributed systems
to observe processing state machines (e.g., for HTTP requests) and
to measure request resource consumption (CPU, disk, and network usage)
at each stage. Magpie then builds stochastic workload models
suitable for performance prediction, tuning, and diagnosis. WebMon
[49] uses HTTP cookies as identifiers to trace requests from
web browsers to the web servers and application servers. There are
also several recent commercial request tracing systems focusing on
performance profiling and diagnosis, such as PerformaSure
[46] and AppAssure [4]. ETE [24] is a customizable event collection system for
transactions. It requires manually written transaction definitions to
associate events with a transaction, whereas paths captures the
association automatically.
Aguilera et al. [3] takes a completely
non-invasive approach
to profiling distributed systems. They infer the
dominant causal paths through a distributed system of black boxes using
message-level traces, without any knowledge of node internals or
message semantics. They have used the causal paths to profile and
diagnose performance problems. Although their approach is less
invasive than ours, it is more difficult to associate specific
observations with specific request paths for failure management tasks.
7.2 Paths in Other Contexts
Whole Program Paths [31] shares our view of capturing program
dynamic control flow, and applies this to detect hot sub-paths in
individual processes for performance tuning.
Scout [38], Ninja [45], SEDA
[54], and Virtual Services [43] use
paths to specify control flow and resource allocation while servicing
requests. These systems would be particularly easy to integrate with
our macro analysis infrastructure.
Clickstream analysis uses paths to represent the sequence of web pages a
user visits. They focus on understanding user behavior to improve
usability, characterize visitors, and predict future access patterns
[29].
7.3 Diagnosis
IntegriTea [48] and AppSight [28] trace
requests to record method calls and parameters to capture and
replay single-path failures. These systems do not correlate
across multiple requests for improved diagnosis.
Some distributed debuggers support stepping through remote calls
[33]. These tools typically work with homogeneous components and
aid in low-level debugging.
Event and alarm correlation techniques have been used for many years in
network management applications [56]. The challenge is to infer
event causality from just the event sources and timestamps.
7.4 Anomaly Detection
Anomaly detection techniques have been used to identify
software bugs [17,51] and detect
intrusions [32] from resource usage [15],
system calls [27], and network packets [41].
Performance failure detection tools [25,52] compensate for workload variations
using trend analysis. The workload models are constructed per site or
per request type. Paths enable fine-grain workload models to be
constructed per component and per request type.
8 Conclusion
We have presented a new approach to managing failures and evolution
using paths. We trace request paths through distributed system
components, aggregate the resulting data, and apply statistical
techniques to infer high-level system properties.
This approach allows us to build tools that apply to many
applications, even including legacy applications that run on application servers.
These tools can perform complex detection and diagnosis operations
without detailed knowledge of the applications or the system components. The
key to this ability is a large amount of traffic (many paths), which
enables meaningful automated statistical analysis.
We have applied our methodology to address four key challenges that
arise when managing large, distributed systems.
- Path anomalies and latency profiles can be used to quickly and
accurately detect system failures, including both correctness and
performance problems. Because of automated statistical methods, we can
run fault detectors for many different kinds of failures simultaneously.
- Paths help isolate faults and diagnose failures, either for
defects in a single path or sets of paths that exhibit some property.
- Paths allow us to estimate the impact of a fault by finding the
set of other paths that exhibit similar behavior, which allows
for prioritization of problems and resolution of SLA deviations.
- Paths contribute to correct system evolution by discovering
system structure and detecting subtle behavioral differences across
system versions. As with detection, automated tools allows us to
track thousands of system metrics simultaneously, looking for
statistically significant deviations from the old version.
We have validated our methodology using three implementations:
a research prototype and two large, commercial systems that service
millions of requests per day.
We are currently exploring a variety of data storage and analysis
engine architectures in order to build a path-based infrastructure
whose use can scale far past the systems it supports. We also
continue to experiment with new algorithms for our analysis engines.
We are exploring the application of our failure detection techniques
to clickstream paths. Finally, we plan to extend paths to peer-to-peer
systems, where we can use path properties to verify distributed macro
invariants so as to detect faulty implementations or misbehaving
members.
References
- [1]
-
Abbott, M. B., and Peterson, L. L.
Increasing Network Throughput by Integrating Protocol Layers.
IEEE ACM Transactions on Networking 1, 5 (1993),
600-610.
- [2]
-
Agrawal, R., Imielinski, T., and Swami, A.
Mining association rules between sets of items in large databases.
In SIGMOD (1993), pp. 26-28.
- [3]
-
Aguilera, M. K., Mogul, J. C., Wiener, J. L., Reynolds, P., and
Muthitacharoen, A.
Performance Debugging for Distributed Systems of Black Boxes.
In SOSP (2003).
- [4]
-
Alignment Software.
AppAssure, 2002.
http://www.alignmentsoftware.com.
- [5]
-
Ammons, G., and Larus, J. R.
Improving Data-flow Analysis with Path Profiles.
In Conference on Programming Language Design and
Implementation (1998), pp. 72-84.
- [6]
-
AT&T Labs.
Graphviz, 1996.
http://www.research.att.com/sw/tools/graphviz.
- [7]
-
Barham, P., Isaacs, R., Mortier, R., and Narayanan, D.
Magpie: Real-time Modelling and Performance-aware Ssytems.
In HotOS IX (May 2003).
- [8]
-
BEA Systems.
WebLogic.
http://www.bea.com.
- [9]
-
Breiman, L., H.Friedman, J., Olshen, R. A., and Stone, C. J.
Classification and Regression Trees.
Wadsworth, 1984.
- [10]
-
Brewer, E.
Lessons from Giant-Scale Services.
IEEE Internet Computing 5, 4 (July 2001), 46-55.
- [11]
-
C. Amza et al.
Specification and Implementation of Dynamic Web Site Benchmarks.
In IEEE 5th Annual Workshop on Workload Characterization (Nov
2002).
- [12]
-
Chen, M., K c man, E., Accardi, A., Fox, A., and Brewer, E.
Using Runtime Paths for Macroanalysis.
In HotOS IV (2003).
- [13]
-
Chen, M., K c man, E., Fratkin, E., Brewer, E., and Fox, A.
Pinpoint: Problem Determination in Large, Dynamic Internet
Services.
In Symposium on Dependable Networks and Systems (IPDS Track)
(2002).
- [14]
-
D. Patterson et al.
Recovery Oriented Computing (ROC): Motivation, Definition,
Techniques, and Case Studies.
Tech. Rep. CSD-02-1175, UC Berkeley Computer Science, 2002.
- [15]
-
Dunlap, G. W., King, S. T., Cinar, S., Basrai, M., and Chen, P. M.
ReVirt: Enabling Intrusion Analysis through Virtual-Machine Logging
and Replay.
In OSDI (2002).
- [16]
-
Elson, J., Girod, L., and Estrin, D.
Fine-Grained Network Time Synchronization Using Reference
Broadcasts.
In OSDI (2002).
- [17]
-
Engler, D., Chelf, B., Chou, A., and Hallem, S.
Checking System Rules Using System-Specific, Programmer-Written
Compiler Extensions.
In OSDI (2000).
- [18]
-
Fox, A., Gribble, S. D., Chawathe, Y., Brewer, E. A., and Gauthier, P.
Cluster-Based Scalable Network Services.
In SOSP (1997), pp. 78-91.
- [19]
-
Fox, A., and Patterson, D.
When Does Fast Recovery Trump High Reliability?
In Workshop on Evaluating and Architecting System dependabilitY
(EASY) (October 2002).
- [20]
-
Francisco, C. A., and Fuller, W. A.
Quantile Estimation with a Complex Survey Design.
The Annals of Statistics 19, 1 (1991), 454-469.
- [21]
-
GNU.
Octave, 1992.
http://www.octave.org.
- [22]
-
Graham, S., Kessler, P., and McKusick, M.
gprof: A Call Graph Execution Profiler.
In Symposium on Compiler Construction (June 1982), vol. 17,
pp. 120-126.
- [23]
-
Gray, J.
Dependability in the Internet Era.
http://research.microsoft.com/~gray/talks/InternetAvailability.ppt.
- [24]
-
Hellerstein, J. L., Maccabee, M., Mills, W. N., and Turek, J. J.
ETE: A Customizable Approach to Measuring End-to-End Response Times
and Their Components in Distributed Systems.
In International Conference on Distributed Computing
Systems (1999).
- [25]
-
Hellerstein, J. L., Zhang, F., and Shahabuddin, P.
An Approach to Predictive Detection for Service Management.
In Symposium on Integrated Network Management (1999).
- [26]
-
Hennessy, J. L., and Patterson, D. A.
Computer Architecture: A Quantitative Approach, third ed.
Morgan Kaufmann, 2002.
Chapter 8.12.
- [27]
-
Hofmeyr, S. A., Forrest, S., and Somayaji, A.
Intrusion Detection Using Sequences of System Calls.
Journal of Computer Security 6, 3 (1998), 151-180.
- [28]
-
Identify Software.
AppSight, 2001.
http://www.identify.com.
- [29]
-
J. Srivastava et al.
Web Usage Mining: Discovery and Applications of Usage Patterns from
Web Data.
SIGKDD Explorations 1, 2 (2000), 12-23.
- [30]
-
JBoss.org.
J2EE App Server.
http://www.jboss.org.
- [31]
-
Larus, J. R.
Whole Program Paths.
In Conference on Programming Languages Design and
Implementation (May 1999).
- [32]
-
Lee, W., and Stolfo, S.
Data Mining Approaches for Intrusion Detection.
In USENIX Security Symposium (1998).
- [33]
-
M. Meier et al.
Experiences with Building Distributed Debuggers.
In SIGMETRICS Symposium on Parallel and Distributed Tools
(1996).
- [34]
-
Manning, C. D., and Shutze, H.
Foundations of Statistical Natural Language Processing.
The MIT Press, 2000.
- [35]
-
Microsoft.
.NET.
http://microsoft.com/net.
- [36]
-
Microsoft Research.
Magpie project, 2003.
http://research.microsoft.com/projects/magpie.
- [37]
-
Mills, D. L.
RFC 1305: Network time protocol (version 3) specification,
implementation, Mar. 1992.
- [38]
-
Mosberger, D., and Peterson, L. L.
Making Paths Explicit in the Scout Operating System.
In OSDI (1996).
- [39]
-
Oppenheimer, D., Ganapathi, A., and Patterson, D. A.
Why do Internet services fail, and what can be done about it?
In USITS (March 2003).
- [40]
-
Oracle.
Oracle Data Mining, 2002.
http://technet.oracle.com/products/bi/9idmining.html.
- [41]
-
Paxson, V.
Bro: A System for Detecting Network Intruders in Real-time.
Computer Networks 31, 23-24 (1999), 2435-2463.
- [42]
-
Rational Software.
Quantify for UNIX.
http://www.rational.com/products/quantify_unix.
- [43]
-
Reumann, J., Mehra, A., Shin, K. G., and Kandlur, D.
Virtual Services: A New Abstraction for Server Consolidation.
In USENIX Annual Technical Conference (June 2000),
pp. 117-130.
- [44]
-
Rice, J. A.
Mathematical Statistics and Data Analysis, second ed.
Duxbury Press, 1994.
- [45]
-
S. D. Gribble et al.
The Ninja Architecture for Robust Internet-scale Systems and
Services.
Computer Networks 35, 4 (2001), 473-497.
- [46]
-
Sitraka.
PerformaSure, 2002.
http://www.sitraka.com/software/performasure.
- [47]
-
Sun Microsystems.
Java2 Enterprise Edition (J2EE).
http://www.javasoft.com/j2ee.
- [48]
-
TeaLeaf Technology.
IntegriTea, 2002.
http://www.tealeaf.com.
- [49]
-
Thomas Gschwind et al.
WebMon: A Performance Profiler for Web Transactions.
In 4th IEEE Int'l Workshop on Advanced Issues of E-Commerce and
Web-Based Information Systems (2002).
- [50]
-
Transaction Processing Performance Council.
TPC-W Benchmark Specification, Web-based Ordering.
http://www.tpc.org/wspec.html.
- [51]
-
Wagner, D., and Dean, D.
Intrusion Detection via Static Analysis.
In IEEE Symposium on Security and Privacy (2001),
pp. 156-169.
- [52]
-
Ward, A., Glynn, P., and Richardson, K.
Internet Service Performance Failure Detection.
In Web Server Performance Workshop (1998).
- [53]
-
Weiser, M.
Program Slicing.
IEEE Transactions on Software Engineering SE-10, 4 (1984),
352-357.
- [54]
-
Welsh, M., Culler, D. E., and Brewer, E. A.
SEDA: An Architecture for Well-Conditioned, Scalable Internet
Services.
In SOSP (2001), pp. 230-243.
- [55]
-
World Wide Web Consortium (W3C).
Voice Extensible Markup Language (VoiceXML) Version 2.0.
http://www.w3.org/TR/voicexml20.
- [56]
-
Yemini, A., and Kliger, S.
High Speed and Robust Event Correlation.
IEEE Communication Magazine 34, 5 (May 1996), 82-90.
Footnotes:
1Boxplots illustrate a distribution's center, spread,
and asymmetries by using rectangles to show the upper and lower
quartiles and the median, and explicitly plotting each outlier
[44].
2A survivor plot is 1 - CDF, the cumulative distribution
function;
we plot it with a logarithmic y-axis to add detail for the tail, which is typically the area of interest for latency measurements.
3Notice two other changes in the
version 3 boxplots in Figures 6 and 7.
First, all recognitions take slightly longer,
because we upgraded the acoustic models used. Second, measurement timing
resolution has improved from 10 ms, due to an operating system change.
4We prefer tests that avoid assumptions about the distributions (non-parametric tests). Here we use the Mann-Whitney test to determine if two datasets come from the same distribution. For testing changes in quantiles, we prefer Woodruff confidence intervals [20].
5We say differences are statistically significant only for low
p-values ( < 0.001), as we have a great deal of data at our disposal.
|
