|
MobiSys '05 Paper
[MobiSys '05 Technical Program]
Energy Efficiency of Handheld Computer Interfaces:
Limits, Characterization and
Practice
1
Lin Zhong and Niraj K. Jha
Department of Electrical Engineering
Princeton University
Princeton, NJ 08544
{lzhong,jha}@princeton.edu
Abstract
Energy efficiency has become a critical issue for
battery-driven computers. Significant work has been devoted to
improving it through better software and hardware. However, the
human factors and user interfaces have often been ignored. Realizing
their extreme importance, we devote this work to a comprehensive
treatment of their role in determining and improving energy
efficiency. We analyze the minimal energy requirements and overheads
imposed by known human sensory/speed limits. We then characterize
energy efficiency for state-of-the-art interfaces available on two
commercial handheld computers. Based on the characterization, we
offer a comparative study for them.
Even with a perfect user interface, computers will still spend most
of their time and energy waiting for user responses due to an
increasingly large speed gap between users and computers in their
interactions. Such a speed gap leads to a bottleneck in system
energy efficiency. We propose a low-power low-cost cache device, to
which the host computer can outsource simple tasks, as an interface
solution to overcome the bottleneck. We discuss the design and
prototype implementation of a low-power wireless wrist-watch for use
as a cache device for interfacing.
With this work, we wish to engender more interest in the mobile
system design community in investigating the impact of user
interfaces on system energy efficiency and to harvest the
opportunities thus exposed.
1 Introduction
Energy consumption is a critical
concern for battery-driven mobile devices, such as handhelds,
laptops, and cell-phones. Most handheld computers serve their users
directly through human-computer interaction, and most tasks are
interactive. From the user's perspective, the concern is not really
the power consumption itself but what the user can do, given the
battery lifetime. Energy efficiency is, therefore, better evaluated
in terms of energy consumption per user task. At a higher level, one
needs to evaluate:
|
|
User productivity
Average powerconsumption
|
|
|
or (User productivity)×(Power
efficiency).
From such a perspective, human factors and user interfaces have a
large impact on system energy efficiency, simply because they
determine not only the power consumption for interaction but also
user productivity. Most low-power research has focused on reducing
power consumption, given a computation or interactive task. However,
it is equally, if not more, important to optimize the interaction
itself, i.e., reduce the interaction power and improve user
productivity.
In this paper, we focus on the impact of human factors and user
interfaces on energy efficiency. To the best of our knowledge, this
is the first work of this nature. We first present theoretical
studies of the minimal energy/power requirements for user interfaces
based on human sensory limits, and then take into account the human
speed for human-computer interaction. We then investigate the energy
efficiency of the state-of-the-art interfaces by characterizing
different interfacing technologies available on two commercial
handheld computers. Based on the characterization, we offer a
comparative study of energy efficiency of these different
interfacing methods. We find that speech-based input has a great
potential to become the most energy-efficient interfacing method
since we can speak at a much higher rate than we can write or type.
Such a comparative study offers guidelines for mobile system
designers when choosing interfacing technologies.
As the characterization clearly shows, energy requirements of
state-of-the-art interfaces are far from the theoretical minimal. In
fact, interfacing components, such as the display and speaker
subsystems, are among the most power-consuming components. On the
other hand, human capacity is essentially limited, and the computer
usually spends most of its time waiting for the human user during
interaction. Therefore, significant energy is spent in waiting due
to power-hungry interfacing components and a slow user, leading to
an energy efficiency bottleneck. Such a bottleneck cannot be removed
with more sophisticated user interfaces, which usually consume even
more power. Motivated by memory-cache theory, we show how a
low-power interface cache device with much simpler and lower power
interfaces can be used to handle simple interactive tasks outsourced
from a host computer, and thus improve the battery lifetime of the
latter. It saves energy essentially by bringing the interface energy
requirements closer to the theoretical minimal without sacrificing
user productivity much for the simple outsourced tasks. In this
work, we designed and prototyped a wireless wrist-watch as an
interface cache device to serve an HP iPAQ handheld computer.
The paper is organized as follows. We discuss limits on energy
efficiency imposed by human factors in Section 2. We
then offer user interface energy characterization and comparative
studies in Sections 3 and 4,
respectively. We present the design and experimental results for the
wrist-watch as an interface cache device in Section 5.
We discuss related works in Section 6, and conclude in
Section 7. It is worth mentioning that there are
many other issues involved in user interface design and evaluation
than energy efficiency, such as user acceptance and form factors. In
this work, however, we focus on energy efficiency from a computer
engineering perspective.
2 Limits due to Human Factors
This section examines how human factors impose limits on energy
efficiency with regard to interfacing power and user productivity
(speed). It highlights the importance of human factors and
interfaces in determining system energy efficiency as compared to
computing. It also provides theoretical foundations for improving
user interfaces for better energy efficiency.
2.1 Sensory Perception-based Limits
Landauer [23] showed that
the theoretical lower bound for energy consumption of an
irreversible logic operation is kTln2, where k is the Boltzmann
constant and T is the temperature. kT is of the order of
10-21J at room temperature. All commercially available
computing devices use irreversible logic operations and are hence
governed by this bound. On the other hand, the computer has to
communicate with its human user through the latter's sensory
channels. These channels in fact set the minimal power/energy
requirements for the computer output.
2.1.1 Visual output
Human vision energy thresholds have been measured in different
forms [4] in terms of minimal absolute
energy, minimal radiant flux, and just-perceptible
luminance. Minimal absolute energy is measured for a
very small solid-angle field, e.g., a point source, presented for a very short time (10-3 s) so that
no temporal summation of radiant flux occurs. Minimal radiant flux is
measured for a very small solid-angle field lasting
for a long time so that temporal summation of radian flux occurs. Just-perceptible luminance is measured for a large-area visual field. These thresholds are used
to estimate the energy/power dissipation lower bound for
displaying
information as follows.
Minimal absolute energy: Let us assume the
user's cornea area is A, viewing distance D, and viewing angle
W. We assume the light irradiance is the same for every point
within the viewing angle that is at the same distance from the point
source. Let Emin(l) denote the minimal light energy
reaching the cornea that is detectable by the user for light of
wavelength l. The total energy emitted by the source is
thus:
|
E(l)= |
WD2
Ai
|
·Emin(l) � |
WD2
A
|
·Emin(l) |
|
where Ai is the area of the viewing sphere that is incident on the
cornea. Ai is approximated as the cornea area A.
Experimental results reported by psychology
researchers [4] indicate that Emin for
light of wavelength 510nm is about
2·10-17 ~ 6·10-17J. Assuming A=0.5cm2,
D=0.3m, and W = 0.125·2p sr, we have
E � 3·10-14 ~ 9·10-14J, which is about
seven orders of magnitude larger than the energy required for an
irreversible logic operation.
Note that the energy limit derived above is for rod vision, which is
human vision under extremely low luminance and colorless. Only the
cone vision contains color and is normally required for
human-computer interaction. The energy threshold for cone vision for
l = 510nm is more than 100 times that of rod vision. For users
to sense color, the minimal energy would thus be of the order of
10-11J.
Minimal radiant flux: Let Rmin(l) denote the
minimal radiant flux for light of wavelength l that humans
can sense. For the viewing distance D and viewing angle W, the
source radiant power is given by:
|
Fmin(l)= |
Rmin(l)·WD2
683·V(l)
|
|
|
where V(l) is the relative visibility factor and 683 is
the spectral efficiency for l = 550nm in lumen/W. According
to [4], the minimal radiant flux for white
light rod vision is about 4·10-9lumen/m2. Assuming
V(l) for white light to be 0.8, we obtain
Fmin � 5·10-13W under the same assumptions for
D and W as before.
Just-perceptible luminance: Suppose the just-perceptible luminance for light of wavelength l
is Lmin(l). Let S denote the area of the display and
W the viewing angle. The total display radiant power,
Fmin(l), is then
|
Fmin(l)= |
Lmin(l)·S·W
683·V(l)
|
|
|
For white light, Lmin has been determined to be
7.5·10-7candella/m2 [4]. With the
same assumptions as above, the minimal radiant power for a 12.1"
laptop display and white light is about 5·10-11W. For
comfortable reading, the luminance level is, however, about
[100/(p)] candella/m2 [4], which
requires a radiant power of about 2mW for a 12.1" display. This
minimal radiant power for comfortable reading is about seven orders
of magnitude larger than the just-perceptible threshold.
2.1.2 Auditory output
Let W denote the solid hearing angle and D the distance
between ears and the sound source. The minimal sound intensity human
beings can hear is about 10-12W/m2 for a sound field of
relatively long duration ( > 300ms) [12]. Below
300ms, the threshold sound intensity increases fast as the sound
duration decreases [12]. Therefore, we can
estimate the minimal energy, Emin, for human beings to detect
one bit of auditory information to be
Assuming W = 0.125p sr and D=0.3m, we have
Emin� 10-14J, which is of the same order of
magnitude as the minimal energy required for displaying one bit of
visual information. Note that the minimal sound intensity varies for
sounds of different frequencies. 10-12W/m2 is approximately the
just-perceptible intensity of sound at a 1000Hz frequency, which
belongs to the span of frequencies human beings are most sensitive
to. A normal conversation generates a sound level that is about
106 times larger than the just-perceptible sound intensity.
Therefore, for a user to obtain auditory information from a
computing system, the sound intensity should be no less than
10-6W/m2. For the values of W and D given above, this
results in an acoustic energy requirement of about 10-8J.
Moreover, the above thresholds assume no noise
(just-perceptible intensity) or relatively low noise (conversational intensity). When ambient noise increases, the
output sound level has to increase accordingly, according to
Webber's Law [12].
2.1.3 Power reduction techniques
Based on the above discussion, we can formulate the power
requirement of a visual/auditory output as follows
where h(l) is the conversion efficiency from electrical
power to light/sound radiant power for wavelength l, and
V(l) the relative human sensitivity factor. Most display
research efforts have been devoted to improving h(l) by
adopting new display devices. For organic light-emitting devices
(OLEDs), the best h(l) so far is 70lumen/W for
l = 550nm [10]. This is about 10-fold
smaller than the theoretical 683lumen/W upper
limit [4].
Reducing the viewing/hearing distance D seems to be the most effective
way to reduce output power requirement. Unfortunately, it poses a
practical problem for visual output since it requires changes to the
way a display is used. Moreover, reducing D may also have an
impact on other display parameters such as pixel size and aperture
(the ratio of the effective area to display area). A head-mounted
display is a successful example where a reduced D is used.
However, it is promising only for limited scenarios such as military
and virtual reality applications at this moment. Unlike head-mounted
displays, their auditory counterparts, earphones, are quite popular.
Due to their extremely small D and W, earphones are much
more power-efficient than loudspeakers, as we will see in
Section 3.
Moreover, many applications do not need a large viewing/hearing
angle. The viewing/hearing angle can be controlled to reduce output
power consumption too. Another hint from Equation (1) is
that choosing the colors/sounds with a higher human sensitivity,
thus higher V(l), will also reduce power. Human vision
sensitivities to different colors differ by several orders of
magnitude. However, user experience with colors is quite complicated
since color contrast and aesthetics also matter.
2.2 Input/Output Speed
The energy consumption per task depends not only on system power consumption but also on the task duration,
or speed. We next characterize input/output speeds for
human-computer interaction, which will be used to compare the energy
efficiency of different interfacing technologies in
Section 4. This subsection draws upon many
previous surveys [1].
Speaking/Listening/Reading speeds: 150 words per minute
(wpm) is regarded as normal for conversational English for both
speaking and listening. When speaking to computers, users tend to be
slower at about 100wpm [20]. Also, users can
listen to compressed speech at about
210wpm [29]. Such speaking and listening
rates set limits to the energy efficiency of speech-based
interfaces, as shown in Section IV. Moreover,
when speech-recognition errors have to be corrected, the speaking
rate is reduced drastically to as low as
25wpm [20]. For reading printed English text,
250 to 300wpm is considered typical [5]
Text entry: Text entry on handheld devices is well-known to
be much slower than on PCs with a full-size QWERTY keyboard.
Table I summarizes results from the literature
about input speeds for popular text entry methods available on
commercial handheld computers, such as HP iPAQ and Sharp Zaurus,
which are studied in this work. "Typical speed" refers to the raw
speed regardless of accuracy while "Corrected speed" refers to real
speed when error correction is taken into consideration. Note that
handwriting speed is for hand-printing, which serves as an upper
bound for the input speed for any handwriting recognition-based text
entry. The corrected word per minute (cwpm) for handwriting
recognition is around 7 [8]. We assume that
the error rate is low for hardware mini-keyboard thumbing, i.e.,
typing with two thumbs, and error correction is fast, as assumed for
the virtual keyboard in [8].
Table 1: Typical text-entry speeds for different
methods
| Method | Typical speed | Corrected speed |
| (wpm) | (cwpm) |
| Hardware mini-keyboard | 23 [33] | 22 |
| Virtual keyboard | 13 [32] | 12 [8] |
| Handwriting | 15 [25] | N/A |
Stylus/touch-screen: For GUI-based human-computer
interaction, the speed is usually dependent on how fast the user can
respond to the GUI. In [37], we characterized
the user delays and investigated how they could be predicted for
aggressive power management. As we are more interested in typical
delays for energy-efficiency evaluation, we assume that a 500 to
1000ms user delay is typical for GUI operations on handheld
devices.
3 Energy Characterization
The previous section demonstrated that human factors impose limits
on both interfacing power consumption and interaction
speed. It also
offered the theoretical minimum power requirements for
interfacing. Although such minimum power requirements are orders
of magnitude larger than those for computing, they are still far
from the reach of the state of the art user interfaces as we will see
in this section.
3.1 Characterization Setup
Table 2: System information for iPAQ and Zaurus
| iPAQ | Zaurus | |
| Model | HP iPAQ 4350 | Sharp SL5600 |
| SoC | Intel XScale 400MHz |
| Storage | 32MB ROM, 64MB RAM | 16MB ROM, 64MB RAM |
| Display | 240×320, 16-bit color |
| Transflective/back light | Reflective/front light |
| OS | MS Pocket PC 2003 | Embedix Plus PDA 2.0 (Linux 2.4.18) |
| Battery | 1560mAh/3.7V | 1700mAh/3.7V | |
| Text entry | Touch-screen with stylus |
| Hardware mini-keyboard (QWERTY) |
| Virtual keyboard (QWERTY) |
| Handwriting recognition | |
| Image/Video | N/A | CF
digital camera | |
| Audio | Integrated mic., speaker & headphone
jack |
| Speech recog. | Voice Command [28] | N/A |
Table II provides information on system settings and
input methods for the two handheld computers characterized in this
work. iPAQ is also equipped with Bluetooth. Note that several
different handwriting recognition schemes are available on both
computers. The user can input text letter-by-letter using
letter or block recognition on both computers. The
user can also input a group of letters using Microsoft
Transcriber [27] on the iPAQ.
Power measurements: Power measurements are obtained by measuring
the voltage drop across a 100mW sense resistor in series with
the 5V power supply cord. The measurement system consists of a
Windows XP PC with a GPIB card and an HP Agilent 34401A digital
multimeter. A program, developed with Visual C++, runs on the PC and
controls the digital multimeter to measure the voltage value. The
value is sampled about 200 times per second.
Basic power breakdown: We first characterize the power
consumption due to hardware activities initiated by user
interaction. We use the power consumption of idle PDAs (in the IDLE
mode) with the display off as the baseline, and present the power
consumption of additional hardware activities as extra power
consumption relative to the baseline. The extra power/energy
consumption [36] of an event is obtained through two
measurements: one for the system power/energy consumption during the
period an event of interest occurs; the other for the system
power/energy consumption during the same period when the event does
not occur. For example, the extra power consumption of the LCD is
obtained by subtracting the system power when the system is idle and
the LCD is off from that when the system is idle and the LCD is on.
The power characterization results are presented in
Figure 1. In this figure, "BT Trans." refers to
Bluetooth transmitting data at 9.6 Kbps; "BT Paging" refers to
Bluetooth seeking a connection with another device, and "Comp."
refers to measurements when the system is executing a
discrete-cosine transform (DCT) application repeatedly.
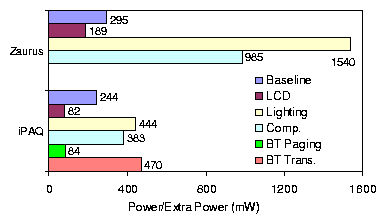 Figure 1: Baseline power and extra hardware power consumption
3.2 Visual Interfaces
We first examine visual interfaces.
Graphical user interface: In [36], we presented a comprehensive
analysis of the system energy consumption required for GUI
manipulations. In [37], we showed, however, that most of the system energy is consumed when the system waits for the next user input.
If we ignore the extra energy consumed by the system to generate a GUI response,
GUI manipulation-based interfaces basically consume energy
through a static display and an idle system. As pointed out
in [36], the most effective system energy reduction
strategy is to improve user productivity so that more tasks
can be accomplished given the same battery lifetime. In
Section 4, the energy efficiency of GUIs is
compared with other interfacing technologies based on the length of
the corresponding GUI operation.
Visual input: Gesture recognition and lip-reading have been proposed as
possible techniques for multi-modal human-computer interaction.
Both require video or image input. We used a CF digital camera
card on Zaurus to obtain its power cost.
When the camera is turned on with a 480×320 resolution and faces a static object, the system consumes about
1.35W. When the object moves, the power consumption increases
slightly to about 1.36W. This is close to the power consumption when the user is preparing for a shot, e.g., adjusting the focus and view. Also, it takes
about 0.33J to capture a 480×320 picture.
Since a user usually takes more than a few seconds to
prepare a shot, it is obvious that it is more important to reduce the
user's preparation time and system power consumption during
that time than reduce these for
actually capturing the picture.
Table 3: Power consumption for different auditory
outputs
| | iPAQ (mW)
| Zaurus (mW) |
| Format | Volume | System | Extra | Speaker | System | Extra | Speaker |
| WAV | Max. | 747 | 420 | 367 | 1,030 | 546 | 422 |
| Half | 552 | 232 | 172 | 637 | 153 | 29 |
| Muted | 380 | 53 | 0 | 608 | 124 | 0 |
| Earphone Max. | 445 | 118 | 65 | 619 | 135 | 11 |
| MP3 | Earphone Max. | 476 | 149 | N/A | 632 | 148 | N/A |
3.3 Auditory Interfaces
We next examine the auditory interfaces available on iPAQ and Zaurus.
3.3.1 Direct recording and playback
An auditory signal can be directly recorded and played back for interfacing purposes. Direct recording is often used for note-taking and direct playback
for short
sound responses from the computers such as warnings and notifications.
If there are too many sound responses to be feasible for direct playback, speech synthesis is
required.
Direct recording: iPAQ provides a hardware button to start
recording (11KHz 16-bit Mono), which
is very useful for audio note-taking. The recording consumes
525mW. The
extra power consumption is thus 199mW. Zaurus draws about
198mW extra power consumption when recording (16KHz 16-bit Mono).
Direct playback: A WAV sound clip (32KHz 16-bit mono) was
played on both iPAQ and Zaurus. To separate
the power consumption of the speaker subsystem, the clip was played at different volumes. Table III shows the power
consumption under various scenarios. "Half" volume assumes that the volume controller is set at the half mark on each system.
In this scenario, the clip is not comfortably enjoyable on either system, even in a quiet office environment, if the system is about two feet from the user head.
All the system power numbers include that consumed by the LCD.
The extra power consumption of the speaker subsystem
is obtained by comparing the system power consumption before and
after the system is muted. This has a significant impact on system
power efficiency if the auditory output is used. Notably, using an
earphone instead of the built-in loudspeaker reduces power by more
than 300mW and 410mW for iPAQ and Zaurus, respectively.
The data also indicate that
using a simpler audio format (WAV as opposed to MP3) reduces power consumption at the
cost of increasing the storage requirement. Since the extra
power consumption of the speaker subsystem for playing MP3 is
similar to that for playing WAV, the power
consumption for playing MP3 at different volumes is not
presented.
3.3.2 Speech recognition and synthesis
We next examine the Microsoft Voice Command [28] on iPAQ to obtain its power for a
speech recognition-based interface. Voice Command is similar to the MiPad Tap & Talk system [22] except that synthesized speech is used
as feedback to the user. Not having a detailed knowledge of its implementation, we adopted a black-box approach.
We recorded both the power trace and the audio input/output and then aligned them to divide the power trace into meaningful segments.
We fed different inputs to Voice Command to elicit certain behaviors from it.
Speech acquisition without speech being detected: We first
evaluated Voice Command under no sound. Hence, the speech detection
module does not detect any speech. A reasonable speech recognition
implementation will discard most of the acquired speech without
performing feature extraction under this scenario. Therefore, the
power consumption can be attributed to the microphone subsystem and
speech detection module. From the power trace, we observed that
Voice Command calls the speech detection module about every 250ms.
Each call contributes to a peak in the power trace, leading to an
average extra power consumption of 126mW.
Speech acquisition with speech being detected: We next
evaluated Voice Command when fed with irrelevant utterances, which
are detected as speech but not recognized. The power trace generated
was very similar to the one when there was no speech except that the
peaks became wider when the input utterances became more continuous.
These wider peaks can be attributed to feature extraction performed
immediately after speech is detected and recognition decoding after
a certain amount of speech is detected. The typical power
consumption for processing a continuous irrelevant utterance is
about 780mW. Interestingly, if the utterance is relevant or
recognizable, the average power consumption is actually much lower.
For all the traces we obtained with a valid command, the power
consumption is usually about 680mW in this case. The higher power
consumption with irrelevant utterances may be introduced by a larger
search space. For valid utterances, the search space can be
significantly pruned because some very promising search paths can be
identified early.
Speech synthesis: We recorded the power trace for iPAQ when
it synthesized the speech output for speech recognition. The extra
power consumption for the speaker subsystem at maximum volume is
181mW, which is significantly smaller than that shown in
Table III. This is due to the fact that the sound
clip used for generating the table is a continuous flow of music
while the synthesized speech output only uses the speaker subsystem
intermittently, leading to a much lower duty-cycle. The non-speaker
subsystem power for speech synthesis is about 75mW. Compared to
the 383mW extra power required for performing DCT (see
Figure 1), such a speech synthesis is not
computationally demanding on iPAQ at all.
It is worth noting that for many voice commands, the display need
not be on. This means that 82 to 526mW (82+444) power
reduction is possible (see Figure 1). As we will see
in Section 4, speech recognition-based
interfaces are more energy-efficient in many scenarios only if the
display is turned off compared to several other interfacing
technologies.
3.4 Manual Input Techniques
We next characterize the extra energy consumption for various manual
input techniques for text entry. For letter-based input, such as
letter recognition and virtual keyboard, we examine the extra energy
consumption for inputting a letter; for word-based input, such as
Transcriber, we examine the extra energy consumption for
inputting words of different lengths. Table IV
presents the extra energy consumption for inputting a letter.
Figure 2 presents the extra energy consumption for
inputting words of different lengths using Transcriber on
iPAQ. The energy consumption per letter increases slightly as the
word becomes longer due to a larger recognition effort.
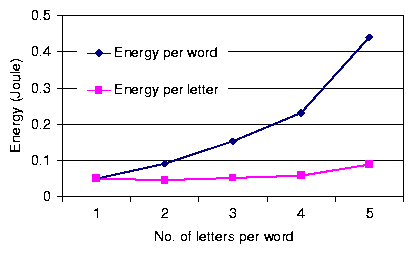 Figure 2: Extra energy per word/letter for Transcriber
The above text-entry methods consume energy through touch-screen
usage and related CPU activities. However, the energy thus consumed
is insignificant compared to that consumed by the LCD, which needs
to be on during text entry. Therefore, the energy cost per letter is
not the only indicator of the energy efficiency of a text entry
method. What matters more is the entry speed, as we will see in
Section 4.
Table 4: Extra energy consumption for inputting a
letter
| Input method | Extra energy (mJ) |
| iPAQ | Zaurus |
| Hardware keyboard | ~ 30 | ~ 50 |
| Virtual keyboard | ~ 10 | ~ 80 |
| Letter recognition | ~ 30 | ~ 330 |
4 A Comparative Study
Based on the discussion of interaction speeds and energy
characterization presented in Sections 2
and III, we next compare the energy efficiency of
different user interfaces. As speech-based interfaces are gaining
ground, we use such an interface as the baseline.
4.1 Output
We first examine the energy efficiency for presenting language-based
information through speech or text.
When the information to be presented is long enough, the
reading/speaking rate determines the duration of presentation. Let
Rspk denote a comfortable speaking rate and Rrd a
comfortable reading rate in wpm. Let Ptxt denote the system
power consumption for presenting text. For simplicity, we assume
that Ptxt is roughly constant for presenting any text. We
ignore the energy consumed to render the GUI for the text. The computer
is basically idle after the text is presented on the display. On the
contrary, the computer has to be active when the text is spoken back
to the user. Let Pspk denote the corresponding system power
consumption.
The ratio of energy consumption for text and speech outputs is
therefore
|
routput= |
Rspk
Rrd
|
· |
Ptxt
Pspk
|
|
|
The following techniques can impact routput: Pspk can be
changed drastically by turning the display on or off or by using an
earphone instead of the loudspeaker; Ptxt can be reduced by
employing aggressive power
management [37,2].
Figure 3 gives different values of routput for
iPAQ and Zaurus under some possible scenarios based on data
presented in Section 3. We assume Rrd=250wpm
and Rspk=150wpm. "Light" indicates that the back light or
front light is on and "PM" or "NPM" refers to whether aggressive
power management [37,2] is
employed or not. The X-axis denotes whether the display, together
with lighting for "Light," is on or off and whether the built-in
loudspeaker or earphone is used for speech output. For Zaurus, the
direct playback power consumption is used as Pspk. Note that
the speech output is more energy-efficient if and only if the ratio
is greater than 1.
For iPAQ, when the back light is on for night-time text reading, a
synthesized speech output through an earphone with the display off
would be more energy-efficient than a text output. For Zaurus, a
speech output consistently consumes more energy for day-time usage
when the front light is not needed. It is more energy-efficient only
when the display does not need to be on.
Its advantage
primarily comes from the fact that the speech output does not
mandate that the power-hungry display be on. On the other hand, it
consumes two to three times more energy if the loudspeaker is used
and the display is left on. The key to improving energy
efficiency for a speech output is therefore to turn off the display
and adopt a low-power audio delivery method other than a
loudspeaker.
When the information is very short, such as short messages and
notifications, the presentation duration is not primarily determined
by the reading/speaking rate but other time overheads for eye/hand
movements and distraction. Therefore, speech and audio delivery can
be very
energy-efficient [11,31]
since it is not visually intrusive and persistent. Such short
messages and notifications, if delivered as GUI presentations, could
interrupt user's ongoing work and require user action to respond,
e.g., to close the popup message box, leading to a larger energy
overhead.
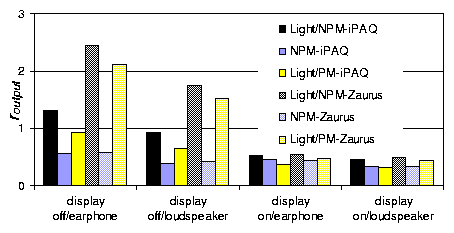 Figure 3: Ratio of system energy consumptions for text output over speech output under different scenarios
Next, we compare the energy efficiency of different input methods.
There are two types of input, namely, text and control.
Text entry: In Section 3.4, we derived
the extra energy consumption for inputting a letter under different
text-entry methods. As pointed out in Section 2.2,
the corresponding input speeds vary a lot. Let Rentry denote
the typical input speed in wpm. Let e denote the extra energy
consumed for inputting one letter using the method characterized in
Section 3.4 and Pidle denote the system
idle-time power consumption. We assume an average word requires six
letter inputs [5], including a space. On the
other hand, let Rspk denote a comfortable speaking rate for
recognition-based input and Precog the system power consumption
during speech recognition. If we ignore the energy consumed during
the delay between the end of speech and the end of speech
recognition, the ratio of the energy consumptions for manual text
entries and speech-based text entries is given by
|
rinput= |
|
= |
Rspk·Pidle
Rentry·Precog
|
+ |
e·Rspk
10·Precog
|
|
|
Obviously, the energy efficiency of an input method is
primarily determined by its input speed.
Although Voice Command is not intended for text entry, we assume
speech recognition-based text entry would have similar power
characteristics and therefore use the power consumed by the Voice
Command recognition process (Precog). Figure 4
plots the rinput for the hardware mini-keyboard (HW MKB),
virtual keyboard (VKB), and letter recognition (Letter Recog.) using
data from Sections 2 and 3. For
each method, four cases are shown. "ideal" refers to typical input
speed without considering error correction; "No LCD" refers to
comparisons to speech recognition with the display off; "No
LCD/Light" refers to night-time usage with the back light on as
compared to speech recognition with the display off. Except for
"ideal," input speeds are expressed in cwpm. The break-even line
with rinput equal to 1 is also shown. For any point above this
line, the speech recognition-based input is more energy-efficient.
From Figure 4, the potential energy advantages for
speech recognition-based text input are obvious since speech is
potentially much faster than any other text input method. However, a
recognition-based input method usually incurs much higher input
errors, leading to a much lower speed in cwpm. For example, the
speed of handwriting recognition is about half the speed of
handwriting. Studies in [8] have shown that
speech recognition speeds of 17cwpm are already available and may
reach 45 to 50cwpm in the near future. If the power consumption
for correcting errors in speech recognition is about the same as the
power consumption during recognition, Figure 4 shows
that speech recognition is already more energy-efficient than letter
recognition and also the virtual keyboard for night-time usage if
the speech recognition-based interface does not require the display
to be on. Moreover, when a speed of 45 to 50cwpm is achieved by
the speech recognition-based interface, it will be more
energy-efficient than most text-entry methods, even the hardware
mini-keyboard.
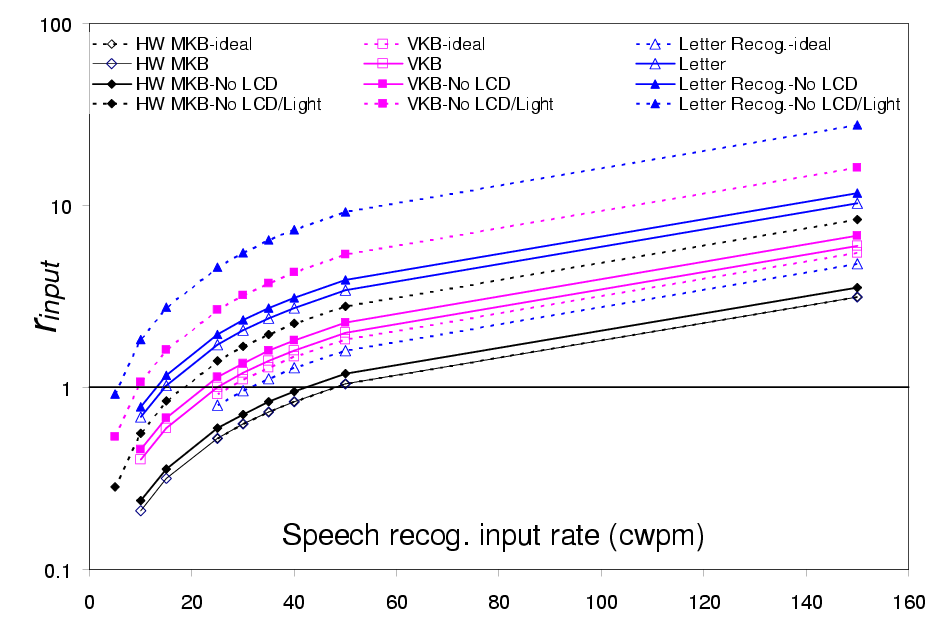 Figure 4: Ratio of system energy consumption for different text-entry methods over speech-based text entry
Command and control: Error correction drastically decreases
the input speed for speech recognition-based text entry, leading to
a much lower energy efficiency. For command/control applications
such as Voice Command, however, errors can be corrected much faster,
e.g., by reissuing the command. Moreover, for such applications,
the recognition accuracy is usually much higher. This leads to a
higher throughput and thus a higher energy efficiency. For a
command/control task, let us assume it may take M stylus taps or
it may take a W-word voice command. Let N denote the speaking
rate in cwpm. Based on the traces collected for PDA
usage [37], we assume each stylus tap is
accompanied by a 750ms user delay, which is mostly an
underestimation for typical menu selections on iPAQ. Moreover, we
assume that the energy consumed by the GUI response can be ignored
compared to that consumed during the user delay. Therefore,
rcc, which represents the ratio of the energy consumptions by
GUI-based and speech-based command/control, is given by:
|
rcc= |
Pidle
Precog
|
· |
M·N·0.75
60·W
|
|
|
Obviously, the shorter a voice command, the more energy-efficient it
is. Figure 5 shows the maximal number of words per command
required so that speech-based command/control is more
energy-efficient than GUI operations with different numbers of taps
under various scenarios. 100% accurate speech recognition with
N=150 is used to draw the "ideal" line. Note that 150wpm is
regarded as the conversational English speaking rate. In other
cases, 95% speech recognition accuracy is used with N=100,
assuming 10 times more energy/time required to correct an error
compared to speech recognition. Such an assumption is pessimistic
since most errors can be corrected by simply reissuing the command.
"No LCD" and "No LCD/Light" have the same meaning as in
Figure 4.
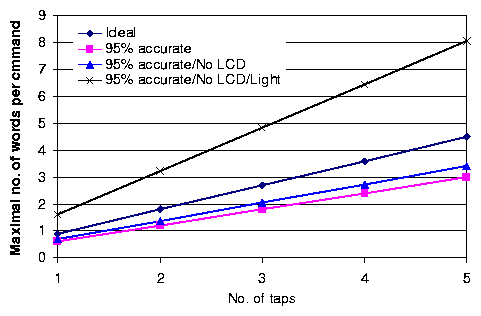 Figure 5: The maximal number of words per
command for better energy efficiency
Figure 5: The maximal number of words per
command for better energy efficiency
Figure 5 shows that a one-word voice command is
more energy-efficient than GUI operations with two or more taps. If
the display can be turned off for speech-based command/control, its
advantage is higher.
Taking notes: Speech and handwriting recognition-based text
entries are mostly hindered by their low accuracy and high cost for
correcting errors. However, if text transcription is not needed in
real-time, e.g., when using audio recording or handwriting to take
a note, it is most energy-efficient to use speech since speaking is
much faster than any other input method. However, if the note has to
be retrieved in the format that it was recorded before recharging,
there is a tradeoff between the energy consumptions for taking a
note and for retrieving it, especially when it has to be retrieved
multiple times.
4.3 Observations
The energy characterization and comparison presented so far have
provided concrete and practical justifications for defining system energy efficiency as [User productivity/Average power
consumption]. Based on such a characterization and comparison, we can
make the following observations for improving energy efficiency.
Speed matters: The faster a task is accomplished and the
higher the user productivity, the more energy-efficient the system
usually is. From this perspective, interface designers share
a significant responsibility for designing an energy-efficient
system. In most cases, improving user productivity may incur
average power consumption increase. As long as the productivity improvement
percentage is larger than average power increase percentage, the system
energy efficiency is improved.
In terms of the specific interfacing methods, speech-based input
stands out since speech is inherently much faster than other input
methods. For recognition-based input, such as handwriting and speech
recognition, accuracy is important due to the high cost of
correcting errors. Thus, accuracy is also important for system
energy efficiency.
Display matters: The energy efficiency for a display-based
interface suffers a lot since its average power consumption includes
that of the display, which is large. Touchscreen/stylus-based
interaction basically integrates the input hardware with the output
hardware, leading to a high power consumption even for making an
input, especially for night-time usage. When the power-hungry
display has to be on with a slow input rate, e.g., for all the
manual text-entry methods, energy efficiency is drastically reduced.
Speech-based interfaces again may enjoy an energy efficiency
advantage since their display usage can be carefully avoided.
The power consumption landscape, however, is likely to change in a
few years due to progress in new display technologies.
OLEDs [10] promise high-quality low-power
flexible displays for mobile computers. More importantly, bistable
display technologies [35,21] will reduce the
static power consumption to nearly zero. This will significantly
reduce the energy that a system spends in waiting for user inputs.
Audio matters: Surprisingly, our energy characterization
results showed that the speaker subsystem is also power-hungry,
drawing as much as 367mW and 422mW of power for iPAQ and Zaurus,
respectively. This power consumption can be drastically reduced by
using earphones instead of loudspeakers. However, the wires
connecting the earphones may impact other usage issues. Since
Bluetooth consumes more than 470mW extra power when actively
transmitting data (see "BT Trans." in Figure 1), a
Bluetooth headset is unlikely to reduce the audio delivery power
consumption. Therefore, for better exploiting the speed of
speech-based interfaces, low-power wireless voice stream delivery
between the user and computer is critical.
5 Interface Cache
In the previous sections, we investigated how human factors limit
energy efficiency for handheld computer interfaces, characterized
different interfacing methods, and presented a comparative study for
them. Since the computer responds to the user much faster than the
latter responds to the former, an increasingly powerful computer, in
terms of display and processor, has to spend most of its time and
energy waiting for a consistently slow user. Such a speed mismatch
is essentially imposed by human capacity and is growing, leading to
a bottleneck in energy efficiency even for a system with a perfect
user interface. The cache solution to address the speed gap between the processor
and memory in conventional architectures [15]
motivated us to design a low-power wireless device, to which the
host computer can outsource simple interactive tasks. As an
interfacing solution to alleviate the energy efficiency bottleneck
due to a slow user, such a device functions like a cache for more
expensive interfaces on the host, reducing interfacing energy
requirements without sacrificing user productivity much. Its design
and prototype are discussed next.
5.1 Wireless Cache for Interfacing
The cache device we designed
and prototyped takes the form of a wrist-watch that communicates
with a handheld computer wirelessly. The watch prototype and its
host, the iPAQ used in the characterization, are shown in
Figure 6.
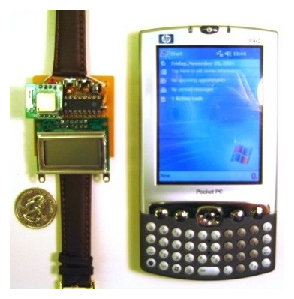 Figure 6: The prototype of a watch as the interface cache for iPAQ
As an interface cache, the watch provides the host computer with a
limited display. It provides two different services: active and
passive. The watch stays connected with the host and waits for user
input for the active service. The user input can be echoed on the
watch in real-time. For passive service, the watch communicates with
the host from time to time to receive data. The connection can be
closed after data transmission but the user can still access the
data cached on the watch. The watch provides its services through a
simple application-layer protocol, called the synchronization
protocol. It is up to the host computer to determine what and how to
display and how the connection is managed using the protocol. The
watch simply follows instructions from the host computer as a slave.
Hardware components: The watch consists of three major
components: a Microchip PIC16LF88 microcontroller, a 2×8
monochrome character LCD, and a Bluetooth-RS232 adapter (Promi-ESD
class II) from Initium [17]. One MAX604 linear regulator
is also used. The system is powered by a 3.6V supply with three
800mAh rechargeable AAA batteries. The microcontroller is run at a
10MHz clock frequency, drawing a current of less than 0.6mA. It
drives the LCD module directly but controls the Bluetooth adapter
through a 9.6Kbps serial port. The LCD module draws a current of
about 1mA. There is no lighting for the LCD module in the
prototype, a limitation of the current implementation that can be
easily alleviated. Therefore, we assume that the LCD module can be
used at night time in the following discussion.
The Bluetooth-RS232 adapter implements the simplest Bluetooth
application profile, the Serial Port Profile (SPP). Two devices with
Bluetooth SPP can communicate in the same way they would with an
RS232 serial port connection. The Bluetooth adapter has a number of
operational modes. When it is not connected or seeking connection,
it is in the STANDBY mode, drawing about 6mA current, but can be
turned off for more energy savings. In the following discussion, we use the
STANDBY mode to refer to both situations. When the Bluetooth adapter
is seeking connection through a Page-Scan session, it is in the
PENDING mode, drawing about 19mA current. In the PENDING mode, it
does Page-Scan for Tps ms every Tpc ms. Tps must be a
multiple of a 625ms slot. Both Tps and Tpc can be
configured through commands from the RS232 serial port, leading to
different average power consumption. When the Bluetooth adapter is
connected, it is in the ACTIVE mode, drawing about 9mA current for
no data transmission and about 28mA during active data
transmission at 9.6Kbps.
Communication design: Since the data for the passive service
are not time-critical, the host buffers data for a certain period of
time and a connection to the host is required only from time to
time. The communication between the watch and its host computer is
not data-intensive and communication occurs only sporadically.
Therefore, energy consumption due to data communication is very
small compared to that required to establish a connection. However,
based on our energy characterization data presented in
Section 5.2, it is more energy-efficient to
disconnect and then reestablish a connection in a cooperative
fashion when the connection is required more than 30 seconds later.
By "cooperative," we mean that both the watch and the host enter
the PENDING mode at the same time.
When the host is connected to the watch, it schedules the next
communication with the watch according to prior-history-based
prediction. It then determines whether the current connection should
be maintained or closed based on when the connection will be
required the next time. If the connection needs to be closed, the
host notifies the watch when it will seek connection next time.
After receiving such a notification, the watch shuts down its
Bluetooth adapter and forces it back into the PENDING mode when the
specified time has elapsed. This ensures that a connection is
established in a cooperative fashion, and keeps the watch and the
host synchronized with a relatively low energy overhead, as we will
see in Section 5.2. If the watch loses
synchronization with the host, they enter the PENDING mode to
re-synchronize.
Software design: The software on PIC is developed using
PicBasic Pro.
In the main loop, PIC reads its hardware UART and interprets
the data according to the synchronization protocol.
Following instructions from the host or user, PIC can
send AT commands to change modes for the Bluetooth adapter.
Software on the iPAQ, called watch manager, was developed
using Embedded Visual C++ and built upon the BTAccess
library [3]. The watch manager functions like a device
driver. On the one hand, it implements the synchronization protocol.
On the other hand, it collects information from different
application software, such as Outlook, according to the user
configuration. The information is buffered in the watch manager and
then sent to the watch when it connects to the host. Each time it is
connected to the watch, the manager schedules the next connection
and notifies the watch through the synchronization protocol.
Interface design: For this prototype, we used very simple
interfaces to support
the targeted services: a 2×8 monochrome LCD and three
tact buttons, Buttons 1, 2, 3. The user can change the watch service mode by clicking Button
3. When the watch is in the passive service mode, a Button 3 click
puts the Bluetooth adapter into the PENDING mode unless the
connection with the host is established. When the watch is in the
active service mode, a Button 3 click simply closes the connection
and brings the Bluetooth adapter back to the STANDBY mode to wait
for the next scheduled connection.
In the active service mode, a Button 1 click clears the display and
sends a negative confirmation back to the host, while a Button 2
click simply sends a positive confirmation. In the passive service
mode, the user can use
Buttons 1 and 2 to browse the text messages cached in the watch. The
interface is better represented as a finite-state machine, as shown in
Figure 7.
In the Auto state, the watch displays valid message entries in its
message cache by
rolling the text messages through the first line of the LCD. Each message is rolled according to its meta-data,
which specify its priority in terms of how many times it has to be
repeated with each display cycle. In the Manual state, the user can use Buttons 1 and 2 to
browse valid entries. Clicking Button 1 induces a skip to the
next valid entry whereas clicking Button 2 rolls the current
message on the LCD by one letter. Double-clicking Button 2 marks the entry currently on the LCD as invalid and confirmed, which
is conveyed to the host next time the watch gets connected to the host.
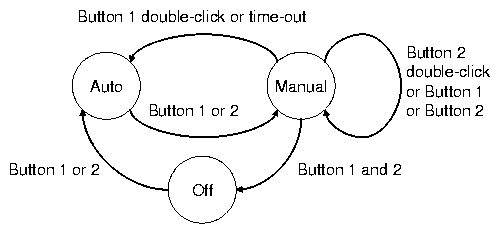 Figure 7: State-machine description of the watch interface
5.2 Evaluation
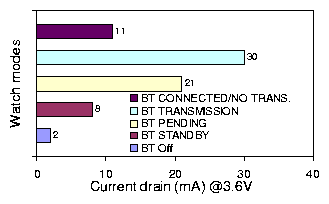 Figure 8: Power consumption for the watch in different modes
We evaluated the prototype watch device as
the wireless cache for iPAQ in order to see whether or by how much
it would improve the battery lifetime of iPAQ. Instead of using user
studies and subjective metrics, we focused on evaluating the design
with related objective metrics. We first present the energy
characterization results and then an analysis of energy-efficiency
improvement.
Since the non-Bluetooth components on the watch are not
power-managed, they draw about 2mA current all the time.
Figure 8 presents the power consumption for the
watch in terms of current consumption at 3.6V when the Bluetooth
adapter is in different modes. Figure 9 shows how
the watch battery lifetime changes when the average communication
interval changes.
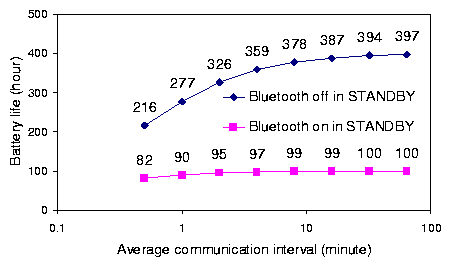 Figure 9: Watch battery lifetime for different average communication intervals
(a) Day-time access without the back
light
|
(b) Night-time access with the back
light
|
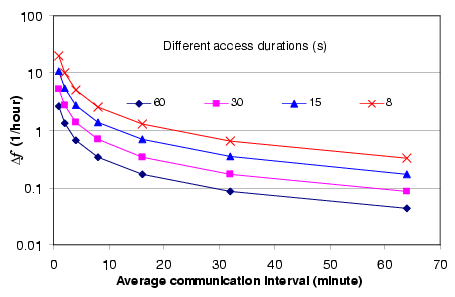
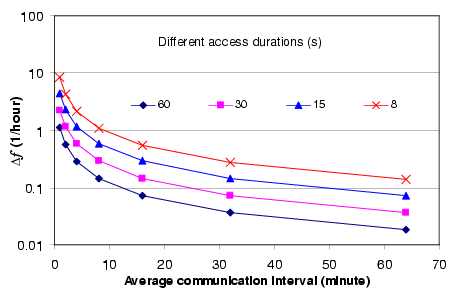
Figure 10: Minimal frequency reduction for improving energy efficiency
Most of the time, the watch stays disconnected from iPAQ and there
is no energy cost for Bluetooth. Assuming a typical 1KB data
exchange each time a connection is made, the time for data exchange
is about 0.118 second. The corresponding energy cost for iPAQ is
84.2mJ (based on a power consumption of 470+244 = 714mW from
Figure 1). Let Tp denote the time it takes the
watch and iPAQ to establish a connection cooperatively and Ts
denote the average interval between two communication events. Note
that when iPAQ is in the PENDING mode doing Paging, the power
consumption is Phost=(84+244)=328mW (see
Figure 1). On the other hand, we assume that if the watch is not used, the user
has to access iPAQ directly at a frequency f with average duration
of Taccess (f < 1/Taccess). The average power consumption,
Ph, of iPAQ during usage, is about (244+82+444)=770mW and
(244+82)=326mW with and
without the back light, respectively. Let Df denote the reduction in the iPAQ access frequency
f due to the use of the watch. Therefore, using the watch improves
the energy efficiency of iPAQ if
|
|
84.2+Phost·Tp
Ts+0.118+Taccess
|
< Ph·Df·Taccess |
| (2) |
where the left hand side gives the extra power consumption in iPAQ
due to Bluetooth activities and the right hand side gives the power
reduction due to reduced iPAQ accesses. Figure 10
plots the minimal frequency reduction in terms of number of accesses
per hour for the cache device to improve the iPAQ energy efficiency
with different average communication intervals (Ts) and average
access durations (Taccess). Based on our measurements,
Tp=2.5s is used. It presents the results for day-time (without
the back light) and night-time (with the back light) access.
Different lines represent different average access durations from
8 to 60 seconds. The figure clearly shows how many accesses per
hour have to be outsourced to the cache device to improve the host
computer energy efficiency. For day-time usage, if the cache
communicates with the host every 30 minutes on an average, the host
energy efficiency will be improved even if only two 30-second
accesses or three 15-second accesses can be outsourced in a day. For
night-time usage, even half the number of such outsourcings will
still improve energy efficiency.
5.3 Design Issues
We have shown how the watch can improve
the energy efficiency for the host with objective measures. Such a
watch is one example of wireless interface cache devices. In the
following discussion, we highlight the important issues involved in
the design of such devices.
Wireless communication: In terms of form factor, wireless
communication between the host and cache devices is almost
mandatory. There are several wireless personal-area network (PAN)
technologies intended for different data rate and application
scenarios. We used Bluetooth in the current watch prototype because
its availability on iPAQ and in the market facilitates prototyping.
Unfortunately, Bluetooth, especially the iPAQ Bluetooth, imposes a
high energy overhead for iPAQ to establish a connection with the
watch.
This issue can be addressed by implementing the iPAQ Bluetooth in a
separate hardware system.
In fact, IEEE 802.15.4 or customized radio modules with a lower
power consumption, shorter connection establishment time or
connectionless communication may be employed to replace Bluetooth
since the required data rate is not high. This, however, requires
extra hardware to be added to iPAQ.
Tasks for outsourcing: User studies will be critical for
determining which tasks should be outsourced to obtain the best
tradeoff between the energy efficiency of the host computer and
complexity/cost of the cache device. First, instead of determining
which tasks should be outsourced, the cache device designer should
instead determine which input/output services the cache device
should provide.
For example, the watch exports its display services through the
synchronization protocol and any iPAQ application can utilize such
services by specifying what to display. This gives application
developers and users most flexibility. Second, even if a task itself
suffers productivity degradation after being outsourced to a cache
device, system energy efficiency and overall productivity may still
be improved. For example, browsing a text message from the watch
will be slower than reading it directly from the iPAQ display.
However, if the overhead for the user to take out the iPAQ and power
it on/off is considered, obtaining information from the watch may
even be faster. As another example, laptop usage has been shown to
decrease when a BlackBerry smartphone is used [13]
because a user can better utilize downtime for productivity, e.g.,
reading/writing emails with the smartphone while waiting in a line.
Battery partition: A simple question for our interface cache
proposal would be: what if we just give the extra battery capacity
of the cache device to the host. In the prototype, such an extra
battery capacity will give iPAQ an extra operating time of about two
hours. The rationale behind a cache device is that we can achieve a
longer system operating time by giving some battery capacity to a
low-power interface cache device. Therefore, when designing an
interface cache device, we must consider the usage patterns of both
the cache and host devices and user's expectations of their battery
lifetimes to achieve the best system operating time. Again, user
studies will be extremely important.
5.4 Related Devices
Similar wrist-worn devices have been designed including the
IBM Linux Watch [16] and Microsoft SPOT
watch [26]. They were intended to be a self-contained
computer system. If viewed as cache devices for interfacing, they
lie on the other extreme of the spectrum, embracing a feature-rich
and power-hungry design. Indeed, the author
of [14] blamed the high price and short
battery lifetime for the lackluster market reception of the
Microsoft SPOT watch. They differ drastically from our design of the
interface cache device, which emphasizes a low-power minimalist
approach. The TiltType wrist device demonstrated
in [9] displays text messages from the computer
using an XML-like protocol. With a similar minimalist approach, it
was investigated primarily as an input device based on TiltType.
None of these devices was proposed to improve the energy efficiency
of the host computer.
Related to the philosophy of using a low-power interface cache
device, Intel's personal server project envisions that the personal
server, a handheld computer-like device, utilizes wall-powered
displays in the environment [34]. Since it
can be much more energy-efficient to transmit user interface
specifications wirelessly than rendering and presenting the user
interfaces, such a parasitic mechanism can be another user interface
solution to overcome the energy efficiency bottleneck due to a slow
user.
6 Related Work
Low-power research so far has offered many solutions
centered around the computer without much regard to the way it
interacts with the user, except a statistical request model. Only
recently, works have been reported for interface devices such as
displays [7,18,36,30,6].
Also, human factors and user interfaces are recognized as having a
significant impact on system energy efficiency. Lorch and
Smith [24] pointed out the importance of using user
interface events for dynamic voltage scaling.
In [36], we characterized the energy consumption of
different graphical user interface (GUI) features on handheld
computers. We pointed out the importance of idle time and user
productivity in system energy efficiency.
In [37], we
also proposed techniques to aggressively power-manage the system
during idle periods based on user-delay predictions.
In [2], the authors implemented an aggressive
OS-based power management scheme for exploiting idle periods on an
Itsy system. Similar techniques were also implemented on the IBM
Linux watch [19].
7 Conclusions
In this work, we presented a comprehensive treatment
of energy efficiency considerations for handheld computer
interfaces. We showed how human capacities impose limits on system
energy efficiency and characterized the energy cost for interfaces
on two commercial handheld computers. Based on energy
characterization, we presented a comparative study of different
interfacing technologies. Specifically, we found that speech-based
input has a large potential for outperforming other input methods
due to the fact that a human can speak much faster than write or
type. On the other hand, a speech-based output suffers from high
power consumption required for audio delivery without enjoying a
significant speed advantage over text-based output. We also pointed
out that the speed mismatch between users and computers and
power-hungry interfacing components introduce a bottleneck in system
energy efficiency. To solve this problem, we proposed a low-power
low-cost device to which a host computer outsources simple, yet
frequent, tasks. Such a device, serving a similar goal as the cache
does for memory, is called the interface cache. We designed and
prototyped a Bluetooth wrist-watch as the interface cache for an HP
iPAQ handheld computer. While most other digital watches were
designed as complete stand-alone computer systems, our watch is
designed purely to serve the host computer. The system functionality
is carefully partitioned so that only minimal functionality is
placed on the watch. Our experiments and analysis show that such an
interface cache will be able to improve the energy efficiency of its
host computer significantly.
Acknowledgments
The first version of the Bluetooth wrist-watch was
designed/prototyped by Lin Zhong with Mike Sinclair while at
Microsoft Research as a summer research intern. The watch was
designed to form a PAN of wireless interfacing devices to provide
pervasive interfacing for a handheld device like iPAQ. The authors
would like to thank all the anonymous reviewers and the paper
shepherd, Dr. Mark Corner, for their suggestions that significantly
improved the paper.
References
- [1]
- Bailey, R. W. Human Performance Engineering: Design High Quality Professional User Interfaces for Computer Products, Applications and Systems, 3rd ed. Prentice Hall PTR, Upper Saddle River, NJ, 1996.
- [2]
- Brakmo, L. S., Wallach, D. A., and Viredaz, M. A. mSleep: A technique for reducing energy consumption in handheld devices. In Proc. Int. Conf. Mobile Systems, Applications, and Services (June 2004), pp. 12-22.
- [3]
- BTAccess library. http://www.high-point.com.
- [4]
- Buser, P., and Imbert, M. Vision. The MIT Press, Cambridge, MA, 1992.
- [5]
- Carver, R. P. Reading Rate: A Review of Research and Theory. Academic Press, Inc., San Diego, CA, 1990.
- [6]
- Cheng, W.-C., and Pedram, M. Power minimization in a backlit TFT-LCD display by concurrent brightness and contrast scaling. IEEE Trans. Consumer Electronics 50, 1 (Feb. 2004), 25-32.
- [7]
- Choi, I., Shim, H., and Chang, N. Low-power color TFT LCD display for handheld embedded systems. In Proc. Int. Symp. Low Power Electronics & Design (Aug. 2002), pp. 112-117.
- [8]
- Commarford, P. M., and Lewis, J. R. Models of throughput rates for dictation and voice spelling for handheld devices. Int. J. Speech Technology 7, 1 (2004), 69-79.
- [9]
- Fishkin, K. P., Partridge, K., and Chatterjee, S. User interface components for lightweight WPANs. IEEE Pervasive Computing Magazine, 4 (Oct.-Dec. 2002).
- [10]
- Forrest, S. The roadmap to high efficiency organic light emitting devices. Organic Electronics 4, 2-3 (Sept. 2003), 45-48.
- [11]
- Gaver, W. W. Auditory icons: Using sound in computer interfaces. Human-Computer Interaction 2 (1986), 167-177.
- [12]
- Gelfand, S. A. Hearing: An Introduction to Psychological and Physiological Acoustics, 3rd ed. Marcel Dekker, Inc, New York, NY, 1998.
- [13]
- Goldman Sachs Global Equity Research. Goldman Sachs Mobile Device Usage Study. 2001.
- [14]
- Goldstein, H. A dog named SPOT. IEEE Spectrum 41, 1 (Jan. 2004), 72-73.
- [15]
- Hennessy, J. L., Patterson, D. A., and Goldberg, D. Computer Architecture: A Quantitative Approach, 3rd ed. Morgan Kaufmann, 2002.
- [16]
- IBM Linux watch.
http://www.research.ibm.com/WearableComputing.
- [17]
- Initium Promi-ESD Class II.
http://www.initium.co.kr/english/promi-esd.html.
- [18]
- Iyer, S., Luo, L., Mayo, R., and Ranganathan, P. Energy-adaptive display system designs for future mobile environments. In Proc. Int. Conf. Mobile Systems, Applications, & Services (May 2003), pp. 245-258.
- [19]
- Kamijoh, N., Inoue, T., Olsen, C. M., Raghunath, M. T., and Narayanaswami, C. Energy trade-offs in the IBM wristwatch computer. In Proc. Int. Symp. Wearable Computers (Oct. 2001), pp. 133-140.
- [20]
- Karat, C.-M., Halverson, C., Horn, D., and Karat, J. Patterns of entry and correction in large vocabulary continuous speech recognition systems. In Proc. Conf. Human Factors in Computing Systems (May 1999), pp. 568-575.
- [21]
- Kent Display: Cholesteric LCD.
http://www.kentdisplays.com.
- [22]
- L. Deng et al. Distributed speech processing in MiPad�s multimodal user interface. IEEE Trans. Speech & Audio Processing 10, 8 (Nov. 2002), 605-619.
- [23]
- Landauer, R. Irreversibility and heat generation in the computing process. IBM J. Research & Development 3 (July 1961), 183-191.
- [24]
- Lorch, J., and Smith, A. Using user interface event information in dynamic voltage scaling algorithms. In Proc. Int. Symp. Modeling, Analysis & Simulation of Computer Telecommunications Systems (Oct. 2003), pp. 46-55.
- [25]
- MacKenzie, I. S., and Soukoreff, R. W. Text entry for mobile computing: Models and methods, theory and practice. Human-Computer Interaction 17 (2002), 147-198.
- [26]
- Microsoft SPOT. http://www.spot-watch.com/.
- [27]
- Microsoft Transcriber.
http://www.microsoft.com/windowsmobile/downloads/
transcriber.mspx/.
- [28]
- Microsoft Voice Command.
http://www.microsoft.com/windowsmobile/downloads/
voicecommand/.
- [29]
- Omoigui, N., He, L., Gupta, A., Grudin, J., and Sanocki, E. Time-compression: Systems concerns, usage, and benefits. In Proc. Conf. Human Factors in Computing Systems (1999), pp. 136-143.
- [30]
- Pasricha, S., Mohapatra, S., Luthra, M., Dutt, N., and Subramanian, N. Reducing backlight power consumption for streaming video applications on mobile handheld devices. In Proc. First Workshop Embedded Systems for Real-Time Multimedia (Oct. 2003).
- [31]
- Raman, T. V. Auditory User Interfaces: Toward the Speaking Computer. Kluwer Academic Publishers, Boston, MA, 1997.
- [32]
- Sears, A., and Zha, Y. Data entry for mobile devices using soft keyboards: Understanding the effects of keyboard size and user tasks. Int. J. Human-Computer Interaction 16, 2 (2003), 163-184.
- [33]
- Starner, T. Keyboards redux: Fast mobile text entry. IEEE Pervasive Computing, 3 (2004), 97-101.
- [34]
- Want, R., Pering, T., Dianneels, G., Kumar, M., Sundar, M., and Light, J. The personal server: Changing the way we think about ubiquitous computing. In Proc. Int. Conf. Ubiquitous Computing (Sept.-Oct. 2002), pp. 194-209.
- [35]
- Zenithal: Bistable Displays.
http://www.zbddisplays.com.
- [36]
- Zhong, L., and Jha, N. K. Graphical user interface energy characterization for handheld computers. In Proc. Int. Conf. Compilers, Architecture, & Synthesis for Embedded Systems (Nov. 2003), pp. 232-242.
- [37]
- Zhong, L., and Jha, N. K. Dynamic power optimization for interactive systems. In Proc. Int. Conf. VLSI Design (Jan. 2004), pp. 1041-1047.
Footnotes:
1Acknowledgments: This work was supported in part by NSF under Grant No. CCF-0428446 and in part by a Princeton University Honorific Fellowship.
|
