
With the prevalence of multi-user environments, it has become an increasingly challenging task to precisely identify who is doing what on an enterprise network. Current management systems that rely on inferring user identity and application usage via log files from routers and switches are not capable of accurately reporting and managing a large-scale network due to the coarseness of the collected data. We propose a system that utilizes finer-grained data in the form of local context, i.e., the precise user and application associated with a network connection. Through the use of dynamic correlation and graph modeling, we developed a visualization tool called ENAVis (Enterprise Network Activities Visualization). ENAVis aids a real-world administrator in allowing them to more efficiently manage and gain insight about the connectivity between hosts, users, and applications that is otherwise obfuscated, lost or not collected in systems currently deployed in an enterprise setting.
Complex systems are hard to understand and visualize. The causes for this problem are due to the specific data not being available or the inability to correlate and present the data in a meaningful and understandable way. Additionally, the administrator faces an overwhelming amount of data to manage especially on large scale enterprise networks. Network connections ranging from a few hundred to several thousand are generated on a daily basis by each host. Tracking down precisely who (users) and what (applications) are responsible for the generation of this network connectivity is a non-trivial task. Administrators need a tool that allows them to sift through massive amounts of traffic logs in a visually appealing and interactive manner that encourages data exploration rather than hindering it.
Despite the abundant amount of data available, the coarseness of the data derived from point-to-point logging does not make it particularly useful. The current logging schemes such as NetFlow [1] data, provide activity details in terms of IP addresses and ports, but are unable to tell which users and what applications are running on the managed network. Since the identity of the traffic flow is important [2], and the users and applications are the essential components of the network, the identity should be associated with the users and applications in addition to the hosts.
It is necessary for the context of a connection, i.e., the user and application responsible for the network activity, to be known rather than simply where (address) it came from and went to. Existing solutions to this problem have involved tie-ins of network flow data and authentication systems such as Active Directory [3] and Kerberos [4, 5]. Critically, these existing logging systems are not geared towards real-world system administration. Network flow data will only detail the where of a connection, whereas an Active Directory and Kerberos tie-in can explain the who. A few visualization and data exploration tools [6, 7] that exist, primarily rely on chaining together network connections based on the flow data. However, multiple hop connections are typically obfuscated due to the nature of network flows; the level of detail supplied is traditionally limited to the IP addresses and port numbers involved.
Rather, a method to interactively explore the inter-relationships of the data so as to gain insight as to what is occurring as opposed to inferring, due to lack of log details or time to trace-back and locate the necessary information, is needed. For example, if an account on a network is compromised then it needs to be known what hosts that user account attempted to log into, along with the applications and programs they attempted to run, and files that may have been modified or touched. Knowing exactly who (users) and what (applications), not inferring from IP and port, at both sides of connections is of particular interest in policy compliance auditing. Being able to present all of this information in a single visual appeasing and manageable view would be a tremendous asset for network administrators.
To facilitate solving the above problems, we present ENAVis (Enterprise Network Activities Visualization). ENAVis is a tool for visualizing the network activities among hosts/domains, users and applications, which is possible through the gathering of local context information. ENAVis offers interesting, ready-to-use, and invaluable functions for monitoring, visualizing, exploring and investigating the activities on a network by real-world network administrators.
Through the use of a highly detailed local context data collection system spanning over 300 machines with a mixture of student, faculty and grid computing nodes on the University of Notre Dame's campus since April 2007, we have collected over 300 GB of raw data and developed ENAVis to allow an administrator to explore this informative data set.
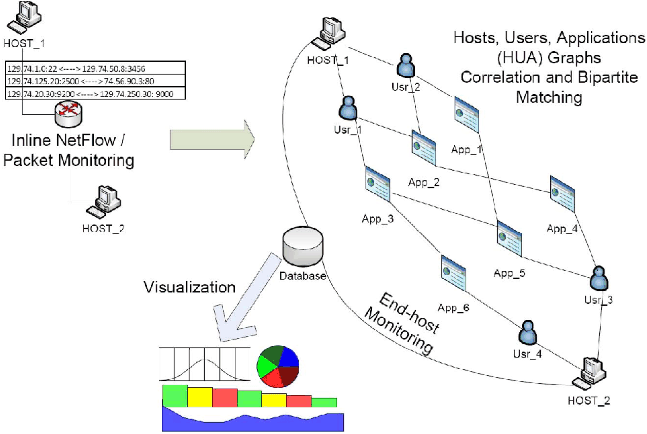
With ENAVis, the administrator is presented with an array of connectivity graphs and statistics on how the network is being used. To assist the user in understanding the many possible visualization modes, we provide a novel meta-visualization which compactly represents and controls how data is represented. By adjusting the Host-User-Application (HUA) control, the user may easily expand, contract, and explore a very rich data space in a visually appealing and highly interactive manner. Figure 1 illustrates the ENAVis approach and how it ties into an enterprise network.
The key highlights of this paper include:
The rest of paper is organized as follows. In the next section we discuss the objectives of our tool, i.e., the design principles and desired functions. We emphasize the problems this paper targets and propose our solutions. We then talk about the design and implementation of the data collection system. Next, the graph model in terms of combinations of hosts/domains, users, and applications is presented. Then we examine several important cases to demonstrate how the visualization tool functions. The design and implementation of functional models of ENAVis are presented in the following section. The related work section compares our system with currently existing tools. Finally, we conclude and suggest future work.
It is good practice for administrators to log the system events and network activities [8]. However, the large amount of data accumulated each day is difficult for human beings to understand and explore. Visualization is therefore an important topic in network and system adminstration since it eases the manual process of going through log data and correlate information and present it in a meaningful way. The objectives of ENAVis is to plot various combinations of the feature/attribute vectors in the log data and provide a customizable and interactive interface for human auditors to explore and investigate the activities that occurred on their networks. Most importantly, a unique inter-hosts/users/processes matching capability included in ENAVis provides the administrator with intuitive information on the dependant relationships, which may help many other important problems such as security tracing and fault localization.
There are two problems which we tackle in this paper. First, there is a lack of tools and data to capture the user and application level of network activities. Second, there is also a lack of tools to visualize and capture the inter-relationships of such data. They are discussed in more detail below.
In addressing the first problem, administrators do not usually lack for log data for security measurement [7]. However, administrators are facing a dilemma that on one side is an overwhelming amount of data, but on the other side many of these data are not at the level of detail they would like. Although there are tools to log network activities in either packet or flow format, there is no light-weight mechanism in current practice to monitor the network at a finer granularity than host-to-host. For example, the network IP addresses included in the packet header only means locators for the machines. It tells nothing about the identities of the end-users. On the other hand, the transport layer's port numbers are also less meaningful in determining the actual end-processes. While using deep packet inspection requires an understanding of all known protocols, it is still unknown which users and applications are sending those data.
Motivated by the observation that the end host has full visibility of the user's processes, our approach to the first problem is to deploy a simple agent on the end hosts to collect these missing local context data for each network connection. The agent is easy to deploy and lightweight in that it is purely written in a bash script that calls commonly available system tools such as netstat and ps. Through careful mapping between each TCP/UDP socket with the user ID and process ID, we associate users and applications with each network connection. The data is then sent securely from each host to a central database server for correlation, analysis and audit.
The second problem, independent of data collection mechanism, is how to understand and interpret the data. The natural question to ask is now that we have the data, how should we visualize it in a more intuitive manner? With the amount of workload on a busy system administrator, being able to quickly browse through the data, view summary statistics and charts, and interact with connectivity graphs can help them very much.
Visualization is the key to solve the second problem, which is the focus of this paper. It is commonly recognized that many of the human errors are due to the lack of understanding of their domain knowledge. A properly designed human-computer interaction can expedite data understanding and improve the exploration process. Our solution is to develop a powerful yet friendly graphic user interface that allows the network administrators to view their network activities at the user and application levels in addition to the topology created by the host connectivity . The design principles of our system are described in the next section.
The target of the system, namely what is to be achieved by this tool, is detailed below:
Know who, what, when and where (4W): The fundamental motivation of the system is for an administrator to know what is happening on their network, i.e., who (which users) are running what (applications) on where (which hosts) at when (what time). All information relevant to the connection context needs to be recorded.
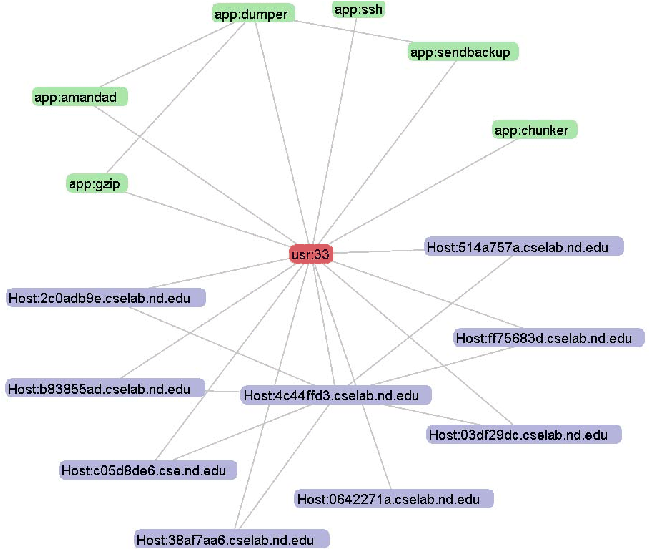
Compute, generate, and trace heterogeneous graphs: In order to visualize the 4W aspects of the data, the tool needs to transform the raw data into an animated graph topology view. The graph is considered heterogenous because each node in the graph can be either a domain, host, user or application and edges are the network connections observed between them during a customizable time frame. Based on user events (such as clicking/dragging a node, applying filtering rules, and filtering number of hops to view from the highlighted node), the graph is instantly regenerated to reflect the changes. Figure 2 shows an example of such a graph. The bipartite matching (pairwise connections between nodes, users, and applications) simplifies the viewing and tracing of the network connectivity relationships among the nodes. Various graph algorithms [9] can be applied to produce interesting paths/cycles based on user activities.
Investigate interactively: Although understanding data and recognizing the patterns among it through visualization techniques such as plotted charts and graphs is important, another important feature designed for the tool is the ability to explore the data interactively. Through only a few mouse operations, the administrator is able to make queries to the database, DNS, and LDAP servers for more detailed information, analogous to ``please tell me more about this.''
Plot charts and report summary statistics: The visualization tool should have the capability to plot charts based on time, host, user, and application information:
The tool would also be able to provide summary statistics based on the daily log data, such as the top and average hosts, users or applications making the most number of connections, and to produce need-attention reports on demand for an administrator's review.
Make it simple, efficient and customizable: Ideally, the tool should be simple yet powerful, usable for real-world administrators.
Consider future extensibility: One potential extension for the tool is to analyze the underlying data by applying various data mining and machine learning techniques. For example, building trees to classify network events, or building clusters to group similar user behaviors, and identifying anomaly based on the model built. The extension for data mining and anomaly detection is an ongoing work and will be included in future releases.
This section describes the type of data we have been collecting and gives an overview of the entire system. It defines and introduces local context. As discussed earlier in the Objectives Section, the first problem we are trying to solve is how to collect the missing context, i.e., to capture the user and application level of network activities (4W). The system we propose ties the user and application identities into the enterprise network management by utilizing existing tools (netstat, ps, lsof), which together build a hierarchical gathering of local context related to network connectivity.
The data gathering component utilizes commonly available tools in order to take advantage of development robustness and administrator familiarity. The tools should augment the existing data significantly, i.e., not just another method to report IPflows or SNMP data.
A natural fit for these criterion is the netstat tool, in essence the equivalent of whois for network connectivity. Moreover, netstat can be coupled with other tools such as the process table via ps (linking process ID to the application and arguments) and the open file handles via lsof (linking the application to files and an alternative method for linking the application to connection). Each of the tools or equivalent is present by default on most major operating systems and each of the tools runs with minimal computational cost.
| Host | Proto | Local IP | Local Port | Foreign IP | Foreign Port | STATE |
| 32dfdffb | tcp | 180.83.70.53 | 33318 | 180.83.46.242 | 636 | ESTABLISHED |
| 57e0a268 | tcp | 180.83.70.224 | 9230 | 162.203.142.116 | 50942 | ESTABLISHED |
| 321fc626 | tcp | 180.83.193.184 | 43825 | 180.83.46.242 | 636 | ESTABLISHED |
| cf58df4b | tcp | 180.83.21.235 | 22 | 242.86.74.143 | 46688 | ESTABLISHED |
| bb326ee6 | tcp | 180.83.21.98 | 39493 | 180.83.46.242 | 389 | ESTABLISHED |
| ad8a26cf | tcp | 180.83.41.162 | 9679 | 17.11.56.128 | 0 | LISTEN |
| 3a677f01 | udp | 17.11.56.128 | 40423 | 17.11.56.128 | 0 | - |
| Start | Stop | UID | GID | i_node | PID | PPID | Direction | Application |
| 1178116633 | 1197926231 | 104092 | 40 | 6875664 | 30525 | 30520 | 1 | firefox-bin |
| 1177746632 | 1197926196 | 108172 | 40 | 29494600 | 16114 | 4325 | 2 | condor_starter |
| 1178046253 | 1178047203 | 119100 | 40 | 12618336 | 15863 | 1 | 1 | mozilla-bin |
| 1190653418 | 1198003091 | 0 | 0 | 5981424 | 27669 | 3669 | 1 | sshd: |
| 1190607911 | 1197926168 | 105273 | 40 | 8121972 | 12901 | 24139 | 1 | vim |
| 1177381883 | 1177381889 | 108172 | 40 | 25103156 | 10615 | 4264 | 0 | condor_starter |
| 1177425206 | 1177867251 | 0 | 42 | 26116251 | 4365 | 3771 | 0 | gdm-binary |
| Path | Args |
| /usr/lib64/firefox-1.5.0.10/firefox-bin | -UILocale en-US |
| /afs/nd.edu/user37/condor/software/i386_rhel30/sbin/condor_starter | -f macbeth.rcac.purdue.edu |
| /usr/lib/mozilla-seamonkey-1.0.8/mozilla-bin | -UILocale en-US |
| /usr/sbin/sshd | [accepted] |
| /usr/bin/vim | exercise1.c |
| /afs/nd.edu/user37/condor/software/i386_rhel30/sbin/condor_starter | -f bach.helios.nd.edu |
| /usr/bin/gdm-binary | -nodaemon |
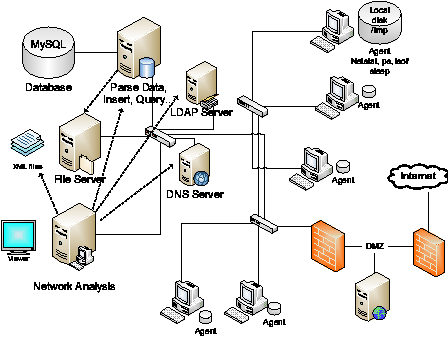
Figure 3 shows an overview of the data gathering and analyzing architecture. Each host employs the monitoring agent whose purpose is to periodically poll the tools and push the locally buffered data to the repository for future analysis. The administrator can then retrieve the data from the repository (or repositories) for the purpose of analysis and forensics from a single vantage point replete with local context. The local context is defined as the information fully detailing a network connection (protocol, src/dst IP/port), user, application, application arguments, and network-related file accesses. The lightweight nature of the system comes from the fact that it provides local context with regards to the presence of connectivity (network and files), not the content passed in the connectivity itself (data payloads, packet headers, etc.).
We now briefly describe the three major tools used in our data gathering system, what each supplies, and how the supplied information can be fused together to provide a complete view of the local context associated with each network connection. Conceptually, one can view the data available from the tools and their fused data in terms of tiers. In the base tier, Tier 1 (simple local context), only netstat data is analyzed. The next tier, Tier 2 (enhanced local context), enhances the local context of netstat to offer increased application information as well as the process tree. The final tier, Tier 3 (complete local context), offers insight regarding potential information flow (what files a connected process is touching) and a more precise identification of the application (exact path, libraries, etc.). An example of the result of the fusion of the data from these three tools as stored in our database is shown in Table 1. [Note 1]
netstat [10], is the most important command utilized to capture each instance of network connectivity occurring on the monitored system. In comparison to the standard rules in the firewall, netstat provides similar information with regards to the connection tuple (protocol, source IP, destination IP, source port, destination port). The State field can be any of the twelve values such as SYN_SENT/RECV, FIN_WAIT, etc., but we focus on the LISTEN and ESTABLISHED state for TCP connections.
ps is the second tier command that is used to supplement the information from netstat. It provides a list of all current running processes. Although the -p flag in netstat provides important information such as the program ID/name responsible for each socket, it does not provide the whole picture. Through another lightweight tool, the ps [11] command, not only is the application name make available, but also the arguments provided to the application can be retrieved. We note that while lsof tool with -i option provides similar information as netstat and ps supply, lsof is not available everywhere and less stable than netstat and ps.
The optional lsof [12] command lists each open file on the current host and provides the third tier of information. By extracting the PID and UID from netstat and/or ps, a linkage can now be made to what files are being accessed for the PID responsible for a network connection. With the help of lsof, a more accurate picture of the application itself can be provided, as noted by the absolute application path (not just the executed command), the libraries, and files touched by the application.
The most interesting aspect of lsof is the discernment of an application's location. From a policy management standpoint, centrally served (ex. NFS/AFS mount) or validated local versions (ex. MD5, SHA1 hash) can reduce the ambiguity associated with applications. The notion of classifying according to application location can offer an additional mechanism for extracting characteristics such as versions of applications. In a broad sense, one could view applications as existing in one of three forms, user local (local directory or user path), machine local (root-level install, ex. /usr/bin), and enterprise served (root-level mounted). The file accesses of the applications noted by lsof can also be categorized in a similar manner.
When the agent component initializes for the first time, it collects an array of system-wide information that is sent back to the central administration server. The information collected includes:
The data collection agent was implemented as a bash script that calls UNIX commands netstat, ps, lsof, and diff periodically. The benefit of implementing the agent as a script is its immediate deployability without any special changes to the network or hosts. MySQL server is set up on an dual-core Opteron box running Solaris 10 with two 400 GB disks. A parsing program written in Java that is used to parse the collected raw data from each host and is inserted into the database using the Java Database Connectivity (JDBC) interface. The structure of the database is composed of a set of tables, each of which stores the output from each of the tools as described earlier in this section.
The data collection agent is deployed on 300+ machines throughout our campus. The machines are a mix of CSE faculties and students office computers, scientific grid computing nodes, and engineering lab machines. The goal was to capture various characteristics ranging from manual human interaction to batch job oriented network connection styles. We have been running data collection over one year since April 2007 with a database size of 300 GB. Although the current state of the deployed agent utilizes only the Linux version of these tools, Solaris and Mac OS X versions have been developed and tested as well, and a native Windows agent is under development.
Concerning the cost of agent deployment, the average CPU usage of the agents observed on hosts in our engineering computer labs where students may log on via console or ssh peaks at four or five percent only when the agent is awakened to call the netstat, ps, lsof and diff. The empirical data suggests that the configurable sampling rate of five seconds is a good balance of granularity of logging and overhead. The memory usage is bound by the usage of those standard UNIX tools. Concerning the diff output size, lsof has the largest volume followed by netstat and ps. As stated earlier, the usage of lsof is optional due to its relatively high expense when compared with netstat and ps. Overall, the average total data size of each host per day is 2.8 MB, or in other words less than 1 GB for each monitored host per year. Moderate disk space requirement allows for one common 500 GB disk to store all data for an entire year on a 500-host network. Since the agents push out the data every 15 minutes in our setting, the total bandwidth consumption for collecting such data is only 120 Kb/s for a monitoring scale of 500 hosts (all hosts within the 120 Kb/s), and therefore the network bandwidth overhead is negligible.
While an event-based model appears more appealing, a bash script that only uses standard UNIX commands is adopted for fast and easy deployment without any modification to the kernel or recompilation for different architectures. On the other hand, our novel usage of diff output (by comparing previous and current calls) achieves the event-based model to some extent because only the difference is recorded, not all data. The difference can be interpreted as the beginning of a new connection/activity or the end of an existing connnection/activity. It is understood that the data collected in this polling scheme may not be perfect and could miss some transient events such as TCP connection state changes. The script is also not the most efficient way of logging compared to a compiled binary program. One of the purposes of the system is to invoke thoughts on what type of data should be collected and how ready-to-deploy and widely available tools can achieve this. It is also possible that we combine the reports from the end hosts with the NetFlow data if we want more accuracy in connection time, direction, packet size, etc. The full visibility at the end hosts provides a richer context (in terms of users and applications) of network connectivity that is not readily available from inline monitoring.
In this section, we lay out the theoretical foundation for the graph representations of the data we collected. We make a unique contribution using a heterogenous graph model that involves mappings between hosts, users and applications (HUA). The interesting graph model can have applications in the area of enterprise network management, security, auditing, problem debugging and fault localization. Figure 4 shows one of the graphs of the network viewed through ENAVis.

The motivation for doing user and application level matching comes from the question: what are the foreign applications and users behind the other side of the connection? It is of particular interest as the traditional packet analysis is not of any usefulness in knowing the identity of applications or users. With our system, the identity (user/application) of both sides of the end-to-end connection can be linked together assuming both hosts are monitored.
In its simplest form, a bipartite matching is found if an established connection recorded on Host A with srcA and dstB matches another established connection record on Host B with srcB and dstA within the same time frame. The time frame can be from a single hour to several days depending on the granularity requirement. It is easy to see that by going through the n records of all established connections and bucket-sorting those records into a destination-based lookup hashtable tabledst will take linear time. Going through tabledst and building a second source-based lookup hashtable tablesrc as described in Algorithm 1 will also take linear time. To create the connection chains, we iterate through all n records; each step requires two lookups in tabledst and tablesrc, which takes constant time. The number of records in tablesrc to be fused and outputted are at most n in the worst case if all n recorded connections occurred between monitored hosts. Therefore, the complexity of the above chaining algorithm is O(n), where n is the number of recorded established connections.
Table 2 shows an example of such connection chaining after the fusion of the log data uploaded by the agents. Each new connection chaining record begins with the start and stop time of each connection and is further divided into the left and the right part. The top part is the local identity in terms of host name, IP/Port pair, user, and application associated with the connection. Similarly, the bottom part is the foreign identity in the same format. Before, at one end of the connection (say at server side), the identity of who connecting to the server is vaguely inferred from the IP/Port pair (assuming only user A can use that client machine). Now, the identity of who is connecting to a host can be precisely known from the bipartite matching (no longer inferred from the IP/Port). Which user and what application are revealed at both sides of connection. This is useful in evaluating the effectiveness of the enforcement of the existing policy on the enterprise network.
| Start | Stop | Location | Host | IP/Port(proto) | User | Application |
| 1177527137 | 1177527148 | Local | 211fba9b | 180.83.12.112/631(tcp) | 0 | cupsd |
| Remote | 3a9d336a | 180.83.12.178/34406(tcp) | 97392 | gnome- pdf-view | ||
| 1177543303 | 1177543309 | Local | 211fba9b | 180.83.12.112/631(tcp) | 0 | cupsd |
| Remote | 06baa7ef | 180.83.12.85/35775(tcp) | 92362 | gedit | ||
| 1177448975 | 1177449026 | Local | f464cee2 | 180.83.183.147/54427(tcp) | 105464 | parrot |
| Remote | c9c6e734 | 180.83.159.14/9094(tcp) | 108172 | chirp_server | ||
| 1177391778 | 1177391807 | Local | 0642271a | 180.83.12.72/40096(tcp) | 33 | dumper1 |
| Remote | 38af7aa6 | 180.83.12.241/33084(tcp) | 33 | amandad | ||
| 1177392075 | 1177392151 | Local | 0642271a | 180.83.12.72/40211(tcp) | 33 | dumper3 |
| Remote | 2c0adb9e | 180.83.12.172/38429(tcp) | 33 | gzip | ||
| 1177392075 | 1177392151 | Local | 0642271a | 180.83.12.72/40212(tcp) | 33 | dumper3 |
| Remote | 2c0adb9e | 180.83.12.172/53342(tcp) | 33 | sendbackup | ||
| 1177515292 | 1177515299 | Local | b83855ad | 77.46.16.81/36019(tcp) | 317 | httpd |
| Remote | b83855ad | 77.46.16.81/1521(tcp) | 27 | oracletestdb | ||
| 1177610657 | 1177611222 | Local | c9c6e732 | 180.83.159.108/9094(tcp) | 108172 | chirp_server |
| Remote | ad8a26cf | 180.83.41.162/49857(tcp) | 102744 | condor_exec.e | ||
| 1177610633 | 1177610638 | Local | c9c6e733 | 180.83.159.135/9710(tcp) | 108172 | condor_schedd |
| Remote | ad8a26cf | 180.83.41.162/9788(tcp) | 108172 | condor_startd | ||
| 1177625404 | 1177625765 | Local | c9c6e733 | 180.83.159.135/9314(tcp) | 102744 | condor_shadow |
| Remote | ff75683d | 180.83.12.132/9868(tcp) | 108172 | condor_starter | ||
| 1177548953 | 1177548992 | Local | af8f7bb2 | 180.83.12.155/34479(tcp) | 97464 | ssh |
| Remote | 633bfecc | 180.83.12.167/22(tcp) | 0 | sshd:root | ||
| 1177459056 | 1177459112 | Local | 06baa7ef | 180.83.12.85/34739(tcp) | 92362 | gedit |
| Remote | 211fba9b | 180.83.12.112/631(tcp) | 0 | cupsd | ||
| 1177541462 | 1177541473 | Local | 06baa7ef | 180.83.12.85/35714(tcp) | 0 | ssh |
| Remote | 633bfecc | 180.83.12.167/22(tcp) | 0 | sshd: root |
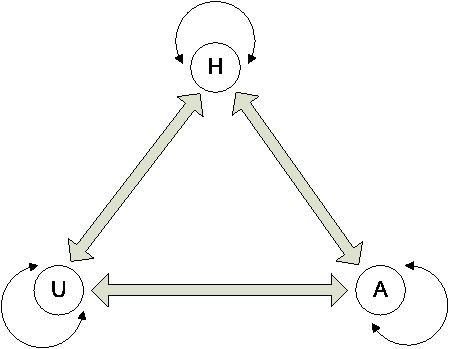
Once we have collected and matched enhanced connectivity information, the next step is to visualize the network connections in the form of a graph. However, while we have a rich pool of data containing the entirety of host, user, and application connectivity, it is not desirable to view all the data at once. For instance, we may only want to view how users are interacting or perhaps would like visualize which application mix is being executed and by what hosts. To that end, we have created a novel control tool based on three core node characteristics, i.e., hosts, users, and applications (HUA), as illustrated in Figure 5. At the top, we have H denoting the host level chaining. This is also the most common scenario, in which all the connectivity
The interesting exploration continues when we consider the various combination of the states shown in Figure 5, namely a heterogenous graph containing the hosts, users, and applications (HUA). We can imagine a 4D space, where the time, host, user and application interact with each other. We briefly discuss these graphs below.
H: At a higher layer, we have the host connectivity, basically denoted by traditional IP/port pairs among servers and clients. Using H only is analogous to a connectivity view offered by NetFlow data.
U: At the middle layer, we have the user connectivity, in which we can observe the connectivity relationships among the users. Because multiple users can log onto the same machine and a single user can log onto multiple machines, by treating an enterprise user (no matter how many physical hosts they have logged on) as one single entity node, we are able to observe the overall network activities among users.
A: At the bottom layer, we have the application connectivity, in which we can observe the connectivity relationships among applications. A simple example would be which browsers are interacting on my intranet web server (i.e., Firefox 2.0, Internet Explorer 7, etc.) without worrying about user-agent spoofing. Similarly, what applications (and their versions) are checking out licenses from my license server?
HU: The first mix-mode is the interaction between users and hosts. As we said earlier, a user can log on multiple hosts and a host has multiple users simultaneously logged in. There are two options for constructing such HU graphs. First, we simply merge the H and U graphs. This `glue' process is done by constructing an edge between the user and the host only if that user has made at least one connection on that host. A simple graph example is illustrated in Figure 6. Notice there is no ambiguity in who causes the traffic between host 1 and 2 because the connectivity forms a simple cycle (i.e., no vertex is traversed twice) that covers both vertices H1 and H2. For example, we know user 2 on host 1 has connections with user 4 on host 2, but user 1 cannot have connections with user 4 because a simple cycle is not formed. Note that this is only true when both host 1 and 2 are running the agents. If there is an external domain not under our control, there can be ambiguity in this representation, as shown in Figure 7. Therefore, the second graph representation of the data is constructed by simply removing the edge between hosts, taking the observation that there must a user associated with each connection on a host. Host nodes can be reached from the user nodes.
HA: Similar to HU, hosts and applications can be used to construct a connectivity graph when users are of less concern. Constructing HA graphs is similar to constructing HU graphs.
UA: The concept of location of physical hosts becomes less relevant as the real players on the network are the users and applications. In this case, we can temporarily filter out H and only leave UA because we are more interested in who (users) and what (applications) are running on the network. UA graphs is therefore a perfect choice. Constructing such graphs are similar to HU and HA.
HUA: Lastly, building hosts, users and applications into one graph provides the most comprehensive view as we show in later case studies. Constructing such a graph is just merging H, U, A graphs by using user nodes as the `glue' for host and application nodes, i.e., an edge is drawn between a host and a user and between a user and an application if the user on that host has made at least one connection using that application. An edge connecting two application nodes represents the network connectivity between their respective users on two end hosts.
We discuss several cases scenarios in which ENAVis can be helpful in local network management. The graphical exploration reduces the tedious, error-prone nature of log checking and mapping down to a few mouse clicks, which makes administrators' life much easier. With the capability of correlating hosts, users and applications through interacting with HUA graphs and straightforward statistical charts offered by ENAVis, the investigation carried out by the system and network adminstration can be confined to O(1) steps and does not have to hop through O(n) hosts in scale of a distributed system. Figure 8 illustrates the benefit of ENAVis visualization.
We will study several cases in detail with supporting graphs and data from using the tool. These scenarios are
The management needs to know whether their employees have complied with the company's network usage policy with regards to finance information compliance. Specifically, the administrator is requested to provide a report of whether the mechanisms are adequate for enforcing the current policy. For this case study, consider a financial intranet server whose access policy is defined such that only authorized users can access or even see the financial system. To that end, a set of host-based firewall rules are put in place on the finance server (finance.nd.edu) with restrictions to the hosts of authorized finance personnel (concert.cse.nd. edu, striegel) on the company campus.
Current approach: First, the admin checks that the firewall rules (IP/port) settings are correct for the finance server through the application of a policy rule visualization tool such as [13]. Once the rules are validated, the administrator checks the ipfilter log and NetFlow log data to ensure that only authorized hosts accessed the server. Upon only seeing authorized hosts on the list (concert), the admin concludes that the policy is sound and not violated.
ENAVis approach: Unfortunately, the earlier approach is only sufficient if the host to user mapping stays consistent, i.e., only user striegel uses the host concert.cse.nd.edu. If host to user mapping is dynamic or unclear, the notion of host as identity quickly breaks down (see Figure 9). Suppose in the same environment that ssh connectivity was enabled on the network. In the scenario of Figure 9, an unauthorized user qliao connects from IrishFB.nd.edu with X11 forwarding to concert.cse.nd.edu and launches an instance of firefox to access the finance web server. In a multiuser environment, where multiple users are logged onto the same machine and make network connections, other tools have no way of differentiating those connections because the connections all have the same source IP. Similarly, the legitimate user striegel may carelessly connect from a Starbucks shop to his office desktop concert in order to access a financial account just for convenience. Neither of these two cases is desirable and is a violation of the policy because the original intent of the policy was that anyone not part of the finance department should not be able to access the finance host.
The tiered graph created with ENAVis includes nodes representing hosts, users and applications, taking advantage of our data which records every UID and PID associated with each network socket created. Since each connection tuple now is expanded to be {time, proto, src_ip/port, dst_ip/port, usr, app}, we have finer granularity on the policy control on the user and application level in addition to the host level, which can be clearly seen from the ENAVis graph (Figure 9). The admin is able to find the problem which is not offered by other tools, namely the unintentional configuration of concert with no ssh restriction causes the violation of the policy.
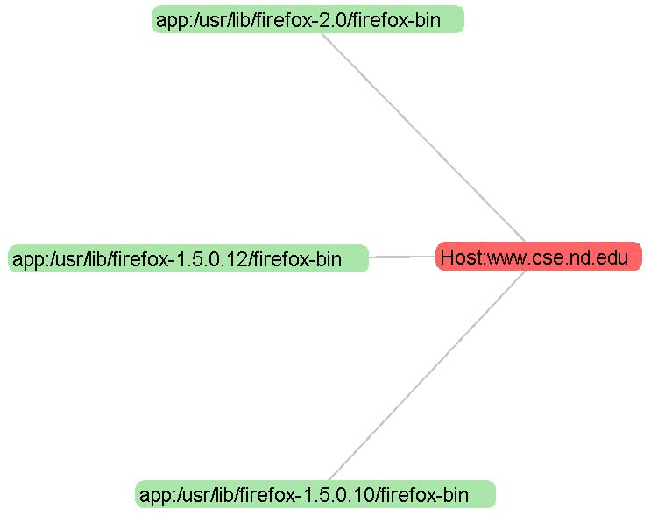
In addition to policy compliance checks at the host and user level, another side benefit is to check the policy compliance at the application level. Consider the case when the admin wants to make sure only the most up-to-date version of applications are approved for use on the network (see Figure 10 for an example). There have been known vulnerabilities in earlier version (1.5.x) of firefox and the policy states users must use the properly patched version. A simple HA graph would reveal any non-compliance with this policy by looking at the applications connecting to the web server. In addition to vulnerability control, it is also useful for license management. Usually, the organization buys a fixed amount of licenses from the software vendors. The license server should only check out a license to legitimate users and newest version of the application software. Our tool makes it possible to track this type of compliance as well.
In this scenario, users file a case report to the system administrator complaining about the network being slow.
Current approach: The admin pulls the MRTG data through SNMP queries to the routers, and determines everything looks fine. The routers only has 30% of traffic load. Since the bandwidth slowness was reported five hours ago, the admin searches the NetFlow log data trying to locate the problem host. Finally, the admin locks down two problem hosts: one is a graduate student's desktop and the other is a machine in a lab.
For the graduate student's machine, the admin is pretty sure that student is the cause, thus she sends out a warning message to that student for a suspected violation of the network usage policy and if the user does not comply his network port will be shut down. For the machine in the computer lab, unfortunately it is in a multi-user environment. The admin has to decide who has been on it during the problem time period. She spends much of her time searching the ssh logs and correlating the logging information with a central box such as a Kerberos server trying to find who was logged in during that time. Finally, the admin narrows the search down to 10 users that have been on the system during the two hours of heavy use.
Needless to say the process is tedious. Imagine if the admin has 1000 machines and an administrator has to log onto each one to look at the ssh log, it will waste tremendous amounts of time. The process is also less fruitful because the admin cannot determine if the increased network connectivity is due to a legitimate reason (i.e., research experiments, etc.) or illegitimate purpose (i.e., illegal file sharing, etc.).
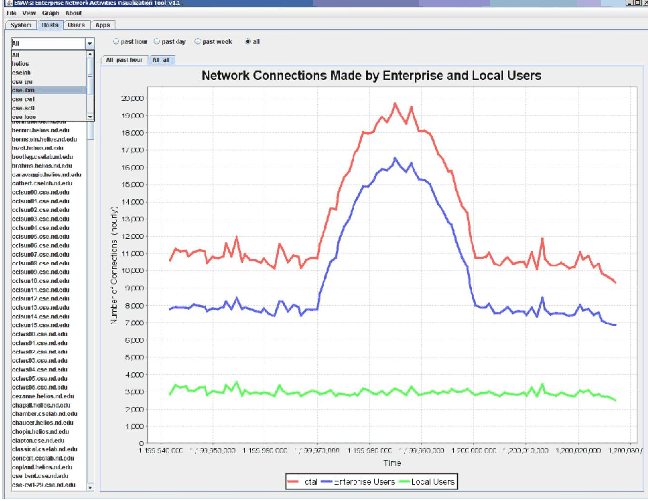
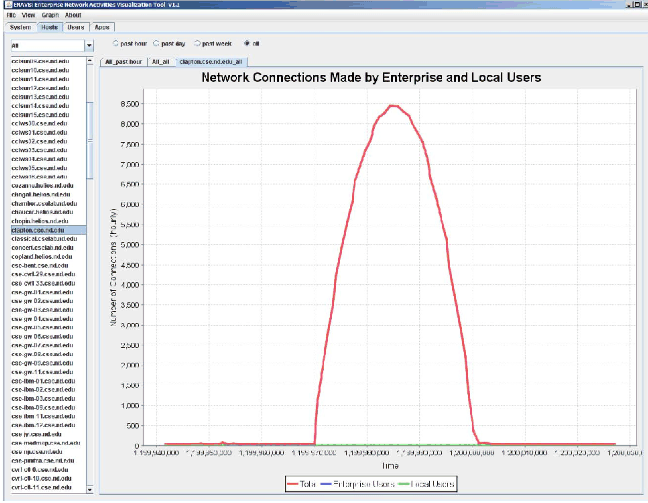
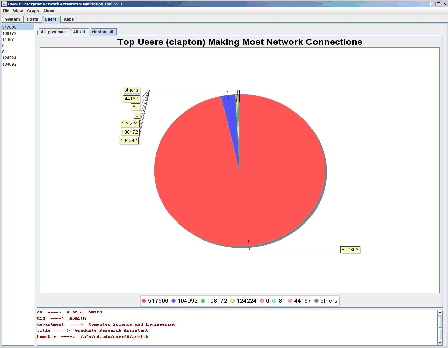
ENAVis approach: The admin loads the most recent data collected by the agents into the visualizer and has a quick plot on the number of connections across her network (Figure 11). The admin clearly sees a spike between January 10, 2008, time 9:00 and 16:00, which matches the network slowness complaints that users had reported. The increase in network activities is mainly contributed to an enterprise user. The admin selects each cluster from the drop-down menu and quickly narrows the search down to an abnormally busy host: clapton.cse.nd.edu (Figure 12). By simply clicking on the host name, a pie chart is automatically plotted to reflect the top users on the host clapton.cse.nd.edu, as illustrated in Figure 13. On the left pane, all users
The admin clicks on the problem user ID, two things happen. First, the tool automatically performs an LDAP lookup (it will check a local cache first to avoid excessively hitting the LDAP server) and displays the user information on the bottom of the graph (i.e., the user's first/last name, department affiliation, user name and AFS directory, etc.). Second, it automatically plots a pie chart (Figure 14) showing the top applications that user had used to make network connections. It is straightforward to see from the chart that the file sharing program BitTorrent and Gnutella constitute the top two applications that the user asmith had used. By now the problem has been traced to the source and the necessary action as dictated by the compliance policy will take place. All the admin does is less than ten mouse clicks. The graphical visualization and automation makes the admin quickly pin down the problem source without a tedious manual search process. The central correlation of the user and application information is the key.
A phishing email pretending to be from the IT department claims they are updating the system and require all users to send in their passwords, or their accounts will be suspended. A naive user believes this scam and therefore his password is suspected to have been compromised.
Current approach: The system administrator needs to find out which hosts the compromised user account has used. Have those hosts been compromised as well? What applications did that user invoke? What data files did this user account touch during the past two weeks since the user revealed his password? The admin must make sure the student/faculty's sensitive information and intellectual property was not leaked from the network. In order to do this, the admin checks a centralized server such as an Active Directory or Kerberos 5's log file. Fortunately, the log file is still there, and the admin can then manually search and find all hosts that user has been trying to log into via the ssh pluggable authentication modules (PAM). The admin logs into each machine and makes sure they are clean. However, the admin has no idea what files have been read/modified or been sent out to external hosts. The admin also does not know what applications have been run by that user account because the data is not available.
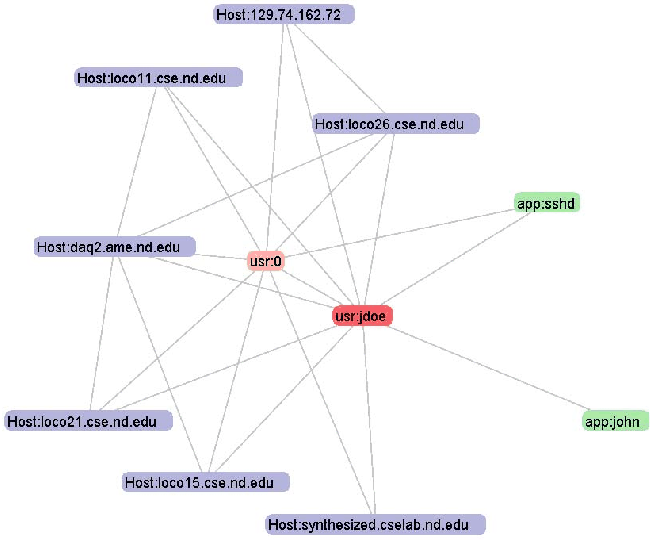
ENAVis approach: The admin simply generates a network graph by selecting the HUA from the graph menu. The admin highlights the problem user node (jdoe) (as in Figure 15). It is straightforward to see which hosts the user has touched during the time frame and what applications the user used. The file access information logged by lsof is not available to other tools, neither in a centralized authentication server nor in the normal end-host's access logs. Although we do not normally plot the lsof data, each file accessed by that user is kept in the master database. Therefore, a single query would reveal all files that user ID has touched among all the hosts. In this case, a visual graph is very helpful to see what hosts and users that a compromised user account has contacted and which applications it has attempted to launch. This helps expedite significantly such an investigation should it occur.
There are a few other potential uses of the tool, which we briefly cover here. For example, network fault localization. By comparing and contrast the difference between a working set and a problem set of network connectivity graphs, a system administrator would be able to detect the possible causes of network faults. Another example would be forensic auditing. The detailed user activities recorded in database may provide evidence when it is needed by some government agency.
Data mining is another potential use of our tool to detect possible anomalies in the network by invoking data mining and machine learning algorithms built into the tool (future work). The tool automatically colors nodes (hosts, users, applications) based on the clusters. Various classifiers kick in to evaluate the risk scores of the network events. It then generates a report that needs the attention or possible action by the management team.
This section describes the implementation of functions of each module in the viewer [Note 2] and how they can be used to explore the local context of monitored networks. The visualization tool was implemented using Java. The plotting functions utilized JFreeChart [14] and the graph animation was build on top of Prefuse [15], both are free open-source Java libraries.
As mentioned earlier, the tool should provide a quick summary of the past history, a time window defined by the user, and provide extensive reports on statistics of the hosts, users, and applications. The start and stop time of an investigation can either be specified as the command line arguments or simply selected from a GUI calendar object within the tool's interface. The tool then scans through the local disk to check if it already has the data files for the specified time range. If not, those files will be downloaded on demand in the form of either XML or comma-separated files at the user's choice. The ``Update'' button causes the tool to synchronize with the data file server.
The ``Hosts'' tab, shown in Figure 11, presents an overview picture on the number of network connections made by either enterprise users or the local users. On the left pane, administrator can select a set of predefined physical clusters (or all nodes in the network) from a combo box (drop-down list), which in turn propagates a complete list of monitored hosts within the cluster, where the user can select each specific host to view.
After selecting which host, cluster, or all monitored nodes, the user can further specify the time granularity of investigation by selecting one of the four radio buttons on top, i.e., ``past hour'', ``past day'', ``past week'', or ``all''. Based on the selection, a line chart is automatically refreshed to reflect the change. The different colors of lines, as indicated in the legend box at the bottom, indicates whether it is made by enterprise users or the local users. The differentiation of enterprise and local users is through querying the LDAP servers. The query results are cached locally to ensure any future lookup on the same UID will not hit the LDAP server.
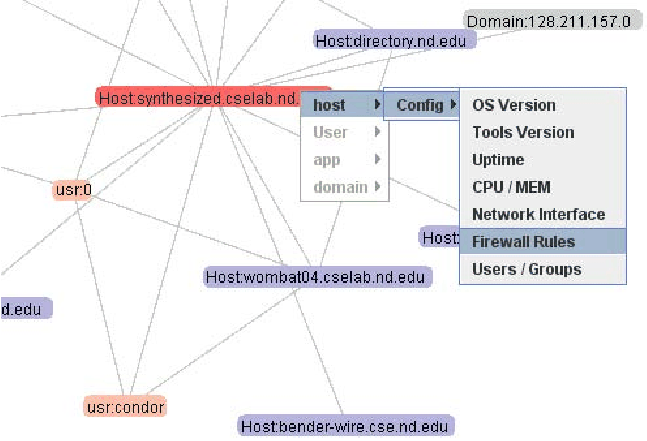
Each host configuration information can be displayed by right-clicking the host name in the list, and choose ``configuration'' fromthe pop-up menu. This triggers a query against the database host information table that return a complete list of a host's system statuses collected by the agent. The information currently stored for each host is: OS type and version, patch level, up time, local user and group info, firewall (iptable) rules, ethernet and network addresses for each network interface, hardware (CPU/mem/disk) information and versions of various system tools; as described in the Data Collection part of the paper. This functionality gives a quick and handy way for the system administrator to view each system status within the tool without requiring logging into each machine separately.
While graphical visualization is great, the option of being able to examine the raw data is always handy just in case the investigator needs to. Therefore, a table view is provided within the tool interface to display all raw connectivity records.
Based on the various combination of hosts/clusters and time frames selected in the ``Hosts'' tab, the ``Users'' tab shows a vivid percentage summary as a pie chart for the top n users that are making the largest number of network connections. Figure 13 is one screenshot. The bottom frame shows a summary of user information: first/last name, netID, AFS home directory, department affiliation and job title, which are pulled from the enterprise LDAP server with the similar cache scheme described earlier.
The investigation flow continues in ``Apps'' tab (Figure 14), which shows a classification on the top applications run by a specific user. The pie chart tells a network administrator what is running on his network, e.g., are they mainly web browsers, email clients, printers, office software, or condor batch jobs, etc.? Presumably, different users have different behaviors in choosing personalized applications for network accesses. This is especially interesting for data mining and anomaly detection.
The network graphs, a significant feature included in the viewer, are supported by the open source Prefuse [15] library. We perform the bipartite matching on the nodes and transform the data into the GraphML format [16]. A heterogenous graph view of the network connectivity graph is presented earlier in Figure 4. On the right pane is a control tool set that can adjust the animation of the nodes interacting with each other by setting drag force, spring length, etc. The view can also zoom-in/out and be dragged around.
The connectivity filter allows the viewer to display only the number of hops from the question node. The hop count can be increased to give an extended view of the connected components in a larger chaining path. The node filter allows an investigator to select an arbitrary node (host/domain, user, or application) in the graph from a combo box rather than trying to locate a node in the graph itself.
The interactive feature is introduced to each generated graph through right-clicking on nodes. The menu is enable/disabled based on the context of the node type. For example, for a host node shown in Figure 16, one can query the database on-demand by simply select an item in the popup menu.
Broadly speaking, the network monitoring and analysis can be categorized into two models. In the first type, in-network devices record and collect data using tools such as tcpdump or Cisco's NetFlow [1] profiling. The other type is end-host monitoring using an agent mechanism. The end-host monitoring approach has the advantage of being able to see more information than inline monitoring since it has full visibility of the network activities occurring on each host. We adopted the latter model for our data collection system.
sFlow [17] uses agents on switches/routers to log packets and send the logs to a central collector for analyzing. However, the traffic monitoring is at the packet level, thus missing the local context information for each connection. Another network traffic data visualizer is Multi Router Traffic Grapher (MRTG) [18] that monitors router traffic in a graphical form based on SNMP-enabled devices. There are also a few other visual analyzers based around using NetFlow's data. ISIS [6] is a tool that visualizes temporal relationships among network flow data by using a timeline and event plot. By plotting time in combinations with IPs, ISIS trys to find correlations between events to aid investigations regarding network intrusion. NVisionIP and VisFlowConnect-IP [7] have also been developed to visualize NetFlow data. As stated earlier, the key weakness of NetFlow data is the missing user and application information, which we posit is critical for enterprise network management.
Visualization techniques have been applied to view static data, such as distributed firewall rules to detect potential conflicts or anomalies. PolicyVis [13] is a visualization tool for inspecting firewall rules. It helps detect policy anomalies by plotting IP addresses and port numbers specified by the firewall rules in a 2D space and looking for overlap. We are in line with one of their motivations that visual inspection can be useful in understanding the otherwise complicated relationships among this form of data. Instead of visualizing policy rules, we visualize the dynamic data, which is the actual network activities made by users' applications. The visual analysis done on the empirical data is a substantial and necessary supplement to the static rules inspection as a proof of correctness to the policy rules.
Beyond the analysis of network data, various clean slate efforts have attempted to bring identity into the network flow. Among the re-architecturing attempts in the enterprise network, SANE [19] and Ethane [20] take a drastic approach in that instead of using a traditional layered approach, a single protection layer governs all connectivity within the enterprise. The enforcement of enterprise-wide security policies is done at the link layer. User authentication to a centralized server and switch-level source routes are mandatory to access services and end hosts. Within a SANE enterprise, IP address are not used for identification, location, or routing.
Finally, out of the various related works, perhaps the works closest to ours are those of [21] and [22]. In [21], the authors propose capturing the inter-dependencies among network components in `Leslie graphs,' based on the original dependency work of Lamport. The ``black-box'' approach relies on the correlation of observed network traffic to infer system dependencies. The agents in their system called AND perform temporal correlation of the packets sent and received by the hosts; where the central server engine performs Bayesian inference from the reports generated by the agents. While these works mainly focus on computing the dependency graphs for fault localization (i.e., debugging the location of network failure or sluggish performance), our system focuses on the lightweight aspects of information gathering and how to visualize not only connectivity but, the context of the connectivity itself. In short, while these tools help to locate dependency-related performance problems at the host-level in a theoretical sense, ENAVis provides a robust platform for exploring and visualizing the connectivity data for a much wider assortment of security and performance-related issues.
It is desirable, yet difficult, to know exactly who and what is running on an enterprise network. In current network architecture, the identity of user and application in network flows is inferred from a packet's content (i.e., IP addresses and port numbers) rather than directly from the context (user processes) that actually make those connections.
In this paper, we describe a network local context data collection system and ENAVis, an Enterprise Network Activities Visualization and analysis tool. In addition to the regular analysis functions provided similarly by NetFlow and packet monitoring tools, ENAVis offers interesting new features of visual analysis on the user's and application's level. Connectivity graphs in combinations of hosts, users and applications capture the dynamic interactions among these essential components in the network, and provide an interactive exploration of the network connection log data. Future work is planned to incorporate data mining techniques into the tool to aid in automatic analysis of the data.
The authors would like to thank Curt Freeland, faculty specialist at CSE department of University of Notre Dame, for helping deploying the system. Special thanks to Adam Moskowitz and the anonymous reviewers for their insightful comments.
This work was supported in part by the National Science Foundation (CNS-03-47392, CNS-05-49087) as well as a Sun Academic Excellence Grant (AEG) (EDUD-7824-080234-US).
Qi Liao is a Ph.D. student at the Computer Science & Engineering
department of the University of Notre Dame. His current research
interests include computer security, network management, data mining
and economic applications on networks and security. He received his
master degree in computer science and engineering (MSCSE) from
the University of Notre Dame, Indiana. Qi graduated with a B.S.
and Departmental Distinction in Computer Science from Hartwick
College, New York, with minor concentration in Mathematics. He
is a member of Kappa Mu Epsilon and Upsilon Pi Epsilon.
Reach him at  .
.
Andrew Blaich is a Ph.D student at the University of Notre Dame's
Computer Science and Engineering Department. His research interests
are focused on computer security and networking; with current work
being done on network management. He received his B.S. and M.S. in
Computer Engineering from Villanova University. Andrew can be reached
at  .
.
Dr. Aaron Striegel is currently an assistant professor in the
Department of Computer Science & Engineering at the University of
Notre Dame. He received his Ph.D. in December 2002 in Computer
Engineering at Iowa State University under the direction of Dr. G.
Manimaran. His research interests include networking (bandwidth
conservation, QoS), computer security, grid computing, and real-time
systems. During his tenure as a student at Iowa State, he worked for
various companies in research and development that included Sun
Microsystems, Architecture Technology Corporation, and Emerson
Process. He has received research and equipment funding from NSF,
DARPA, Sun Microsystems, Hewlett Packard, Architecture Technology
Corporation, and Intel. Dr. Striegel was the recipient of an NSF
CAREER award in 2004. Dr. Striegel can be reached at  .
.
Douglas Thain is Assistant Professor of Computer Science and
Engineering at the University of Notre Dame. His research interests
focus on harnessing large scale computing systems such as clusters,
clouds, and grids to attack large problems in science and engineering.
Dr. Thain received the Ph.D. from the University of Wisconsin in 2004.
He can be reached at  .
.