LISA '05 Paper
[LISA '05 Technical Program]
Towards Network Awareness
Evan Hughes and Anil Somayaji - Carleton University
Pp. 113-124 of the Proceedings of LISA '05:
Nineteenth Systems Administration Conference,
(San Diego, CA:
USENIX Association, December 2005).
Abstract
Network and system administrators need to analyse network traffic
for maintenance, security, and planning purposes. The volume of data
on modern networks, however, make such analysis extremely difficult
using existing open source tools. In this paper we argue that
administrators need tools that will allow them to be more aware of the
state of their networks, and we describe our vision for tools that
would support such "network awareness" by analysing and visualising
packet aggregations that are defined by both packet headers and
payloads.
As a first step towards such tools, we have developed a library
called qcap, a framework for packet and stream
reconstruction that allows applications to tap packets at all layers
of the network stack: from network, to transport, to the application
layer. qcap is fast, able to process network data at
speeds of 120 megabytes per second on commodity hardware; it is easy
to use, providing a simple API that requires only a few lines of code
to perform complex parsing tasks; and it is extensible, using BNF-like
grammars to describe TCP protocols. We believe that
qcap can provide the foundation for tools that will
support greater network awareness for system administrators.
Introduction
The behaviour of computer networks is one of the great unknowns of
computer science. Most network protocols are well known, the
communicating hosts act (in some sense) on the behalf of their human
masters, and network data are available at well known points in the
network; nevertheless, we still cannot easily answer the question
"what is the network doing?" High volume network traffic conspires
with our lack of protocol reconstruction tools to obscure network
content from us. Simple tasks require the construction of specialised
software tools [15] to look for known or expected network events.
Meanwhile, the flood of expected traffic obscures unexpected [8, 31]
and possibly malicious traffic. The irony of this predicament should
not be ignored: computers are information processors, and computer
networks are designed to share information, and yet we do not have the
means to understand the information processing that these human-made
constructs are performing on our behalf.
General curiosity is not the only reason why we need to know what
happens on computer networks as there are more pragmatic reasons to
care. Network administrators need to fully understand the resources
they control. Data flowing across the network dictates how the network
should expand and be optimised; the more resources administrators can
draw upon to understand the network, the more informed their decisions
will be. Administrators also need to know the nature of network
traffic for security reasons: when utilisation changes, they must be
able to understand what has changed, and why. Further, other areas of
computer science would benefit from a better understanding of network
phenomena. For example, protocol designers must understand the
environment their protocols are to inhabit. Additionally, network
security researchers and practitioners need to understand the network
and the effects of attacks.
The problem of analysing multiple high-bandwidth data streams in
an online, complex environment exists in other contexts. For example,
many researchers have recognised that complex displays and multiple
alarm signals can reduce the "situational awareness" of pilots and
other operators of complex equipment, making them more prone to errors
[13]. Similarly, network administrators are distracted by voluminous
logs and detailed packet dumps, all of which give important
information, but none of which can be relied upon to give the salient
information for a given situation. Members of the agent community have
recognised that in can be important for mobile code to be aware of the
state of available network resources [9]; we believe, though, that
such network awareness is potentially even more important for
human administrators.
The importance of understanding network traffic has been
recognised by others. The U. S. Department of Homeland Security
rephrases our question into the term situational awareness,
which it defines as "the ability to identify, process, and comprehend
the critical elements of information about what is happening to the
team with regards to the mission." [22] The DHS definition can be
generalised to "knowing what is going on around you." [18] We use
the term network awareness to refer to situational awareness
applied to the area of computer networking, which we will define as
"knowing what is happening on the network."
Most tools for monitoring high-bandwidth network connections
analyse netflow records (such as those described in the proceedings of
VizSec 2004 [30, 22, 6, 24, 16]), concentrating on traffic source and
destination fields. Limiting enquiry to a subset of packet headers
makes sense for scalability reasons: at high data rates, packet
payloads cannot be processed in a timely manner with commodity
hardware. However, discarding packet payloads limits the scope of
information available to administrators and researchers. Without the
ability to analyze packet payloads, it is impossible to ascertain
precise knowledge of the data crossing the network. To truly
understand what is happening on a network, however, we need more than
simple payload information. We must be able to reconstruct IP packets
and TCP streams to provide our analysis tools with the same
information available to the hosts at the endpoints of communications.
We must then analyze the reconstructed data in a manner that allows us
to detect what is happening in high level protocols, so that we can
assign "intent" to network events, accurately saying why an event
took place.
Thus, a tool that supports network awareness will allow network
packet headers and payloads to be analysed and aggregated efficiently
using an easy-to-use, responsive interface. As explained elsewhere, no
such tool currently exists in the open source world. As a first step
towards developing such a tool, we have designed and implemented
qcap, a library for efficiently reconstructing network
packets and streams, as well as analysing application level protocols.
In the future, we plan to use qcap to develop user-
friendly tools for understanding network data. Although
qcap is not fast enough to analyze high-bandwidth data
in real time, it is efficient enough to enable fast interaction with
multi-gigabyte network captures using commodity hardware.
In our recent work on mitigating network denial of service [5], we
have been studying strategies for automatically constructing packet
aggregates. qcap was inspired by the lack of tools for
analysing network content, and providing and explanation of network
events. Because of the general need for better understanding of
network behaviour, however, qcap should have a much
wider appeal.
The rest of the paper proceeds as follows. In subsequent sections,
we refine and explore the concept of network awareness; we provide an
overview of existing tools that provide some degree of network
awareness; we explore the possibilities network awareness offers us.
We then present our work on qcap, a library for
network awareness. We conclude with a discussion of limitations,
challenges, and plans for future work.
Network Awareness
Network awareness is the ability to answer questions quickly and
accurately about network behaviour. It is a well-developed
understanding of a particular computer network that allows a system
administrator (for example) to easily explain its behaviour, allowing
the administrator to make rapid, well informed decisions. Because of
the vast amounts of data involved, we cannot expect the administrator
to be aware of every passing bit, but we can expect them to understand
what classes of data to expect, the usual sources and destinations for
most traffic types, and the identities of the users involved. Under
normal network conditions, we expect that an administrator should be
able to make reasonable accurate predictions about the network state
in the near future. Under abnormal conditions, the administrator
should be able to quickly quantify and describe the abnormality.
To help define the scope of network awareness, we present a series
of questions whose answers provide some improvement in network
awareness. While these questions are not comprehensive, they provide
an indication of the kinds of issues that we might wish to understand
but that are difficult to answer using currently available tools.
-
Who is using the network? Many different entities use a
network. We want to be able to determine who uses the network, and how
they are using it. We are interested in different granularities of
"user": applications, hosts, people, and other networks.
-
How is a host using the network? We should be able to determine
the services a host is providing and utilising. Services may run on
nonstandard ports, and may be tunnelled through other protocols.
-
How do different network events relate to each other? Many
network events occur as part of a larger chain of events. We can use
an HTTP connection to illustrate: it begins with a DNS request,
followed by an ARP (requesting the MAC address returned by the name
server), followed by a TCP/IP connection to the named IP address.
Finally, one or more HTTP requests are made to the requested web
server. All of these events are causally related, and should be
grouped together. Conceptually, we could go so far as to say that they
are part of a single action.
-
How do low level protocols behave while being used by high level
protocols? We should be able to gauge how IP and TCP react to
higher level payloads, such as SMTP.
-
What network traffic is encrypted? It is normal for TLS and ssh
traffic to be encrypted; other encrypted traffic on the network,
however, could be evidence of attackers who are trying to conceal
their actions.
-
What content is the network carrying? In order to understand
network use, some inkling of user-level intent should be available.
The closest we can get to judging intent via the network is by
attempting to reconstruct the human-level activities that the network
is being used for. As such, we need to be able to use user-level
concepts where necessary, such as emails, print jobs, and uploads.
-
What credentials are being used on the network? Individual
users may be associated with multiple credentials. Where possible, we
should be able to associate credentials with users. In environments
where administrators have access to the encryption keys of users, it
should be possible to decrypt passing traffic for further analysis.
-
What is the TCP state of all existing TCP streams? Stream state
can be an indicator of malicious activity: many new streams, unclosed
streams, or streams that are timing out may be indicative of abnormal
behaviour.
-
What is the meaning of some bytes in a specific stream? Given
the existence of signature-based intrusion detection schemes [4], it
may be useful to put signatures into a context by reconstructing the
streams around the signature match, to better understand the
significance of the region.
-
What classes of interactions exist on the network? Protocols
can carry almost any type of data. Interactions should not be
classified solely by the protocol(s) used, but by the content carried.
For example, when dealing with emails that are being sent or received,
it would make sense for POP, IMAP, and SMTP to be grouped together.
However, some HTTP connections also carry email: so it would make
sense for HTTP connections to web-based mail providers (such as
Hotmail, and Yahoo) to be placed in the same class.
Note that these questions can only be answered through analysis of
complete packets (headers and payloads), and that such analysis
requires the aggregation of packets using syntactic, semantic, and
temporal criteria. In particular, we will need to reconstruct packet
streams (e.g., TCP streams, UDP-based multimedia traffic) in order to
determine context and meaning.
While a detailed analysis of the current state of a network can
help answer specific questions, the complexity of even small networks
make such analysis difficult to comprehend for even the most skilled
administrator. To accommodate this complexity, network awareness
requires one to understand how network behaviour has changed over
time. Because many changes are benign, we wish to know what looks
anomalous about the current state relative to the past state. While
anomaly detection in general is a difficult problem, the ability to
classify packets more accurately should facilitate the development of
improved network anomaly detection methods.
Existing Infrastructure
Although the questions described in the previous section are
straightforward, current tools provide only limited support for
answering these types of network awareness questions. Most of the
tools described below were not designed as network awareness tools but
have been pressed into service because of a lack of alternatives. Our
tour of tools will start with libraries and work up to full
applications. Note that this list is not intended to be exhaustive so
much as illustrative: it provides examples of classes of application,
not every application in each class.
The root of many existing packet capture tools is the BSD Packet
Filter [23], which defines an elegant approach for winnowing packets
based upon a textual predicate. The predicate is compiled into
instructions for a tiny virtual machine, which can run in the packet
capture device driver within the kernel. The BPF architecture has been
widely accepted and incorporated into the libpcap [28]
packet capture library.
In turn, libpcap and its parent application,
tcpdump, have spawned a number of command-line based
open-source progeny, including tcpstat [19] and
tcptrace [1], that are well suited to auditing and
debugging network traffic. In the more complex niches, we find
ChaosReader [17], a command-line based stream reconstruction tool that
is able to rebuild application level streams and store them as files;
Snort [4], a signature-based intrusion detection tool; and Ethereal
[2], a graphical packet display tool. These tools are designed
primarily as network debugging and intrusion detection systems. Other
tools [11, 10, 20] are useful for monitoring networked devices,
diagnosing faults, and other administrative tasks. While each of these
applications is well suited to locating known events, they are not
well suited to providing information about the general state of the
network.
The next level of abstraction to consider are network awareness
tools. These are explicitly designed to provide network administrators
with some sort of picture of the state of the network, usually for
security purposes. An entire crop of these tools were presented at
VizSec 2004 [22, 30, 6, 24], although older tools exist as well [7].
In general, most of these tools are graphical and use some variant of
a two or three dimensional display to render network activity. The
displays usually place network endpoints on two axes and the volume of
traffic traveling between those endpoints on the third axis. Most of
these tools present their output as a scatterplot [22, 6, 24],
although dual axes graphs were also used [30].
For the most part, the VizSec 2004 tools provide statistical
information on data traveling between source and destination
endpoints. The endpoints may take the form of one or more networks,
hosts, or ports. The data may be presented in terms of packets,
connections, bytes, or some other volumetric measurement. Although
volumetric data gives some indication of who is talking to whom, it
does provide an indication of what is being said. Volumetric analysis
does not provide answers to the questions we listed. We assert that
volumetric analysis is insufficient to provide network awareness.
Forensic tools [3, 11] delve into the contents of data streams.
They provide reconstructions of data stream contents, often indexing
it for searching, and support retrieval of text deemed to be of
interest to users. They provide some idea of the classes of
information that can be detected with full packet analysis. In
particular, these tools can normalise network events into conceptual
events and display those conceptual events grouped by type. For
example, a listing of all discrete "login" events for the network
can be presented, indexed by the credential used, and the resource
acquired; as can all downloads (via HTTP, FTP, or BitTorrent); message
sends (via SMTP, IM, SMS, or IRC); or file access (via SAMBA, NFS, or
DAV). They can also provide access to the payload of application layer
streams using an appropriate renderer (such as reconstructing and
playing the audio portion of VoIP traffic).
While forensic tools might appear to be ideal tools for network
awareness, their list-oriented interfaces are biased towards answering
specific (not general) questions, provide little support for
correlating high-level semantics with low-level packet behaviour, and
offer few mechanisms for comparisons and anomaly detection. These
limitations arise because these tools are designed to help dissect the
specifics surrounding a particular incident rather than to help detect
patterns that are not known in advance.
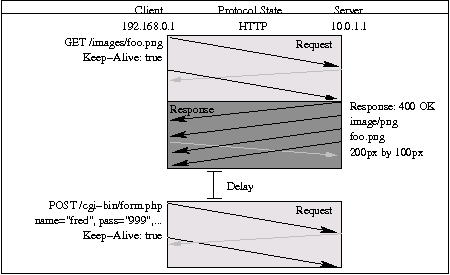
Figure 1: Display of protocol state relative to time
from HTTP view.
Interestingly, Q1 Labs QRadar [21] already provides a
sophisticated network awareness tool. Although it provides many
features that we are interested in and provides a mechanism to answer
many of the questions listed above, we still feel that
qcap is necessary. Although QRadar provides many
features for real-time network awareness, it does not appear to
provide sophisticated visualizations, a low-level API for traffic
analysis, or provide mechanisms for performing automated analysis of
stream content. These are not flaws in the product, per se, but are
indications of Q1 Labs target market of security officers in large
corporations. In contrast, qcap is aimed at the
broader community of systems administrators and researchers who need
to develop automated systems and custom visualization tools for
studying network traffic.
The Promise of Network Awareness
To better understand the kind of applications we envision for
qcap, here we present several visualisation idioms
that would provide network awareness by quickly informing a network
observer of the state of the network. There are clearly a huge number
of other visualisation idioms, each well suited to some class of
information; thus, this list is illustrative, not exhaustive.
qcap provides the basic operations and abstractions
that would be required to implement these visualisations efficiently.
Protocol State vs. Time
The intent of protocol state versus time display is to show how
the state of two (or more) hosts change over time. Figure 1 shows a
sample protocol state relative to time.
Figure 1 is ordered chronologically from top to bottom. Each side
of the graph represents one of the hosts involved in the conversation.
The left side is the initiator of the TCP connection, with IP address
192.168.0.1. The right side is the server 10.0.1.1; here the term
"server" is used solely to denote that 10.0.1.1 was not the
initiator of the connection. 192.168.0.1 is responsible for the first
two packets sent, indicated with a right-pointing arrow angled down.
Each arrow indicates an IP packet sent from one host to another; the
height of the arrow indicates the amount of data the packet is
carrying.
The meaningful data carried from one host to another causes the
protocol to change states. Each state is global to the protocol and
shown as a coloured rectangle. The rectangle encompasses all packets
that are sent and received while the protocol is in the given state.
Each state is coloured according to type, to allow the user to
visually group the states.
Packets may carry information from multiple states. In other
words, a hypothetical packet may contain three bytes, the first pushes
the protocol into State1, the second pushes the protocol into State2,
and the third pushes the protocol into State3. The arrow representing
the packet would be shown as passing through State1, State2, and
State3 in order.
Some of the packets exchanged on behalf of lower level protocols
are meaningless to higher level protocols, so they are displayed in a
different colour. Such packets include the TCP ACKs in Illustration 1,
which are lightly greyed out, indicating that that do not carry any
useful information for this protocol layer.
The display is annotated with blocks of text to the right and left
of the state boxes. Each annotation supplies extra information about
the state. Information supplied by a host is shown under that host.
This means that the client sent a GET, which the server replied to
with an image; later, the client sent a POST.
The protocol state at the top of the graph is intended to function
as a combo box, allowing the user to select which level of the
protocol stack they wish to view. Illustration 1 would therefore offer
a selection between Ethernet, IP, TCP, or HTTP. If the interaction
were part of a larger SOAP conversation, the SOAP view would be
available as well.
This visualisation type is already provided by some existing
commercial tools [10, 20].
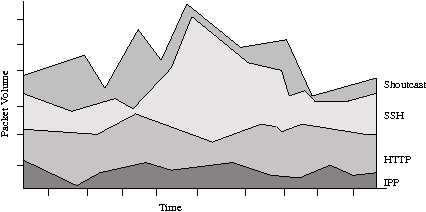
Figure 2: Display of traffic volume against
time.
Volume vs. Time
Figure 2 shows a traffic frequency graph that maps network
activity to time. The x-axis is time, with the right-most portion of
the graph being the most recent, and the leftmost being the oldest.
The y-axis represents some value that changes over time. Like the
host/aggregate vs. time graph, the traffic frequency graph can display
one of many different y types (packet volume, traffic volume, average
packet size, percentages of some total, or some attribute of a
conversation that changes over time). The entities graphed are ordered
vertically from least to most and named.
The graph is intended to be modal. The user should be able to
switch the aggregates being graphed from protocols (shown) to hosts,
groupings of hosts, or any grouping of conversations. In addition, the
user should be able to drill down into a class of traffic, to display
on that with finer granularity divisions.
Aggregate State vs. Time
The state of a host can be viewed by watching its actions change
over time. Figure 3 displays permutations of the host/aggregate
against time. Although any variable could be displayed on the vertical
axis, for ease of explanation, we shall assume that the variable being
displayed is that of packet volume.
The graph is divided into five rows. Each row is a different mode
of display that provides a summary of information about the entity on
the left side of the row. The entity is shown as a glyph (either a
single host in rows 1 to 4, or a subnet in row 5). Beside the glyph is
a listing of protocols the entity is using. To the right of the
protocol list, the state vs. time listing is shown. The graph displays
information about the network against time. Note that all time-based
graphs scroll from right to left: the rightmost data is the most
recent.
The first row shows an aggregation of values for a host. The host,
192.168.1.2, is producing a volume of data for three listed protocols
(HTTP, POP, and SSH). The graphs are summaries for all conversations
that the host is participating in. In other words, it may be involved
in many POP connections, but the value shown is the total for all POP
connections. As the "+" to the left of the protocol name suggests,
there is a hierarchical listing of information that the user may gain
access to by "opening" that protocol.
Since there are many ways of grouping aggregated information
together, rows 2 and 3 will illustrate three possible forms of
grouping. It is our intent that the "+" beside the protocol name be
a means of cycling through the three possible views.
Row 2 provides a brief textual description of the state of each
protocol the host is using. The descriptions are protocol dependent.
The third row features a detailed summary of the HTTP traffic of
10.0.0.1. The only two items available for HTTP are the total number
of connections, as well as the total number of connections to unique
hosts. The values displayed depend on the protocol being viewed: they
could easily include the number of web pages downloaded; the average
number of objects per web page; the hosts currently connected to; or
the user agent performing the requests.
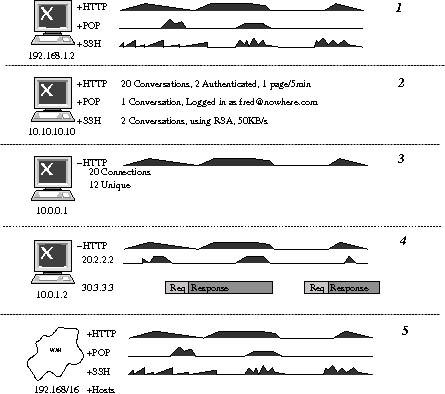
Figure 3: Display of aggregate state against time. Each
row indicates the state of a specific entity.
The fourth row shows a breakdown of conversations that the host
10.0.1.2 is participating in. It is one of the modes mentioned under
"Row 3."
-
The top line, labelled "HTTP," shows a graph of the total volume of
traffic for the given protocol type; this total is the total for all
of the conversations listed underneath it.
-
The second line shows a graph of the volume of traffic for the
conversation 10.0.1.2 is having with 20.2.2.2.
-
The third line shows the conversation that 10.0.1.2 is having with
30.3.3.3 as a listing of protocol states. Each state is concisely
named, and tagged with a protocol-specific colour. If the state is too
thin to display a name, it will simply be coloured. Because the
rightmost side is the "newest" side, the states will be described in
an English-readable manner.
The fifth row shows a grouping of hosts on the network
192.168.*.*. Like the per-host display, each protocol is displayed as
a graph. The protocol can be opened to display either a textual
summary or a listing of all conversations it contains.
With the aid of a context menu, the user could add or remove hosts
from this aggregate.
Summary
The three visualisations described in this section require
features not present in known open source libraries and tools. They
include:
-
Indexing provides fast access to network information based upon
queries, or walking displays. This allows the graphical display to be
recomputed quickly, by processing only those packets that are relevant
to the current visualisation.
-
Random access into packet traces must be provided to allow the
visualisation tool to properly exploit the features of indexing. Even
if the tool is designed to run online, it will have to keep either a
rolling buffer of recent data if any kind of historic display is to be
provided. "Recent data" in this context can refer to packets or
aggregates of traffic information that are stored in memory.
-
Task-specific internal models allow large data sets to be
aggregated, manipulated, and displayed quickly and efficiently. Such
models also provide the means to create very informative and
expressive slaved visualisations [26].
-
Access to network, transportation, and application layer data
is necessary to provide a high level view of data.
More complete discussions of the basics of visualisation are
available in [27, 26].
A Library for Network Awareness: qcap
The features listed in the Summary cover a wide variety of
computer science disciplines, from database maintenance and access to
visualisation techniques, that have been thoroughly addressed
elsewhere. However, one feature is currently missing from the pantheon
of tools and libraries available: we have no tools for the wholesale
decomposition of large volumes of packets in speeds approaching real-
time. There are no known APIs or libraries for reconstructing
conversations from packet traces, and subsequently decomposing those
conversations into their logical parts.[Note 1]
We wish to gain access to the payload of packets to examine the
relationships between application-layer payload, individual packets,
transportation layer interactions, and network events. In order to do
that, we need a means of reconstructing application-layer streams that
preserves network layer information. The best means that we can see to
do that is to provide a processing layer that sits on top of a BPF
implementation and provide higher network reconstruction
functionality.
We have created the qcap library to address these
needs. It is an open source library that uses an IP and TCP
reconstruction engine derived from libnids library,
which in turn was derived from a version of the Linux 2.0 networking
stack [29]. It can translate individual packets into complete
conversations. Those conversations can be tapped at any point during
reconstruction, to allow the tool-user to fully understand the
significance of each packet. qcap provides:
-
Packet parsing which allows an application to query fields in a
packet. For example, given a domain name query packet, we would be
able to query for any of the fields in it: be they IP, UDP, or DNS.
-
Packet reconstruction rebuilds fragmented IP packets. Different
network stacks can reconstruct corrupted or malicious fragmented
packets in different ways [25]. qcap provides a
mechanism to allow an application to control how fragmented packets
are rebuilt, allowing qcap to properly emulate
different network stacks.
-
Stream reconstruction creates stream "objects" from a set of
packets. The stream objects allow the application to read a data-
stream that is identical to that on the receiving end of the
connection.
-
Stream parsing provides a means for the application to easily
dissect a conversation. qcap parses the stream text,
allowing the application to request specific syntactically defined
portions of that text.
Design of qcap
We use libpcap as a guide for our design. It is
old, well established, and still actively maintained. It appears to be
the most popular open source packet acquisition library, used in
numerous open source projects [28, 19, 1, 4, 2, 29]. Its design is
simple, offering a subscription interface to listen for packet
arrival.
We provide two subscription interfaces, one for packets, and one
for portions of TCP streams. The packet subscription function is
qcap_packet_handler_add(), which associates the
callback with a specific stage of packet reconstruction or stream
assembly. Meanwhile, TCP streams can be subscribed to with
qcap_tcpstr_handler_add(), which causes a callback to
be triggered when a specified syntactic element in an application-
level stream is found.
To support these two functions, we have three types of object:
qcap_packet_t, qcap_tcpstr_t, and
qcap_ tcpstr_pos_t.
Packets
Network level objects are instances of
qcap_packet_t's. Because our network level provides
packet reconstruction for fragmented IP packets and an indication of
logical events each packet generates, we add two flags to each packet:
the artificial flag and the discarded flag. The
artificial flag is used to denote defragmented IP packets, while the
discarded flag is used to denote packets that are known to have been
dropped.
Our packet abstraction provides the following information:
-
Text is the data sent across the network layer. It is used for
reconstruction by higher layers.
-
Arrival time when the packet was received at the sampling
point.
-
Discarded is a flag that indicates whether or not the packet
has been dropped before final delivery, either due to network state,
or the reconstruction policy of the recipient endpoint.
-
Artificial is a flag that indicates if the packet was
constructed artificially from other packets.
-
Constituents is a list of packets that this packet was built
out of. Only artificial packets have constituents.
-
Fragment is a flag indicating that this packet is a part of
another packet.
-
Processing state is the stage of processing that the packet is
in. There are many stages, they are used to indicate how the
destination network stack is expected to treat the packet.
Possibilities include: if a packet was discarded due to some logic
error (such as a failed IP CRC check), if the packet triggered the
creation of a new TCP connection, or if it is being queued due to TCP
ordering issues. Each packet passes through many states as it is
processed. The application may subscribe to packets entering any
state.
TCP Streams
A TCP stream (or qcap_tcpstr_t) is an ordered
collection of qcap_packet_t's, in proper TCP order.
qcap_tcpstr_t is an opaque data type, but can be
queried with stream positions (or qcap_tcpstr_pos_t).
TCP Stream Positions
Stream positions are positions at exact locations within a stream.
They are implemented as an opaque data type that can be copied, walked
forward in the stream, and have the byte at their location queried.
Given two positions in the same stream, the application can request
all of the bytes between the positions.
Because the qcap_tcpstr_t type is opaque and only
queryable through qcap_tcpstr_pos_t types, it allows
qcap to perform reference counting and garbage
collection on individual packets within a
qcap_tcpstr_t.
Analysing Fields in Packets
In addition to the callback interfaces described above,
qcap also provides a mechanism to query fields from
packets. In protocols that have primarily fixed-length fields, such as
IP, TCP, and UDP headers, querying fields is trivial: it only requires
byte-order conversion and a cast to a native type. However, other
protocols such as DNS have arbitrary-length fields and non-standard
data encoding, meaning that an application-writer must write complex
code to perform a simple task.
Field querying is done with the qcap_getter_t
type. A call to qcap_getter_compile() creates a
"getter" from a string specification. Packets can be queried by
calling qcap_getter_apply(). The result is converted
into a particular form, such as a string, or a boolean, and returned.
Implementation
qcap is written in C and is built on top of
libpcap. Although heavily modified and extended, parts
of pcap are also derived from libnids.
At this stage, pcap does not use any other utilities
outside of the standard platform libraries. As the bulk of the newly
written code deals with parsing stream-based protocols, we shall
discuss that code here.
One of the non-functional requirements surrounding
qcap was that it must be easy to extend with new
protocols. Towards this end, qcap internally uses
context-free grammars that are generated from static C code. As it
turns out, however, many protocols cannot practically be defined
solely with a context-free grammar, as the protocol carries
information about its own syntax. Such information is carried in a
field providing a parameter, such as the length of a subsequent field,
or a field that provides a terminating delimiter for some subsequent
field.
For example, consider HTTP. Well formed HTTP streams consist of
requests (originating with the client), and responses (originating
with the server). Both requests and responses can carry an optional
"body" that can have an arbitrary length. The length of the body is
usually defined with a "Content-Length" field that contains an
integer indicating the number of bytes in the body. We could express
the "Content-Length" statically in the HTTP context-free grammar, by
enumerating every possible value of "Content-Length", and defining
the length of the subsequent body in the context-free grammar.
However, that would result in an extremely verbose grammar.
To avoid such large grammars, qcap implements a
series of protocol-specific registers for each parser. As the parser
is walking a stream, it places the value of specific stream elements
into the associated register, which can be used later during the
parse. Continuing with our example from above, qcap
would store HTTP's Content-Length field with a
content_length register in the stream parser. Upon
encountering the Content-Length field, the parser would decode the
associated value as an integer and store it in the
content_length register. Later, when the parser
encounters the subsequent body, it will read exactly
content_length characters.
While current grammars are built by hand, we are researching
mechanisms for automatically generating the necessary static C code
from protocol specifications in Augmented Backus-Naur Form (ABNF)
[12].
Evaluation
In our opinion, the most interesting feature of
qcap is the analysis of application-layer protocols.
We believe that qcap will be most useful if it is able
to perform application-layer analysis at speeds approaching real-time.
We have developed two test applications to test
qcap's speed:
-
reader opens a trace and parses it, performing IP
defragmentation and TCP stream reconstruction. It provides no useful
output and is used for timing purposes.
-
ip_identity opens a trace, and gathers credentials
sent from each IP address in the trace. Currently,
ip_identity only parses FTP usernames and passwords,
SMTP senders, and HTTP authorisation requests [14].
Both ip_identity and valid
reconstruct all IP fragments and TCP streams. qcap
could be set to ignore TCP/IP traffic going to ports that we aren't
interested in, but these tests provide us with a stronger worst-case
idea of processing time.
To test timing, we ran each program against the Lincoln Laboratory
DARPA Intrusion Detection Evaluation datasets [32]. The first five
datasets are DIDE-1 to DIDE-5, which correspond to the Monday-Friday
traffic of the LBL week 1 traffic set, DIDE-6 to DIDE-10 correspond to
the data gathered during week 3. Each represents one day's worth of
traffic.
The tests were run on an unloaded 2.8 Ghz Pentium 4 system with 1
GB of RAM, 512K of processor cache, and two 36.4 Gb, 10,000 RPM SCSI
drives. Each test was run 1000 times, and the values were averaged.
In order to minimise the amount of time spent on output, we ran
tcpstat with an invalid BPF filter, ensuring that it
would not waste too much time writing data. Since
reader does not produce output, and
ip_identity only produces brief output at the end of
the trace, we did not modify either application to reduce their volume
of output.
During our experiments, we discovered that qcap
analyses data at a rate of roughly 2.11 microseconds per packet, as
compared to tcpstat which analysed traffic data at a
rate of 0.694 microseconds per packet. The difference in processing
speed amounts to an order of magnitude: however, as shown in Table 4,
processing times are still low: to process a 468 MB trace file
(DIDE-6) containing 2.1 million packets with qcap only
takes about 5.7 seconds.
Since ethereal seems to be the flagship open
source packet processing tool, we also timed how long it took
ethereal to open each packet trace. In our experience,
this provides a ballpark figure on how long it takes
ethereal to perform a search. These tests were
performed a handful of times on the same machine mentioned above, with
the lowest timing result provided. As shown in Table 4, ethereal is
between 3 and 20 times slower than qcap.
| File | Processing Time (seconds) | Time Per Packet
(microseconds)
|
| Test | Packets | tcpstat | ip_identity | reader | ethereal | tcpstat | ip_identity | reader | ethereal
|
| DIDE-1 | 1,362,869 | 0.74 | 4.48 | 2.93 | 69 | 0.54 | 3.29 | 2.15 | 50.6
| | DIDE-2 | 1,157,328 | 0.68 | 4.35 | 2.65 | 60 | 0.58 | 3.76 | 2.29 | 51.8
| | DIDE-3 | 1,616,713 | 0.87 | 5.23 | 3.43 | 86 | 0.54 | 3.24 | 2.12 | 53.2
| | DIDE-4 | 1,807,060 | 1.07 | 6.32 | 4.09 | 94 | 0.59 | 3.50 | 2.26 | 52.0
| | DIDE-5 | 1,349,635 | 0.70 | 4.25 | 2.82 | 70 | 0.52 | 3.14 | 2.09 | 51.9
|
| DIDE-6 | 2,106,744 | 1.12 | 5.67 | 3.94 | 109 | 0.53 | 2.69 | 1.87 | 51.7
| | DIDE-7 | 1,831,648 | 0.97 | 5.45 | 3.48 | 98 | 0.53 | 2.97 | 1.90 | 53.5
| | DIDE-8 | 1,849,753 | 1.13 | 6.97 | 4.35 | 113 | 0.61 | 3.77 | 2.35 | 61.1
| | DIDE-9 | 1,559,156 | 0.74 | 3.38 | 2.65 | 85 | 0.48 | 2.17 | 1.70 | 54.5
| | DIDE-10 | 1,635,425 | 1.01 | 6.67 | 3.93 | 101 | 0.62 | 4.08 | 2.40 | 61.8
|
Figure 4: Observed processing
speeds of qcap compared to those of
tcpstat.
In our judgment, the rates achieved by qcap are
acceptable: we can analyze a 1 GB trace in roughly 10 seconds. As we
increase the number of protocols that we are parsing and the
complexity of the protocol parsers, this execution time will increase;
however, we expect the parse time to stay within the same order of
magnitude. In addition, the current implementation of
qcap has not undergone any optimisation, suggesting
that we may be able to achieve speed improvements with minimal effort.
Discussion
At this point, skeptical readers may be asking themselves what is
new about qcap: tools already exist for analysing
packet traces. Indeed, any of the information we acquire with
qcap can also be acquired by using existing tools. For
example, if a user wants to parse all of the cookie headers out of an
HTTP conversation, they could use ngrep with a
specially constructed regular expression. Or, if a user wanted to find
the contents of a TCP session, they could use tcpflow
to pull all of the TCP sessions out of a trace, and then analyze them
by hand or open them with ethereal. And general
connection statistics can be gathered with much simpler tools, like
tcpdump or tcptrace. Alternatively,
snort could be used for any of the aforementioned
tasks.
Those skeptical readers should realize that qcap
has been designed specifically for network awareness. It is not
designed to find individual packets in a network trace, nor is it
designed to find statistics on a specific class of event. Instead it
is designed to:
-
Provide a standard interface to analyze traffic, regardless of
protocol.
-
Perform full stream reconstruction, allowing the application to parse
strings that are split across multiple TCP packets, without having to
be aware of the packet divisions. Applications can, however, request
the information to be made available to them.
-
Perform the drudge work of protocol syntax analysis, allowing the
application to concentrate on the meaning of the traffic.
-
Provide a simple mechanism for collecting a wide variety of data and
statistics.
-
Handle large volumes of data quickly.
To our knowledge, no other open-source library provides this
functionality. We have not seen an open-source tool that correlates
large volumes of application-level network data.
Limitations
While we believe qcap is quite promising, it is
also a new library with many limitations. For example, because
qcap builds upon libpcap, we can, for
the most part, say that qcap shares a subset of
libpcap's limitations. There are a number of other
limitations, however, that are specific to pcap.
First, qcap is not suited to searching for known
strings in input text, either as a literal string, or a regular
expression. Specialised tools, such as ngrep perform
those tasks well. However, since qcap is a thin
wrapper around libpcapthere is no reason why such
tools could not be ported to use qcap.
Next, even though qcap's protocol parsing
capabilities are well-developed, it does not deal with lookahead.
Lookahead means scanning further in the stream of text being parsed to
discover if any text in the near future would prevent the current text
from being deemed valid.
A trivial example involves HTTP requests. A valid HTTP request
consists of the request-line, such as a "GET <url>
<protocol>". When qcap is parsing the request-
line, and it reaches the end of the url field, it will inform
the application that a url field has been encountered and then
continue parsing with the protocol field. If the
protocol field turns out to be invalid (because it contains the
text "foo" instead of "HTTP/1.1," for example), then the entire
request-line should be deemed invalid, meaning that
qcap should not of informed the application that an
url was discovered earlier.
The difficulty with lookahead is that it involves reading data
into memory before deciding if a chunk of text is a part of a valid
stream. If we need to perform lookahead to the end of a large piece of
data, we could flood memory with data: consider an HTTP response that
contains a 50 MB file - the response headers cannot be considered
valid until the entire response is received, but that means that
qcap would have to read the full 50 MB file into
memory before deciding if it should accept or reject the response
headers. Instead, we force the application developer to be aware of
the protocol structure, and watch for failed requests.
qcap, because of limitations in
libnids, does not currently support any kind of
parameterisation to state how streams should be rebuilt in
circumstance not defined by the IP and TCP RFCs. Such situations
include packets with invalid CRCs, overlapping packets, et cetera.
One potential issue for some applications is that
qcap currently has no mechanism for synchronizing the
two sides of a stream during parsing. Strictly speaking, such
synchronisation is necessary to ensure that proper protocol state is
maintained at all times. However, in practice we have not yet found
the lack of synchronisation tracking to be a problem.
However, one of the features we feel will be necessary for any
offline analysis GUI tool built on top of qcap is
analysis of network traces larger than one gigabyte. In order for such
an analysis to be relatively fast, and put a low load on the
workstation, a minimum of data should be kept in memory; suggesting
that, where possible, information about specific packets should be
kept on disk, and read as necessary. To speed up overall performance
and searching, we assume that indices would be built during the
initial load.
In order for packet data to be left out of memory, we need a means
to provide random access to a static trace file on disk - meaning that
we should be able to read packets from the file in an arbitrary order.
However, libpcap does not support random access into
trace files, meaning that solely reading specific packets from disk is
not possible.
There are two possible approaches to this problem: either
petitioning the libpcap maintainers to include random-
access to libpcap files; or building our own file
reading routines into qcap. Clearly, the first option
is preferable. At the time of writing, we are engaged in petitioning
the libpcap maintainers to include this functionality.
Future Work
While internal parts of the library are still evolving, at the
time of writing, the qcap API is almost complete. The
existing functions are unlikely to change for the foreseeable future,
even though new calls may be added. Having said this, there are are
some issues that we hope to address in the near future.
First, there are currently no mechanisms for decoding stream
content. qcap should be able to decode either an
entire stream (such as ssh or SSL), or portions of a stream (such as
gzip-encoded HTML responses), in a manner that is transparent to the
application. It should be possible for encoded regions to contain
semantic elements that are to be recognised by stream parsers. Such
additions would significantly improve the utility of
qcap.
We also plan to develop bindings to allow higher level languages
such as Python, Perl, and Java to access qcap
functionality. Such changes and additions should help facilitate the
development of novel network awareness applications. The
qcap distribution contains sample programs that
provide interesting functionality not seen in other open source tools:
ip_identity trawls network traces for credentials; and
valid tests streams to see if they follow the protocol
semantics for the ports they are using. While such tools can be
useful, much larger scale applications are also possible:
-
a fast protocol debugger, along the lines of ethereal,
but supported by a database back-end that would provide fast searching
and display.
-
anomaly-detection tools that consider the values of individual fields
in a protocol stream.
-
"leak" detection tools that sniff passing traffic for sensitive
content that should never leave hosts.
-
a fast classification tool that classifies streams by their purpose,
either in gross terms; such as "exchanging email" for SMTP, POP,
IMAP, Gmail, and Hotmail connections; or specific terms, such as
"instant messenger conversation between Alice and Bob."
In the long term, optimisation and improvement of
qcap will allow it to process extremely high volumes
of data. Ideally, qcap will eventually be able to
handle data at rates approaching those seen by medium-to-large ISPs
and enterprises. When it does, our definition of network awareness can
grow from today's analysis of traffic volumes to and from hosts to
include content-specific and aggregate analysis that will finally help
us figure out what our networks are actually doing.
Acknowledgements and Availability
This work was supported by the Canadian government through an
NSERC Discovery Grant and MITACS. The qcap library can
be downloaded from https://www.ccsl.carleton.ca/projects/qcap.It is
licenced under the GNU General Public License (GPL).
About the Authors
Evan Hughes graduated from Carleton University in Ottawa, Canada
in 2000 with a BCS. Since then he has worked for a number of start-up
companies in the software space; before retiring from the 9-5 world to
do good works contracting with charities. Given his fondness for food
and shelter, he quit contracting for the penniless and has enrolled at
Carleton University for his MCS. He is currently doing research work
in the Carleton Computer Security Lab. Email reaches him at
evan.c.hughes@gmail.com.
Anil Somayaji is an assistant professor in the School of Computer
Science at Carleton University and is associate director of the
Carleton Computer Security Laboratory. His research interests include
operating system security, intrusion detection, complex adaptive
systems, and artificial life. He received a B.S. in Mathematics from
the Massachusetts Insitute of Technology in 1994 and a Ph.D. in
Computer Science from the University of New Mexico in 2002. He can be
reached at soma@ccsl.carleton.ca.
Bibliography
[1] tcptrace homepage, https://www.tcptrace.org, Accessed May
3, 2005.
[2] Ethereal homepage, https://www.ethereal.com, Accessed
May 3, 2005.
[3] Netwitness homepage, https://www.netwitness.com,
Accessed May 3, 2005.
[4] snort homepage, https://www.snort.org/, Accessed: May
3, 2005.
[5] Matrawy, Ashraf, Paul C. van Oorschot, Anil Somayaji,
"Mitigating network denial-of-service through diversity-based traffic
management," Applied Cryptography and Network Security (ACNS)
2005, pp. 104-121, 2005.
[6] Ball, Robert, Glenn A. Fink, and Chris North, "Home-centric
visualization of network traffic for security administration,"
VizSEC/DMSEC '04: Proceedings of the 2004 ACM workshop on
Visualization and data mining for computer security, pp. 55-64,
ACM Press, New York, NY, 2004.
[7] Becker, Richard A., Stephen G. Eick, and Allan R. Wilks,
"Visualizing network data," IEEE Transactions on Visualization
and Computer Graphics, Vol. 1, Num. 1, pp. 16-28, 1995.
[8] Bellovin, Steven M., "Packets found on an internet,"
SIGCOMM Comput. Commun. Rev., Vol. 23, Num. 3, pp. 26-31, 1993.
[9] Wilmer Caripe, et al., "Network awareness and mobile agent
systems," IEEE Communications Magazine, July, 1998.
[10] Clearsight, Clearsight analyzer homepage,
https://www.clearsightnet.com/products-analyzer.jsp, Accessed May 4,
2005.
[11] Colasoft, Colasoft capsa, https://www.colasoft.com/products/capsa.php, Accessed May 3, 2005.
[12] Crocker, D. and P. Overell, "Augmented BNF for Syntax
Specifications: ABNF," RFC 2234, November, 1997.
[13] Endsley, Mica R. and Daniel J. Garland, editors,
Situation Awareness Analysis and Measurement, Lawrence Erlbaum
Associates, 2000.
[14] Franks, J., P. Hallam-Baker, J. Hostetler, S. Lawrence, P.
Leach, A. Luotonen, and L. Stewart, "HTTP Authentication: Basic and
Digest Access Authentication," RFC 2617, November, 1997.
[15] Gates, Carrie, Michael Collins, Michael Duggan, Andrew
Kompanek, and Mark Thomas, "More netflow tools: For performance and
security," 18th Large Installation System Administration
Conference (LISA '04), pp. 121-132, Atlanta, Georgia, November,
2004.
[16] Goldring, Tom, "Scatter (and other) plots for visualizing
user profiling data and network traffic," VizSEC/DMSEC '04:
Proceedings of the 2004 ACM workshop on Visualization and data mining
for computer security, pp. 119-123, ACM Press, New York, NY, 2004.
[17] Gregg, Brendan, Chaosreader homepage, https://users.tpg.com.au/bdgcvb/chaosreader.html, Accessed May 3, 2005.
[18] U. S. Coast Guard, Team coordination training student
guide, https://www.cgaux.info/g_ocx/training/tct, Accessed May 4,
2004.
[19] Herman, Paul, tcpstat homepage, https://www.frenchfries.net/paul/tcpstat/, Accessed May 1, 2005.
[20] Network Instruments, Observer homepage, https://www.networkinstruments.com/products/observer.html, Accessed May 4,
2005.
[21] Q1 Labs, Qradar product page, https://www.q1labs.com/products/prod_overview.html, Accessed September 27, 2005.
[22] Lakkaraju, Kiran, William Yurcik, and Adam J. Lee,
"NVisionIP: netflow visualizations of system state for security
situational awareness," VizSEC/DMSEC '04: Proceedings of the 2004
ACM workshop on Visualization and data mining for computer
security, pages 65-72, ACM Press, New York, NY, 2004.
[23] McCanne, Steven and Van Jacobson, "The BSD packet filter: A
new architecture for user-level packet capture," Proceedings of
the 1993 Winter USENIX Conference, pp. 259-270, 1993.
[24] McPherson, Jonathan, Kwan-Liu Ma, Paul Krystosk, Tony
Bartoletti, and Marvin Christensen, "Portvis: a tool for port-based
detection of security events," VizSEC/DMSEC '04: Proceedings of
the 2004 ACM workshop on Visualization and data mining for computer
security, pp. 73-81, ACM Press, New York, NY, 2004.
[25] Ptacek, Thomas H., and Timothy N. Newsham, Insertion,
evasion, and denial of service: Eluding network intrusion
detection, Technical report, Secure Networks, Inc., Suite 330,
1201 5th Street S.W, Calgary, Alberta, Canada, T2R-0Y6, 1998.
[26] Roberts, Jonathan C., "Multiple-View and Multiform
Visualization," Robert Erbacher, Alex Pang, Craig Wittenbrink, and
Jonathan Roberts, editors, Visual Data Exploration and Analysis
VII, Proceedings of SPIE, Vol. 3960, pp. 176-185, IS&T and SPIE,
January, 2000.
[27] Shneiderman, Ben, "The eyes have it: A task by data type
taxonomy for information visualizations," Technical Report UMCP-CSD
CS-TR-3665, University of Maryland Computer Science Department, 1996.
[28] tcpdump workers, Tcpdump public repository,
https://www.tcpdump.org, Accessed September 27, 2005.
[29] Wojtczuk, Rafal, libnids homepage, https://libnids.sourceforge.net/, Accessed May 5, 2005.
[30] Yin, Xiaoxin, William Yurcik, Michael Treaster, Yifan Li,
and Kiran Lakkaraju, "Visflowconnect: netflow visualizations of link
relationships for security situational awareness," VizSEC/DMSEC
'04: Proceedings of the 2004 ACM workshop on Visualization and data
mining for computer security, pp. 26-34, ACM Press, New York, NY,
USA, 2004.
[31] Zalewski, Michal,Museum of broken packets, https://lcamtuf.coredump.cx/mobp/, Accessed May 6, 2005; 2003.
[32] Zissman, Marc, DARPA Intrusion Detection Evaluation
Datasets, https://www.ll.mit.edu/IST/ideval/data/1999/1999_data_index.html, Accessed September 27, 2005;
1999.
Footnotes:
Note 1: libnids
[29] performs stream reconstruction, but does not provide packet
or stream decomposition.
|