| ||||||||||||||||||||||||||||||||||||||||||||||||||||
|
LISA '03 Paper
[LISA '03 Technical Program]
Archipelago: A Network Security Analysis ToolAbstractArchipelago is system analysis and visualization tool which implements several methods of automated resource and security analysis for human-computer networks; this includes physical networks, social networks, knowledge networks and networks of clues in a forensic analysis. Access control, intrusions and social engineering can be discussed in the framework of graphical and information theoretical relationships. Groups of users and shared objects, such as files or conversations, provide communications channels for the spread of both authorized and un-authorized information. We present a Java based analysis tool that evaluates numerical criteria for the security of such systems and implements algorithms for finding the vulnerable points. IntroductionNetwork security is a subject that can be discussed from many viewpoints. Many discussions focus entirely upon the technologies that protect individual system transactions, e.g., authentication methods, ciphers and tunnels. Less attention has been given to the matter of security management, where a general theoretical framework has been lacking. In this work, we explore two theoretical methods to estimate systemic security, as opposed to system component security. describe a tool (Archipelago) for scanning systems, calculating and visualizing the data and testing the results. Our paper starts with the assumption that security is a property of an entire system [1] and that covert channels, such as social chatter and personal meetings, are often viable ways to work around so-called strong security mechanisms. File access security is a generic representation of communication flow around a system, and we use it as a way of discussing several other problems. Other issues like social engineering have previously been notoriously difficult to address in quantitative terms, but fit easily into our discussion. We have made some progress in this area by applying graph theoretical techniques to the analysis of systems [2]. In this paper we implement a tool for using these techniques and demonstrate its use in a number of examples. The paper begins with a brief discussion of the graph-theoretical model of security, and how it is used to represent associations that lead to the possible communication of data. Next we consider how complex graphs can be easily represented in a simplified visual form. The purpose of this is to shed light on the logical structure of the graph, rather than its raw topological structure. We describe a method of eigenvector centrality for ranking nodes according to their importance, and explain how this can be used to organize the graph into a logical structure. Finally, we discuss the problem of how easily information can flow through a system and find criteria for total penetration of information. GraphsA graph is a set of nodes joined together by edges or arcs. Graph theoretical methods have long been used to discuss issues in computer security [3, 4], typically trust relationships and restricted information flows (privacy). To our knowledge, no one has considered graphical methods as a practical tool for performing a partially automated analysis of real computer system security. Computer systems can form relatively large graphs. The Internet is perhaps the largest graph that has ever been studied, and much research has been directed at analyzing the flow of information through it. Research shows that the Internet [5] and the Web [6] (the latter viewed as a directed graph) each have a power-law degree distribution. Such a distribution is characteristic [7, 8, 9] of a self-organized network, such as a social network, rather than a purely technological one. Increasingly we see technology being deployed in a pattern that mimics social networks, as humans bind together different technologies, such as the Internet, the telephone system and verbal communication. Social networks have may interesting features, but a special feature is that they do not always have a well defined center, or point of origin; this makes them highly robust to failure, but also extremely transparent to attack [10]. A question of particular interest to a computer security analyst, or even a system administrator deploying resources is: can we identify likely points of attack in a general network of associations, and use this information to build analytical tools for securing human-computer systems? AssociationsUsers relate themselves to one another by file sharing, peer groups, friends, message exchange, etc. Every such connection represents a potential information flow. An analysis of these can be useful in several instances:
Communication takes place over many channels, some of which are controlled and others that are covert. A covert channel is a pathway for information that is not subject to security controls. Our basic model is of a number of users, related by associations that are mediated by human-computer resources. The graphs we discuss in this paper normally represent a single organization or computer system. We do not draw any nodes for outsiders; rather we shall view outsiders as a kind of reservoir of potential danger in which our organization is immersed. In the simplest case, we can imagine that users have access to a number of files. Overlapping access to files allow information to be passed from user to user: this is a channel for information flow. For example, consider a set of F files, shared by U users (see Figure 1). 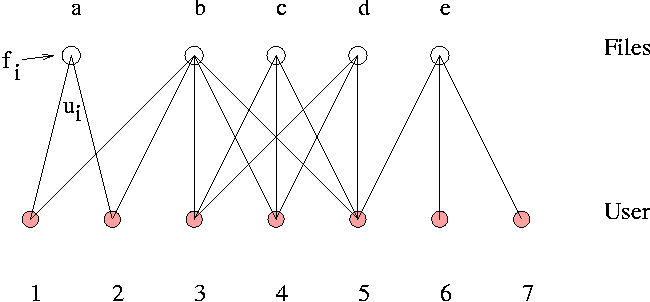 Here we see two kinds of object (a bi-partite graph), connected by links that represent associations. A bipartite form is useful for theoretical discussions, but in a graphical tool it leads to too much `mess' on screen. Bi-partite graphs have been examined before to provide a framework for discussing security [11]. We can eliminate the non-user nodes by simply coloring the links to distinguish them, or keeping their character solely for look-up in a database. Any channel that binds users together is a potential covert security breach. Since we are estimating the probability of intrusion, all of these must be considered. For example, a file, or set of files, connected to several users clearly forms a system group, in computer parlance. In graph-theory parlance the group is simply a complete subgraph or clique. In reality, there are many levels of association between users that could act as channels for communication:
In a recent security incident at a University in Norway, a cracker gained complete access to systems because all hosts had a common root password. This is another common factor that binds `users' at the host level, forming a graph that looks like a giant central hub. In a post factum forensic investigation, all of these possible routes of association between possible perpetrators of a crime are potentially important clues linking people together. Even in an a priori analysis such generalized networks might be used to address the likely targets of social engineering. Each user naturally has a number of file objects that are private. These are represented by a single line from each user to a single object. Since all users have these, they can be taken for granted and removed from the diagram in order to emphasize the role of more special hubs (see Figure 2). 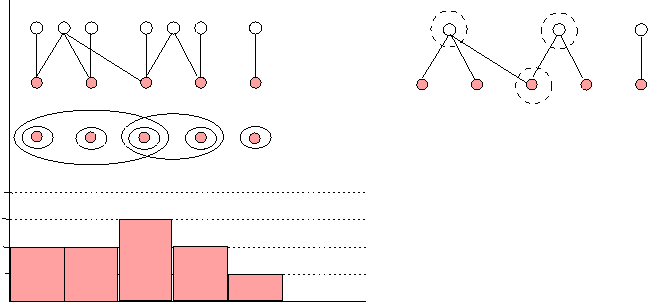 The resulting contour graph, formed by the Venn diagrams, is the first indication of potential hot-spots in the local graph topology. Later we can replace this with a better measure - the `centrality' or `well-connectedness' of each node in the graph. Visualizing Graphs in ShorthandThe complexity of the basic bi-partite graph and the insight so easily revealed from the Venn diagrams beg the question: is there a simpler representation of the graphs that summarizes their structure and which highlights their most important information channels? An important clue is provided by the Venn diagrams; these reveal a convenient level of detail in simple cases. Let us define a simplification
procedure based on this.
Trivial group: An ellipse that encircles only a single user
node is a trivial group. It contains only one user. 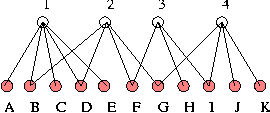  Elementary group: For each file node i, obtain the maximal group of users connected to the node and encircle these with a suitable ellipse (as in Figure 2). An ellipse that contains only trivial groups, as subgroups, is an elementary group. Our aim in simplifying a graph is to organize the graph using the low resolution picture generated by a simplification rule. Simplification rule: For each file node i, obtain the maximal group of users connected to the node and encircle these with a suitable ellipse or other envelope (as in Figure 2). Draw a super- node for each group, labelled by the total degree of group (the number of users within it). For each overlapping ellipse, draw an unbroken line between the groups that are connected by an overlap. These are cases where one or more users belongs to more than one group, i.e., there is a direct association. For each ellipse that encapsulates more than one elementary groups, draw a dashed line. As a further example, we can take the graph used in [12]. Figure 3 shows the graph from that reference. Figure 4 shows the same graph after eliminating the intermediate nodes. Finally, Figures 5 and 6 show this graph in our notation (respectively, the Venn diagram and the elementary-group shorthand).  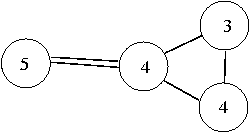 The shorthand graphs (as in Figure 6) may be useful in allowing one to see more easily when a big group or a small group is likely to be infected by bad information. They also identify the logical structure of the nodes clearly. However, this procedure is complex and work intensive in any large graph. We therefore introduce a more general and powerful method that can be used to perform the same organization. This method identifies coarse logical regions in a graph by identifying nodes that are close to particularly central or important nodes and then finding those nodes that connect them together. Node Centrality and the Spread of Information In this section, we consider the
connected components of networks and propose criteria for
deciding which nodes are most likely to infect many other nodes, if
they are compromised. We do this by examining the relative
connectivity of graphs along multiple pathways.
Degree of a node: In a non-directed graph, the number of links
connecting node i to all other nodes is called the degree ki of the node. What are the best connected nodes in a graph? These are certainly nodes that an attacker would like to identify, since they would lead to the greatest possible access, or spread of damage. Similarly, the security auditor would like to identify them and secure them, as far as possible. From the standpoint of security, then, important nodes in a network (files, users, or groups in the shorthand graph) are those that are `well-connected.' Therefore we seek a precise working definition of `well-connected,' in order to use the idea as a tool for pin-pointing nodes of high security risk. A simple starting definition of well-connected could be `of high degree': that is, count the neighbors. We want however to embellish this simple definition in a way that looks beyond just nearest neighbors. To do this. we borrow an old idea from both common folklore and social network theory [13]: an important person is not just well endowed with connections, but is well endowed with connections to important persons. The motivation for this definition is clear from the example in Figure 8. It is clear from this figure that a definition of `well- connected' that is relevant to the diffusion of information (harmful or otherwise) must look beyond first neighbors. In fact, we believe that the circular definition given above (important nodes have many important neighbors) is the best starting point for research on damage diffusion on networks. 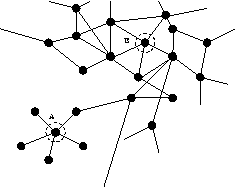 Now we make this circular definition precise. Let vi denote a vector for the importance ranking, or connectedness, of each node i. Then, the importance of node i is proportional to the sum of the importances of all of i's nearest neighbors: 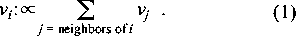 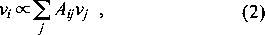  by any constant and the equation
remains the same. We can thus rewrite eqn. (2) as
by any constant and the equation
remains the same. We can thus rewrite eqn. (2) as
  N matrix, it has N eigenvectors (one for each
node in the network), and correspondingly many eigenvalues. The
eigenvector of interest is the principal eigenvector, i.e., that with
highest eigenvalue, since this is the only one that results from
summing all of the possible pathways with a positive sign. The
components of the principal eigenvector rank how `central' a node is
in the graph. Note that only ratios vi /
vj of the components are meaningfully determined.
This is because the lengths
vivi of the eigenvectors
are not determined by the eigenvector equation. N matrix, it has N eigenvectors (one for each
node in the network), and correspondingly many eigenvalues. The
eigenvector of interest is the principal eigenvector, i.e., that with
highest eigenvalue, since this is the only one that results from
summing all of the possible pathways with a positive sign. The
components of the principal eigenvector rank how `central' a node is
in the graph. Note that only ratios vi /
vj of the components are meaningfully determined.
This is because the lengths
vivi of the eigenvectors
are not determined by the eigenvector equation.
This form of well-connectedness is termed `eigenvector centrality' [13] in the field of social network analysis, where several other definitions of centrality exist. For the remainder of the paper, we use the terms `centrality' and `eigenvector centrality' interchangeably. We believe that nodes with high eigenvector centrality play a important role in the diffusion of information in a network. However, we know of few studies (see [14]) which test this idea quantitatively. We have proposed this measure of centrality as a diagnostic instrument for identifying the best connected nodes in networks of users and files [2, 15]. 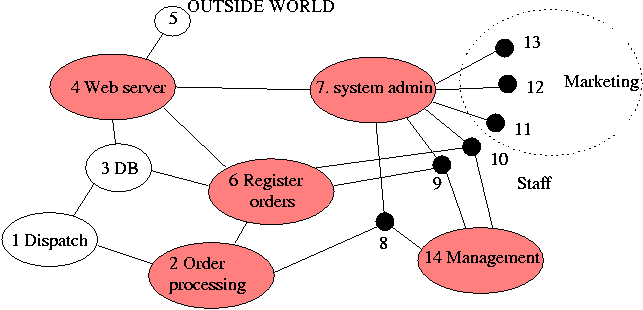 When a node has high eigenvector centrality (EVC), it and its neighborhood have high connectivity. Thus in an important sense EVC scores represent neighborhoods as much as individual nodes. We then want to use these scores to define clusterings of nodes, with as little arbitrariness as possible. (Note that these clusterings are not the same as user groups - although such groups are unlikely to be split up by our clustering approach.) To do this, we define as Centers those nodes whose EVC is higher than any of their neighbors' scores (local maxima). Clearly these Centers are important in the flow of information on the network. We also associate a Region (subset of nodes) with each Center. These Regions are the clusters that we seek. We find that more than one rule may be reasonably defined to assign nodes to Regions; the results differ in detail, but not qualitatively. One simple rule is to use distance (in hops) as the criterion: a node belongs to a given Center (i.e., to its Region) if it is closest (in number of hops) to that Center. With this rule, some nodes will belong to multiple regions, as they are equidistant from two or more Centers. This set of nodes defines the Border set. The picture we get then is of one or several regions of the graph which are well-connected clusters - as signalled by their including a local maximum of the EVC. The Border then defines the boundaries between these regions. This procedure thus offers a way of coarse- graining a large graph. This procedure is distinct from that used to obtain the shorthand graph; the two types of coarse-graining may be used separately, or in combination. Centrality ExamplesTo illustrate this idea, consider a human-computer system for Internet commerce depicted in Figure 8. This graph is a mixture of human and computer elements: departments and servers. We represent the outside world by a single outgoing or incoming link (node 5). The organization consists of a web server connected to a sales database, that collects orders which are then passed on to the order registration department. These collect money and pass on the orders to order processing who collect the orders and send them to dispatch for postal delivery to the customers. A marketing department is linked to the web server through the system administrator, and management sits on the edge of the company, liaising with various staff members who run the departments. Let us find the central resource sinks in this organization, first assuming that all of the arcs are equally weighted, i.e., contribute about the same amount to the average flow through the organization. We construct the adjacency matrix, compute its principal eigenvector and organize the nodes into regions, as described above. The result is shown in Figure 9. 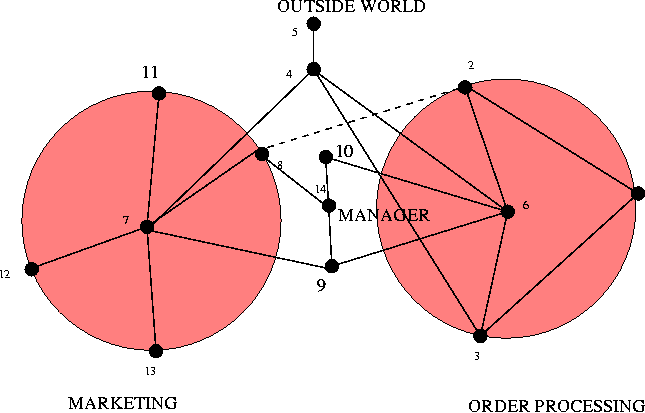 Node 7 is clearly the most central. This is the system administrator. This is perhaps a surprising result for an organization, but it is a common situation where many parts of an organization rely on basic support services to function, but at an unconscious level. This immediately suggests that system administration services are important to the organization and that resources should be given to this basic service. Node 6 is the next highest ranking node; this is the order registration department. Again, this is not particularly obvious from the diagram alone: it does not seem to be any more important than order processing. However, with hindsight, we can see that its importance arises because it has to liaise closely with all other departments. Using the definitions of regions and bridges from the previous section, we can redraw the graph using centrality to organize it. The result is shown in Figure 9. The structure revealed by graph centrality accurately reflects the structure of the organization: it is composed largely of two separate enterprises: marketing and order processing. These departments are bound together by certain bridges that include management and staff that liaise with the departments. Surprisingly, system administration services fall at the center of the staff/marketing part of the organization. Again, this occurs because it is a critical dependency of this region of the system. Finally the web server is a bridge that connects both departments to the outside world - the outside hanging on at the periphery of the systems. To illustrate the ideas further we present data from a large graph, namely, the Gnutella peer-to-peer file-sharing network, viewed in a snapshot taken November 13, 2001 [16]. In this snapshot the graph has two disconnected pieces - one with 992 nodes, and one with three nodes. Hence for all practical purposes we can ignore the small piece, and analyze the large one. Here we find that the Gnutella graph is very well-connected. There are only two Centers, hence only two natural clusters. These regions are roughly the same size (about 200 nodes each). This means, in turn, that there are many nodes (over 550!) in the Border. In Figure 10 we present a visualization of
this graph, using Centers, Regions, and the Border as a way of
organizing the placement of the nodes using our Archipelago tool [17].
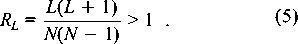
Both the figure and the numerical results support our description of this graph as well-connected: it has only a small number of Regions, and there are many connections (both Border nodes, and links) between the Regions. We find these qualitative conclusions to hold for other Gnutella graphs that we have examined. Our criteria for a well- connected graph are consonant with another one, namely, that the graph has a power-law node degree distribution [10]. Power-law graphs are known to be well-connected in the sense that they remain connected even after the random removal of a significant fraction of the nodes. And in fact the (self-organized) Gnutella graph shown in Figure 10 has a power-law node degree distribution. 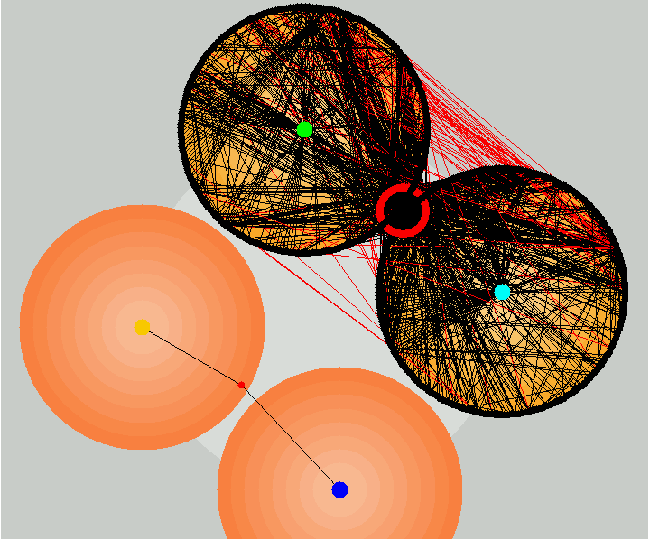 We believe that poorly-connected (but still percolating) graphs will be revealed, by our clustering approach, to have relatively many Centers and hence Regions, with relatively few nodes and links connecting these Regions. Thus, we believe that the calculation of eigenvector centrality, followed by the simple clustering analysis described here (and in more detail in [15]), can give highly useful information about how well connected a graph is, which regions naturally lie together (and hence allow rapid spread of damaging information), and where are the boundaries between such easily- infected regions. All of this information should be of utility in analyzing a network from the point of view of security. Percolation: The Spread of Information in the GraphHow many links or channels can one add to a graph, at random, before the system becomes essentially free of barriers? This question is known as the percolation problem and the breakdown of barriers is known as the formation of a giant cluster in the graph. A graph is said to percolate if every node can reach every other by some route. This transition point is somewhat artificial for use as a management criterion, since links are constantly being made and broken, particularly in a mobile partially-connected environment of modern networks. Rather we are interested in average properties and probabilities. One of the simplest types of graph is the hierarchal tree. Hierarchical graphs are not a good model of user-file associations, but they are representative of many organizational structures. A very regular hierarchical graph in which each node has the same degree (number of neighbors) is known as the Cayley tree. Studies of percolation phase transitions in the Cayley model can give some insight into the computer security problem: at the `percolation threshold' essentially all nodes are connected in a `giant cluster' - meaning that damage can spread from one node to all others. For link density (probability) below this threshold value, such widespread damage spreading cannot occur. For small, fixed graphs there is often no problem in exploring the whole graph structure and obtaining an exact answer to this question. The most precise small-graph criterion for percolation comes from asking how many pairs of nodes, out of all possible pairs, can reach one another in a finite number of hops. We thus define the ratio RC of connected pairs of nodes to the total number of pairs that could be connected: 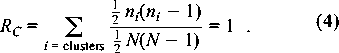 If we wish to simplify this rule for ease of
calculation, we can take ni The
problem with these criteria is that one does not always have access
to perfect information about real organizations. Even if such
information were available, security administrators are not so much
interested in what appears to be an accurate snapshot of the present,
as in what is likely to happen in the near future. Socially motivated
networks are not usually orderly, like hierarchical trees, but have
a strong random component. We therefore adapt results from the theory
of random graphs to obtain a statistical estimate for the likelihood
of percolation, based on remarkably little knowledge of the system.
To study a random graph, all we need is an estimate or knowledge
of their degree distributions. Random graphs, with arbitrary node
degree distributions pk have been studied in
[12], using the method of generating functionals. This method uses a
continuum approximation, using derivatives to evaluate probabilities,
and hence it is completely accurate only in the continuum limit of
very large number of nodes N.
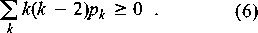
We shall not reproduce here the argument of [12] to derive the
condition for the probable existence of a giant cluster, but simply
quote it for a uni-partite random graph with degree distribution
pk.
The problem with the above expression is clearly that it is
derived under the assumption of there being a smooth differentiable
structure to the average properties of the graphs. For a small graph
with N nodes the criterion for a giant cluster becomes
inaccurate. Clusters do not grow to infinity, they can only grow to
size N at the most, hence we must be more precise and use a
dimensionful scale rather than infinity as a reference point. The
correction is not hard to identify; the threshold point can be taken
to be as follows.
The expression in (7) is not much more complex than the large-
graph criterion. Moreover, all of our small-graph criteria retain
their validity in the limit of large N. Hence we expect these
small- graph criteria to be the most reliable choice for testing
percolation in small systems. This expectation is borne out in the
examples below.
From testing of the various criteria, the exact and statistical
estimates are roughly comparable in their ability to detect
percolation. The statistical tests we have examined are useful when
only partial information about a graph is available.
Our reference implementation of the above criteria for testing
node vulnerability and information flow, is a Java application
program, with associated Perl scripts, which we call Archipelago. The
name of the program is based on the whimsical association of our model
of regions and bridges. An archipelago is a volcanic island that
usually takes the form of a characteristic arc of tops jutting out of
the water level. The tops look separate but are actually bridged just
under water by a volcanic saddle. This is the form that arises
naturally from organizing the visual layout of graphs according to
centrality. The Archipelago application accepts, as input, an adjacency matrix
of a graph. This can be entered manually or generated, e.g., by a Perl
script that scans Unix file group associations. Archipelago calculates
centrality and percolation criteria and organizes the regions into an
archipelago of central peaks surrounded by their attendant nodes
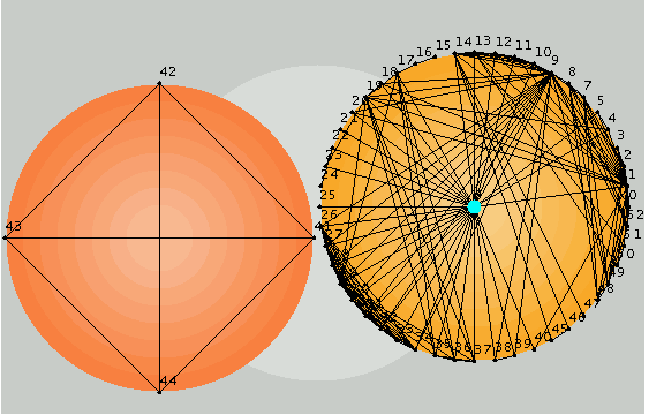
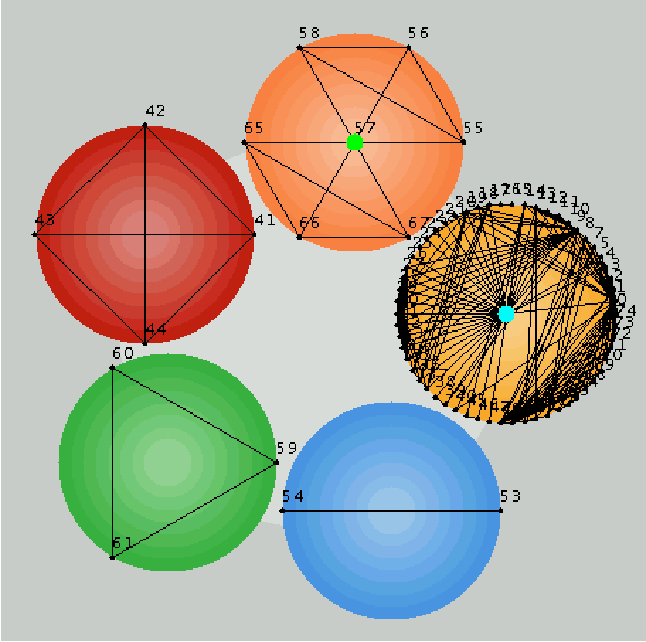
(colored in black). Nodes and links that act as bridges between the
regions are colored red to highlight them, and disconnected fragments
are colored with different background tints to distinguish them (see
Figures 11 and 12).
The Application allows one to zoom in and move nodes around to
increase the clarity of representation. One can also add and remove
nodes and links to examine the vulnerability of the network to
individual node removal, or spurious link addition. A
database of information about the nodes is kept by the program, so
that regular SQL searches can be made to search for covert links
between users, based on common properties such as same family name,
or same address. The addition of even a single covert link can
completely change the landscape of a graph and make it percolate, or
depose unstable centers.
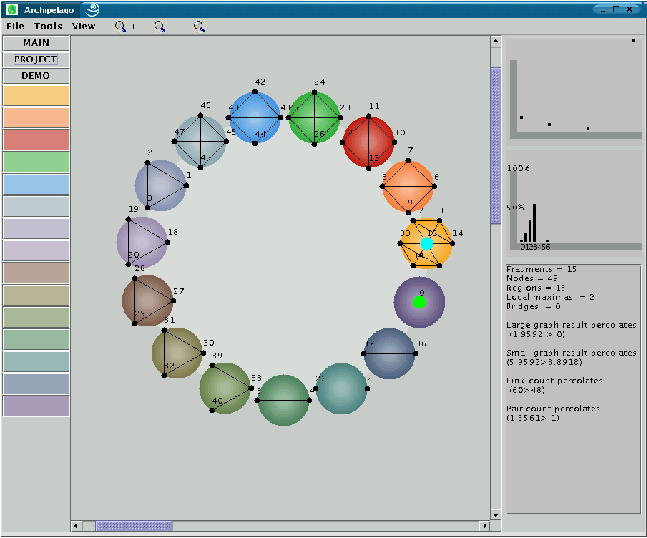
Analyses in the right hand panel of the
main window (Figure 11) show the histogram of the degree distribution
in the graph and a log- log plot of the same, in order to reveal power
law distributions that are considered to be particularly robust. We envisage several potential
uses for this network analysis tool. We have already discussed some
of these. Even armed with only centrality and percolation estimates,
there is great flexibility in this mode of analysis. Determining how robust a network is to attack is
an obvious task for the tool. Centrality determines the nodes that
play the greatest role in the functioning of the system, and thus the
obvious targets for attack. We can use Archipelago to identify these
nodes and secure them from attack. Percolation, on the other hand,
tells us that if an attack should succeed somewhere, what is
the probability that it will lead to a significant security breach?
Techniques like these have been applied to the spread of viruses like
HIV in the world of medicine.
One result that is of future
interest to network services is that from analyzing the Gnutella graph
in Figure 10. Peer to peer technology has been claimed to be extremely
decentralized and therefore robust: there is no central control, and
hence no obvious point of attack. Our graph seems to contradict this
notion, at first glance: it shows that the entire Gnutella file
sharing network seems to split into two regions with two central
peaks. However, these peaks are extremely shallow. One can use
Archipelago to try `taking out' these centers to see if the network
can be broken up, and the spread of files curtailed. Attempting this
has very little effect on the graph, however. The centers are barely
above their neighbors, and the removal of a node simply makes way for
a neighbor. The structure of the graph is almost immune to node
deletions. That would not be the case in a hub-centralized network.
The same is not true of the other graphs, e.g., Figure 11. Here,
taking out a central node of the largest fragment can cause the
apparently tightly knit region to fall apart into more tenuously
bridged, logically separate regions. In Figure 8, we considered how graphical analysis could be used
to identify the places in a network where resources should be invested
in order to maintain workflow. Here, a reorganization based on
centrality illuminates the logical structure of the organization
nicely. It consists of two regions: marketing and order processing,
bound together by a human manager and a web server. The most central
players in this web are the system administrator (who is relied upon
by the staff and the servers), and the order processing department.
The secure, continued functioning of this organization thus relies on
sufficient resources being available to these two pieces of the
puzzle. We see also an economic interpretation to the system that
speaks of continuity in the face of component failure. ISO17799
considers this to be a part of systemic security, and we shall not
argue. Finally, a speculative, but
plausible way of using this analysis is in the solving of puzzles,
crimes and other associative riddles. A forensic investigator is
interested in piecing together various clues about who or what caused
a breach of security. Such webs of clues are networks or graphs. The
investigator would like to find the percolating fragments of a graph
to see how associations link different persons together. It is not
implausible that the most central nodes in such a graph would be key
to solving the mystery, either as places to look for more clues, or
as masterminds behind the scheme.
One example, where this has
been tested is in a case involving cheating on an electronic computer
aided exam at OUC. Cheating was made possible by a failure of security
in a server at an inopportune time. From printer logs it was possible
to find out who had printed out a copy of the solutions to the exam
during the test. From submissions of results and server logs, it was
possible to match IP addresses to MAC addresses and student numbers
and find out who was sitting close together during the test. From
patterns of group project work, it was known which students generally
worked together and would be likely to share the solution with one
another. Finally, the submitted work, time and grades provided other
correlations between students. The resulting network had a percolating
component that implicated a group of students. It was later found that
many of these were also connected as another kind of social subgroup
of the class. Thus all of the clues resulted in the formation of a
percolating web of `suspects.'
The results, while not conclusive,
provided a better than chance picture of who was likely implicated in
the deception. Later information, from concerned students confirmed
which of these were definite offenders and showed the central nodes
in the network to be at the heart of the group who had originally
printed out the solution. While this did not solve the crime
completely, it pointed obvious fingers that made it possible to extend
the analysis and learn much more than would otherwise have been
possible.
We hope to go back to this kind of investigative work
for further study and see whether it is possible to develop it into
a truly useful tool.
Archipelago's database was intended for
storing the kind of supporting information that could possibly lead
to `hidden links' being identified in graphs. For instance, if one
searched the database for users who live at the same address, this
would be a good cause to add a possible link to a graph, associating
nodes with one another. Different strengths of connections between
nodes could also be used to add a further level of gradation to the
importance of connections. This added feature may be implemented
easily, since it simply entails changing the binary entries of the
adjacency matrix to real numbers, reflecting bond strengths. We have implemented a graphical analysis tool
for probing security and vulnerability within a human-computer
network. We have used a number of analytical tests derived in [2];
these tests determine approximately when a threshold of free flow of
information is reached, and localize the important nodes that underpin
such flows.
We take care to note that the results we cite here
depend crucially on where one chooses to place the boundaries for the
network analysis. The methods will naturally work best when no
artificial limits are placed on communication, e.g., by restricting
to a local area network if there is frequent communication with the
world beyond its gateway. On the other hand, if communication is
dominated by local activity (e.g., by the presence of a firewall) then
the analysis can be successfully applied to a smaller vessel.
At
the start of this paper, we posed some basic questions that we can
now answer. An attacker could easily perform the same
analyses as a security administrator and, with only a superficial
knowledge of the system, still manage to find the weak points. An
attacker might choose to attack a node that is close to a central hub,
since this attracts less attention but has a high probability of total
penetration, so knowing where these points are allows one to implement
a suitable protection policy. It is clear that the degree of danger
is a policy dependent issue: the level of acceptable risk is different
for each organization. What we have found here is a way of comparing
strategies, that would allow us to minimize the relative risk,
regardless of policy. This could be used in a game-theoretical
analysis as suggested in [18]. The measurement scales we have obtained
can easily be programmed into an analysis tool that administrators
and security experts can use as a problem solving `spreadsheet' for
security. We are constructing such a graphical tool that
administrators can use to make informed decisions [17].
There
are many avenues for future research here. Understanding the
percolation behavior in large graphs is a major field of research;
several issues need to be understood here, but the main issue is how
a graph splits into different clusters in real computer systems. There
are usually two mechanisms at work in social graphs: purely random
noise and node attraction - a `rich get richer' accumulation of links
at heavily connected sites. Further ways of measuring centrality are
also being developed and might lead to new insights. Various
improvements can be made to our software, and we shall continue to
develop this into a practical and useful tool. Archipelago is available from Oslo University College https://www.iu.hio.no/archipelago.
GC and KE were partially supported by
the Future & Emerging Technologies unit of the European Commission
through Project BISON (IST-2001-38923). Tuva Stang and Fahimeh Pourbayat are final year bachelor students
at Oslo University College; they are the principal eigenvectors of
Archipelago. They can be contacted at TuvaHassel.Stang@iu.hio.no, and
Fahimeh.Pourbayat@iu.hio.no for a limited time.
Mark Burgess is
an associate professor at Oslo University College. He is the author
of several books and of the system administration tool cfengine and
is especially interested in mathematical methods in system
administration. He can be contacted at mark@iu.hio.no.
Geoff
Canright works with the Peer-to-peer Computing Group at Telenor R&D.
He is interested in network analysis, self-organizing networks, and
search on distributed information systems. He can be contacted at
Geoffrey.Canright@telenor.com.
Kenth Engo works with the Future
Com Business Group at Telenor R&D. He is interested in network
analysis, risk analysis, and searching on networks.
Asmund
Weltzien works with the Peer-to-peer Computing Group at Telenor R&D.
He is interested in (social) network analysis, innovation theory and
spontaneous local network technologies.
|
|
This paper was originally published in the
Proceedings of the 17th Large Installation Systems Administration Conference,
October 26–31, 2003, San Diego, CA, USA Last changed: 17 Sept. 2003 aw |
|
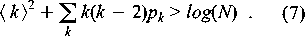
 log N. In the
criterion above, the criterion for a cluster that is much greater than
unity is that the right hand side is greater than zero. To this we
now add the magnitude of the uncertainty in order to reduce the
likelihood of an incorrect conclusion.
log N. In the
criterion above, the criterion for a cluster that is much greater than
unity is that the right hand side is greater than zero. To this we
now add the magnitude of the uncertainty in order to reduce the
likelihood of an incorrect conclusion.