For each selected link pair, we measured ![]() as follows. For each
link in the pair, we measured the unicast throughput using 1000 byte
UDP packets for 30 seconds. Immediately afterwards, we measured the
aggregate throughput of the two links operating together, again using
unicast UDP packets for 30 seconds. Using the definition in Equation
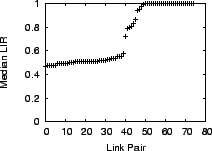
(1) we calculated the LIR for this pair. Testing links in
a pair in quick succession helps mitigate the impact of environmental
variations. We repeated the experiment 5 times for each of our 75
link pairs. Thus the total duration of the experiment was just under
10 hours The median LIR value for these 75 link pairs are shown in
Figure 2. Note that testing all 9168 pairs
would have required more than 1100 hours.
as follows. For each
link in the pair, we measured the unicast throughput using 1000 byte
UDP packets for 30 seconds. Immediately afterwards, we measured the
aggregate throughput of the two links operating together, again using
unicast UDP packets for 30 seconds. Using the definition in Equation
(1) we calculated the LIR for this pair. Testing links in
a pair in quick succession helps mitigate the impact of environmental
variations. We repeated the experiment 5 times for each of our 75
link pairs. Thus the total duration of the experiment was just under
10 hours The median LIR value for these 75 link pairs are shown in
Figure 2. Note that testing all 9168 pairs
would have required more than 1100 hours.
First, note that we have several link pairs with intermediate LIR
values between 0.5 and 1. In other words, interference is not a binary
phenomenon. To compare this data with the binary predictions of ![]() ,
, ![]() and
and ![]() models, we must pick a threshold,
models, we must pick a threshold, ![]() . If
. If ![]() ,
we deem the links to have interfered in our experiment. If
,
we deem the links to have interfered in our experiment. If
![]() , we deem that the links did not interfere.
, we deem that the links did not interfere.
Of the 75 node pairs, 24 pairs have LIR of 1. Thus, in each of these 24
pairs, the two links do not interfere with each other. Five other link
pairs have ![]() values between 1 and 0.9. Given the minimal interference,
we classify these link pairs as non-interfering as well. Thus, we
set
values between 1 and 0.9. Given the minimal interference,
we classify these link pairs as non-interfering as well. Thus, we
set ![]() . With this threshold, we have 29 pairs in which
links do not interfere, and 46 pairs in which the links do interfere.
. With this threshold, we have 29 pairs in which
links do not interfere, and 46 pairs in which the links do interfere.
We see that the ![]() model is too pessimistic for our network, since
we do have 29 non-interfering link pairs. On the other hand, the
model is too pessimistic for our network, since
we do have 29 non-interfering link pairs. On the other hand, the ![]() model is too optimistic. The two links in each pair do not share an
endpoint, so according to the
model is too optimistic. The two links in each pair do not share an
endpoint, so according to the ![]() mode, none of the link pairs should
show any interference. Yet, we have 46 link pairs in which the links
do interfere.
mode, none of the link pairs should
show any interference. Yet, we have 46 link pairs in which the links
do interfere.
The ![]() model is harder to verify. It is defined in terms of distance
between nodes. We found that the predictions made using distance are
quite inaccurate in our testbed. In an indoor testbed like ours, the
radio signal propagation is also affected by office walls and other
obstacles. There is no easy way to incorporate this information in
the model. Therefore, we define a variant of the
model is harder to verify. It is defined in terms of distance
between nodes. We found that the predictions made using distance are
quite inaccurate in our testbed. In an indoor testbed like ours, the
radio signal propagation is also affected by office walls and other
obstacles. There is no easy way to incorporate this information in
the model. Therefore, we define a variant of the ![]() model that does
not rely on physical distance between nodes. We will say that a pair of
links
model that does
not rely on physical distance between nodes. We will say that a pair of
links ![]() and
and ![]() interfere if there is a 2 hop (or shorter)
path from
interfere if there is a 2 hop (or shorter)
path from ![]() to
to ![]() , or from
, or from ![]() to
to ![]() . In other words, the modified
model says that a pair of links will interfere if the sender of one link
is within two hops of the other link's receiver. Note that ``hop'' is
just another term for a wireless link. This variant of the
. In other words, the modified
model says that a pair of links will interfere if the sender of one link
is within two hops of the other link's receiver. Note that ``hop'' is
just another term for a wireless link. This variant of the ![]() model
predicted that 56 of the 75 link pairs will show interference. In our
experiments, we observed interference in only 46 of these 56 pairs. The
other 10 pairs did not show interference in our experiments. On the
other hand, the model predicted no interference for 19 pairs. We indeed
did not observe interference in any of these 19 pairs. These numbers
are summarized in Table 1. The conclusion is that the
model is pessimistic: it errs on the side of predicting interference
even when there is none.
model
predicted that 56 of the 75 link pairs will show interference. In our
experiments, we observed interference in only 46 of these 56 pairs. The
other 10 pairs did not show interference in our experiments. On the
other hand, the model predicted no interference for 19 pairs. We indeed
did not observe interference in any of these 19 pairs. These numbers
are summarized in Table 1. The conclusion is that the
model is pessimistic: it errs on the side of predicting interference
even when there is none.
It may appear that the model seems pessimistic because we used ![]() to classify experimental observations, and it is too low a
threshold. However, even if we use
to classify experimental observations, and it is too low a
threshold. However, even if we use ![]() to classify experimental
observations (and hence classify more pairs as interfering), the model
still incorrectly predicts interference in 7 pairs that do not see any
interference.
to classify experimental
observations (and hence classify more pairs as interfering), the model
still incorrectly predicts interference in 7 pairs that do not see any
interference.
The pessimistic nature of the model is probably due to the indoor
setting of our testbed. In such an environment, the radio signal degrades
much faster than it would in free space, thus limiting the overall
interference. We also evaluated a 1-hop variant of the model,
which turned out to be optimistic. We believe that it may be possible
to modify the 1-hop variant further to provide better predictions.
However, there is no guarantee that the predictions of the 1-hop model
will be accurate in other environments. Furthermore, even the improved
model will provide only binary predictions. In the following section,
we present a measurement-based approach which automatically takes into
account the impact of environmental factors, and is capable of predicting
intermediate values of ![]() .
.