Joseph Tucek, Shan Lu, Chengdu Huang, Spiros Xanthos and Yuanyuan Zhou
Department of Computer Science, University of Illinois at Urbana Champaign, IL 61801
Production run software failures cause endless grief to end-users, and endless challenges to programmers as they commonly have incomplete information about the bug, facing great hurdles to reproduce it. Users are often unable or unwilling to provide diagnostic information due to technical challenges and privacy concerns; even if the information is available, failure analysis is time-consuming.
We propose performing initial diagnosis automatically and at the end user's site. The moment of failure is a valuable commodity programmers strive to reproduce--leveraging it directly reduces diagnosis effort while simultaneously addressing privacy concerns.
Additionally, we propose a failure diagnosis protocol. So far as we know, this is the first such automatic protocol proposed for on-line diagnosis. By mimicking the steps a human programmer follows dissecting a failure, we deduce important failure information. Beyond on-line use, this can also reduce the effort of in-house testing.
We implement some of these ideas. Using lightweight checkpoint and rollback techniques and dynamic, run-time software analysis tools, we initiate the automatic diagnosis of several bugs. Our preliminary results show that automatic diagnosis can efficiently and accurately find likely root causes and fault propagation chains. Further, normal execution overhead is only 2%.
Software failures contribute greatly to down time and security holes. Despite expending enormous effort in software testing prior to release, software failures still occur during production runs, as faults slip through even strict testing. The ubiquity of bugs in production runs is strong testimony to the fact that addressing production run software failures is critical.
While much work has been conducted on software failure diagnosis, previous work focuses on off-line diagnosis. Tools like interactive debuggers, or more advanced tools like data slicing [16], backtracking [7] and deterministic replay [8,12] can help, but require manual effort, and so cannot be used for production runs. Other off-line techniques such as delta debugging [15] and failure-inducing-chop inference [4] automate some parts of off-line diagnosis, yet impose high overhead.
Current on-line tools focus on data collection, as failure reproduction is difficult. Tools like [1,8,13] help, but can slow down programs significantly (over 100X [9]). Reducing overhead requires either sacrificing detail (e.g. by only tracing system calls [14]) or expensive, undeployed hardware extensions [8,13]. Regardless, users don't release such information due to privacy and confidentiality concerns, and even if provided, such ``raw'' data is time consuming to manually search for root causes.
It would be desirable if diagnosis was automatically conducted on-line as a software failure occurs, and if only summarized diagnosis results were sent back. This has several advantages:
(1) Leverage the failure environment and state. Since such diagnosis is done right after a software failure, almost all program states (memory, file, etc.) and execution environment information (e.g. user inputs, thread scheduling, etc.) are available, trivializing failure reproduction.
(2) Reduce programmer effort. Similar to the triage system of medicine, software failure diagnosis could automate finding some useful clues (e.g. failure-triggering inputs). This would significantly reduce programmer's effort. Of course, nobody expects paramedics to cure patients, nor software to fix bugs, but both can offload the initial steps. Moreover, such automated diagnosis also applies to in-house testing.
(3) Address users' privacy concerns. If failure diagnosis is conducted on-line at the user's machine, private data and execution traces need not be sent out. After diagnosis, results (e.g. buggy instructions, root cause candidates, triggering inputs, etc.) can be sent out in a form more condensed and transparent to users than core dumps or traces. Indeed, we feel that excluding core dumps increases the amount of information programmer's receive: if users are wary of core dumps, the programmer will receive nothing.
(4) Guide failure recovery and avoid future failures. Immediate and automatic diagnostic results would be available in time to help failure recovery in subsequent executions. For example, identifying failure-triggering inputs allows such inputs to be filtered prior to a programmer creating a patch.
Although on-line diagnosis is clearly desirable, it faces several challenges. First, normal execution overhead must be low; users are unwilling to sacrifice much performance for reliability. Second, on-line diagnosis mandates a lack of human guidance. All information collection, reasoning, and analysis must be automated. Finally, diagnosis times must be short. End users are impatient, and even if normal-run overhead is low, diagnosis time is strictly limited.
(1) Capture the failure point and conduct
just-in-time failure diagnosis with checkpoint-re-execution
system support. Traditional techniques expend equal monitoring and
tracing effort throughout execution; this is wasteful given
that most production runs are failure-free. Instead, by taking
light-weight checkpoints during execution and rolling back after a
failure, diagnosis must be done only after a failure has
occurred. Heavy-weight code instrumentation and advanced analysis can
be repeatedly applied post-failure re-execution, minimizing
normal-case overhead. In this scheme, the diagnostic tools have most,
if not all, failure-related information at hand, while diagnosis is
focused on the execution period closest to the failure.
In combination with system support for re-execution,
heavy-weight tools become feasible for on-line diagnosis.
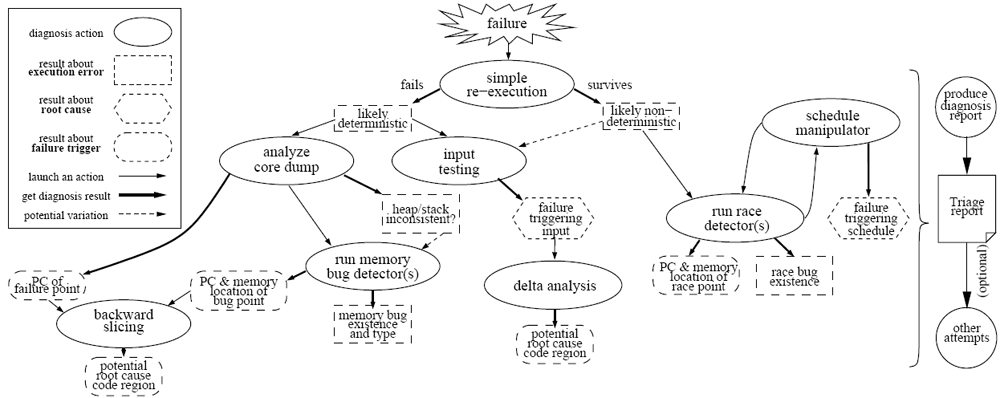
(2) A novel automated top-down human-like
software failure diagnosis protocol. We propose a framework (see
Figure 1 which assembles the manual debugging
process. This Triage Diagnosis Protocol (TDP) takes over the
role of humans in diagnosis. At each step, known information is used
to select the appropriate next diagnostic technique. Within the
framework, many different diagnosis techniques, such as core dump
analysis, bug detection, backward slicing, etc., may be
integrated. Additionally, using the results of past
steps to guide and as inputs to future steps increases their power and
usefulness. In combination, these tools can potentially extract and
deduce much useful information about a software failure, including bug
type and location, likely root causes and fault propagation chains,
failure triggering inputs, failure triggering execution environments,
and even provide potential temporary fixes (such as input filters).
|
The goal is to perform an initial diagnosis before reporting back to the programmers. This is similar to the triage system used in medical practice: in case of emergency, paramedics must perform the first steps: providing first aid, sorting out which patients are most critical, measuring vitals, etc. Similarly, given a software emergency (a program failure), programmers cannot immediately begin debugging. The immediate response must be provided by some pre-diagnosis tools to provide the programmer with useful clues for diagnosis.
To realize this goal, in light of the previously mentioned challenges, we innovatively combine several key, novel ideas:
(1) Capture the moment of failure. When a program fails, we have something valuable: the failure state and failure-triggering environment. Rather than let this moment pass, we capture it and leverage it fully. Therefore, unlike most previous approaches that pay high overhead to record copious information (e.g. execution traces) to reproduce the failure off-line, we propose to perform diagnosis immediately after the failure.
(2) Exploit sandboxed re-execution to reduce normal-run overhead. Rather than instrumenting continuously, system support for rollback and re-execution from a recent checkpoint allows analysis only after a failure has occurred. This eliminates the ``blind'' collection of information during normal runs to greatly reduce overhead-instead this is deferred to after a failure. Also, failure symptoms and the results of previous analysis can allow a dynamic determination of what needs to be done. If we already have evidence that the bug is probably deterministic, a race detector is useless-without rollback the instrumentation must be ``always on'' even for unrelated bugs.
(3) Automatically perform human-like top-down failure diagnosis. Inspired by manual debugging, the TDP provides a top-down failure-guided diagnosis. Based on the failure symptom and previous diagnosis results, TDP automatically decides the next step of instrumentation or analysis.
(4) Leverage various dynamic bug detection and fault localization techniques. The TDP, in combination with re-execution, allows many existing (or future) bug detection and fault isolation techniques to be applied. As proof of concept, we prototype a memory bug detector and a program backward slicer, both of which are dynamically plugged in during re-execution via dynamic binary instrumentation. Although information from the very beginning of execution is unavailable, working around this requires only minimal modifications. The memory bug detector synergistically provides input to the backward slicer, resulting in accurate failure information.
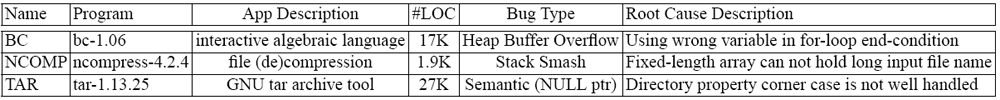
In this section, we present preliminary results on a few bugs
(Table 1) by combining memory bug detection and backward
slicing. We also present performance results showing the feasibility
of production-run deployment.
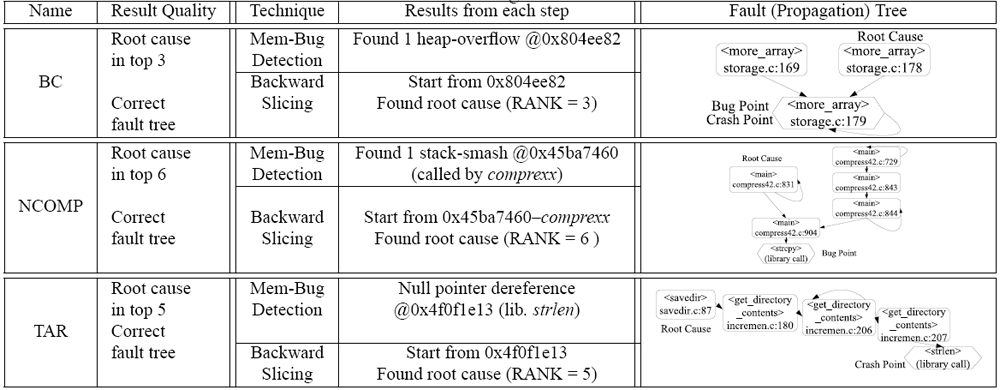
| Table 2: Preliminary diagnosis results. (Fault trees are built in slicing step based on previous steps' result for deterministic failures.) |
Table 2 presents the results of combining memory bug detection and backward slicing to diagnose bugs. For all three of the bugs, the specific type of bug (heap-overflow, stack-smashing, or null-pointer) is correctly identified. Especially for BC and NCOMP, this is extra information beyond what a core-dump would provide. Furthermore, backward slicing from the initial fault reaches the root cause instruction in 6 instructions or less.
As shown in Table 2, the type of bug is correctly determined for all 3 failures. Also, in the case of BC and NCOMP, memory bug detection provides a point along the fault propagation chain much closer to the fault than the actual failure point. Heap and stack overflows corrupt data without causing a failure at that time. This points to a shortcoming of core-dumps-the programmer may be able to tell that a heap or a stack overflow occurred, but has no idea of where the overflow happened. Also, for the NCOMP bug, the corruption of the stack prevents simply walking back along the stack activation records to trace the bug. Another benefit is improving the later backward slicing. The more precise point along the fault propagation chain reduces the size of the propagation tree and reduces the time needed.
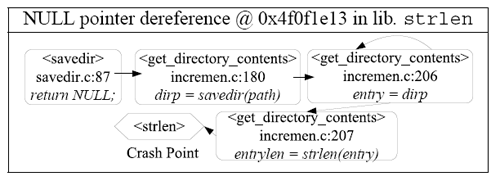
As shown in Table 3, the failing instruction is a null pointer dereference by strlen. Unfortunately, memory bug detection only gives the failing point, and not why the pointer is null. Backward slicing results balance the lack of information about the bug. As shown in the fault tree of the report, the crashing code is strlen(entry), shown at the root of the tree. Tracing backward along the tree, we will see that the argument entry is returned from savedir. Additionally, NULL is explicitly assigned to it in that function. Actually, if we look at the source line just above the NULL assignment, we will see that this NULL assignment happens when an opendir call to the input directory fails. Note that even though the fault tree is short and simple, it is difficult to get it without backward slicing. It is impossible with just a core dump, because the function savedir has already returned and so the stack frame is gone. Also, just looking at the source code is also not easy, because the code crosses different files and get_directory_contents is a large function.
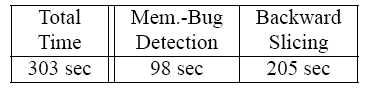
We should note that it is possible for diagnosis to proceed in the background, while recovery and return to normal service is performed in the foreground. Our implementation supports background diagnosis; we did not do so in order to provide isolated performance numbers for diagnosis. If ordinary activities continue in the foreground, diagnosis will take longer.
While the TDP provides an important first step toward on-line failure diagnosis, there is, of course, more work to be done. Currently we are implementing further steps in the TDP, such as race detection, input analysis, etc. We continue to explore the possibilities for more speculative tools. To further quantify the usefulness of the results, we intend to measure the reduction in debugging time when compared to core dumps and user descriptions. Finally, we are considering the potential of the TDP to be extended to support distributed applications.
This document was generated using the LaTeX2HTML translator Version 2002-2-1 (1.70)
Copyright © 1993, 1994, 1995, 1996,
Nikos Drakos,
Computer Based Learning Unit, University of Leeds.
Copyright © 1997, 1998, 1999,
Ross Moore,
Mathematics Department, Macquarie University, Sydney.
The command line arguments were:
latex2html -split 0 -show_section_numbers -local_icons -no_navigation paper.tex
The translation was initiated by on 2006-09-18