Dynamic Resource Allocation for Database Servers |
We introduce a novel multi-resource allocator to dynamically allocate resources for database servers running on virtual storage. Multi-resource allocation involves proportioning the database and storage server caches, and the storage bandwidth between applications according to overall performance goals. The problem is challenging due to the interplay between different resources, e.g., changing any cache quota affects the access pattern at the cache/disk levels below it in the storage hierarchy. We use a combination of on-line modeling and sampling to arrive at near-optimal configurations within minutes. The key idea is to incorporate access tracking and known resource dependencies e.g., due to cache replacement policies, into our performance model.
In our experimental evaluation, we use both micro-benchmarks and the industry standard benchmarks TPC-W and TPC-C. We show that our multi-resource allocation approach improves application performance by up to factors of 2.9 and 2.4 compared to state-of-the-art single-resource controllers, and their ad-hoc combination, respectively.
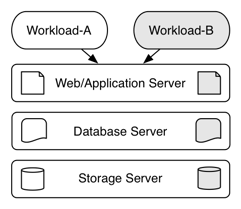
With the emerging trend towards server consolidation in large data centers, techniques for dynamic resource allocation for performance isolation between applications become increasingly important. With server consolidation, operators multiplex several concurrent applications on each physical server of a server farm, connected to a shared network attached storage (as in Figure 1). As compared to traditional environments, where applications run in isolation on over-provisioned resources, the benefits of server consolidation are reduced costs of management, power and cooling. However, multiplexed applications are in competition for system resources, such as, CPU, memory and disk, especially during load bursts. Moreover, in this shared environment, the system is still required to meet per-application performance goals. This gives rise to a complex resource allocation and control problem.
Currently, resource allocation to applications in state-of-the-art platforms occurs through different performance optimization loops, run independently at different levels of the software stack, such as, at the database server, operating system and storage server, in the consolidated storage environment shown in Figure 1. Each local controller typically optimizes its own local goals, e.g., hit-ratio, disk throughput, etc., oblivious to application-level goals. This might lead to situations where local, per-controller, resource allocation optima do not lead to the global optimum; indeed local goals may conflict with each other, or with the per-application goals [14]. Therefore, the main challenge in these modern enterprise environments is designing a strategy which adopts a holistic view of system resources; this strategy should efficiently allocate all resources to applications, and enforce per-application quotas in order to meet overall optimization goals e.g., overall application performance or service provider revenue.
Unfortunately, the general problem of finding the globally optimum partitioning of all system resources, at all levels to a given set of applications is an NP-hard problem. Complicating the problem are inter-dependencies between the various resources. For example, let’s assume the two tier system composed of database servers and consolidated storage server as in Figure 1, and several applications running on each database server instance. For any given application, a particular cache quota setting in the buffer pool of the database system influences the number and type of accesses seen at the storage cache for that application. Partitioning the storage cache, in its turn, influences the access pattern seen at the disk. Hence, even deriving an off-line solution, assuming a stable set of applications, and available hardware e.g., through profiling, trial and error, etc., by the system administrator, is likely to be highly inaccurate, time consuming, or both.
Figure 1: Data Center Infrastructure: We show a typical data-center architecture using consolidated storage
Due to these problems, with a few exceptions [17, 32], previous work has eschewed dynamic resource partitioning policies, in favor of investigating mechanisms for enforcing performance isolation, under the assumption that per-application quotas, deadlines or priorities are predefined e.g., manually, for each given resource type. Examples of such mechanisms include CPU quota enforcement [2, 16], memory quota allocation based on priorities [3], or I/O quota enforcement between workloads [9, 11, 12].
Moreover, typically, previous work investigated enforcing a given resource partitioning of a single resource, within a single software tier at a time. In our own previous work in the area of dynamic partitioning, we have investigated either partitioning memory, through a simulation-based exhaustive search approach [24], or partitioning storage bandwidth, through an adaptive feedback-loop approach [23], but not both.
In this paper, we consider the problem of global resource allocation, which involves proportioning the database and storage server caches, and the storage bandwidth among applications, according to overall performance goals. To achieve this, we focus on building a simple performance model in order to guide the search, by providing a good approximation of the overall solution. The performance model provides a resource-to-performance mapping for each application, in all possible resource quota configurations. Our key ideas are to incorporate readily available information about the application and system into the performance model, and then refine the model through limited experimental sampling of actual behavior. Specifically, we reuse and extend on-line models for workload characterization, i.e., the miss ratio curve (MRC) [32], as well as simplifications based on common assumptions about cache replacement policies. We further derive a disk latency model for a quanta-based disk scheduler [27] and we parametrize the model with metrics collected from the on-line system, instead of using theoretical value distributions, thus avoiding the fundamental source of inaccuracy in classic analytical models [10].
Finally, we refine the accuracy of the computed performance model through experimental sampling. We use statistical interpolation between computed and experimental sample points in order to re-approximate the per-application performance models, thus dynamically refining the model. We experimentally show that, by using this method, convergence towards near-optimal configurations can be achieved in mere minutes, while an exhaustive exploration of the multi-dimensional search space, representing all possible partitioning configurations, would take weeks, or even months.
We implement our technique using commodity software and hardware components without any modifications to interfaces between components, and with minimal instrumentation. We use the MySQL database engine running a set of standard benchmarks, i.e., the TPC-W e-commerce benchmark, and the TPC-C transaction processing benchmark. Our experimental testbed is a cluster of dual processor servers connected to a commodity storage hardware.
We show experiments for on-line convergence to a global partitioning solution for sharing the database buffer pool, storage cache, and disk bandwidth in different application configurations. We compare our approach to two baseline approaches, which optimize either the memory partitioning, or the disk partitioning, as well as combinations of these approaches without global coordination. We show that for most application configurations, our computed model effectively prunes most of the search space, even without any additional tuning through experimental sampling. Our dynamic resource algorithm performs similar to an experimental exhaustive search algorithm, but provides a solution within minutes, versus days of running time. At the same time, our global resource partitioning solution improves application performance by up to factors of 2.9 and 2.4 compared to state-of-the-art single-resource controllers and their ad-hoc combination, respectively.
The remainder of this paper is structured as follows. Section 2 provides a background on existing techniques for server consolidation in modern data centers, highlighting the need for a global resource allocation solution. We describe our multi-resource partitioning algorithm in Section 3. Section 4 describes our virtual storage prototype and sampling methodology in detail. Section 5 presents the algorithms we use for comparison, our benchmarks, and our experimental methodology, while Section 6 presents the results of our experiments on this platform. Section 7 discusses related work and Section 8 concludes the paper.
In this section, we present and evaluate the state-of-the-art in single resource partitioning and we show why these techniques are insufficient in themselves.
We describe previous work that either allocate the storage bandwidth, or cache/memory to several applications.
Storage Bandwidth Partitioning: Several disk scheduling policies [11, 12, 27, 29] for enforcing disk bandwidth isolation between co-scheduled applications have been proposed. We have implemented and compared the performance isolation guarantees provided by the following disk schedulers: (1) Quanta-based scheduling [27], (2) Start-time Fair Queuing (SFQ) [11], (3) Earliest Deadline First (EDF), (4) Lottery-based [29] and (5) Façade [12]. Our study [18] shows that the Quanta-based scheduler, where each workload is given a quantum of time for using the disk in exclusive mode, offers the best performance isolation level. This is because it allows the storage server to exploit the locality in I/O requests issued by an application during its assigned quantum, which in turn results in minimizing the effects of additional disk seeks due to inter-application interference. However, the existing algorithms discussed above assume that the I/O deadlines, or disk bandwidth proportions are given a priori. In this paper, we study how to dynamically determine the bandwidth proportions at runtime. Once the bandwidth proportions are determined, we use Quanta-based scheduling to enforce the allocations, since it provides the strongest isolation guarantees.
Memory/Cache Partitioning: Dynamic memory partitioning between applications is typically performed using the miss ratio curve (MRC) [32]. The MRC represents the page miss ratio versus the memory size, and can be computed dynamically through Mattson’s Stack Algorithm [13]. The algorithm assigns memory increments iteratively to the application with the highest predicted miss ratio benefit. MRC-based cache partitioning thus dynamically partitions the cache/memory to multiple applications, in such a way to optimize the aggregate miss ratio.
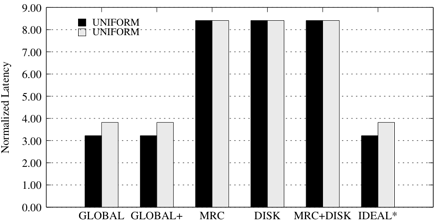
We present a simple motivating experiment that shows the need for multi-resource allocation. To simplify the presentation, we consider only accesses to the storage server, hence only the storage cache and the storage bandwidth resources. We run two synthetic workloads concurrently on the storage server: a small workload (Workload-A) with 1 outstanding request, and a large workload (Workload-B) with 10 outstanding requests, at any given time. Workload-A is cache friendly and achieves a cache hit ratio of 50% with a 1GB storage cache. In contrast, Workload-B is mostly un-cacheable; it obtains only a 5% hit ratio with a 1GB storage cache.
We run the workloads using several different configurations, i.e., uncontrolled sharing, partitioning the cache, disk or both between workloads. We normalize the latency of each workload relative to its latency running in isolation. Figure 2 presents our results. In all schemes, we use the combined application latencies (by simple summation) as the global optimization goal. We choose this simple metric for fairness of comparison with the miss ratio curve algorithm [32], which optimizes the aggregate miss ratio, hence the aggregate latency, while being agnostic to Service Level Objectives (SLOs) in general.
When running in isolation, Workload-A is able to utilize the 1 GB cache effectively and this results in an average storage access latency of 4.4ms. On the other hand, Workload-B does not benefit from the cache, resulting in an average storage access latency of 85.1ms. When the two workloads are run concurrently with uncontrolled resource sharing, the larger Workload-B dominates the smaller Workload-A at both cache and disk levels. This results in a factor of 6 slowdown for Workload-A and a factor of 4 slowdown for Workload-B. This result shows that workloads can suffer significant performance degradation when resource sharing is not controlled.
Next, we run the workloads using different resource partitioning algorithms. First, we partition the storage cache using the miss ratio curves of the workloads [32], while disk bandwidth sharing is uncontrolled. The MRC algorithm determines that the best cache setting is to allocate the bulk of the storage cache (992 MB) to Workload-A and provide a minimum to Workload-B. Cache partitioning thus improves the performance of Workload-A significantly from 26.6ms to 19.9ms. Next, we iterate through all possible disk partitioning settings to find the best disk bandwidth partitioning between the workloads, and enforce it using quanta-based scheduling [27], while cache sharing is uncontrolled. By partitioning the disk bandwidth, the performance of Workload-A improves to 13.2ms. In addition, Workload-B improves to 169.7ms. While properly partitioning the resource at each level independently, as described above, alleviates the interference, neither partitioning results in the optimal configuration for these two workloads.
On the other hand, an exhaustive search of both the cache and bandwidth settings yields an ideal setting where the storage access latency is 9.64ms for Workload-A and 171.3ms for Workload-B. In our simple case, the allocation solution found by the exhaustive search algorithm is just a combination of the solutions found by the two independent partitioners, for cache and disk. However, as we will show, due to the interdependence between resources, this is not the case when more resources are considered. Finally, iterating through all possible configurations and taking experimental samples for the exhaustive search is clearly infeasible for non-trivial combinations of resources and workloads.
These experiments and observations thus motivate us to design and implement a coordinated multi-resource partitioning algorithm based on an approximate system and application model, which we introduce next.
In this section, we describe our approach to providing effective resource partitioning for database servers running on virtual storage. Our main objective is to meet an overall performance goal, e.g., minimize the overall latency, when running a set of database applications on a shared storage server. In order to achieve this, we use the following:
In the following, we first introduce the problem statement, and an overview of our approach. Then, we introduce our performance model, and its sampling-based fine-tuning in detail.
We study dynamic resource allocation to multiple applications in dynamic content servers with shared storage. In the most general case, let’s assume that the system contains m resources and is hosting n applications. Our goal is to find the optimal configuration for partitioning the m resources among the n applications. Let’s denote with r1,r2, …, rn the data access times of the n applications hosted by the service provider. For the purposes of this paper, we assume that the goal of the service provider is to minimize the sum of all data access latencies for all applications, i.e. U = min ∑i=1nri.
However, our approach does not depend on the particular goal we set. For example, alternatively, we can optimize the provider’s revenue expressed as a utility function based on the application latencies. Whichever goal we set, we assume that our algorithm is aware of that goal, and can monitor application performance in order to compute the total benefit obtained for all applications, in any resource quota configuration.
Finding a practical solution to this problem is difficult, because the optimal resource allocation depends on many factors, including the (dynamic) access patterns of the applications, and how the inner mechanisms of each system component e.g., cache replacement policies, affect inter-dependencies between system resources.
Our technique determines per-application resource quotas in the database and storage caches, on the fly, in a transparent manner, with minimal changes to the DBMS, and no changes to existing interfaces between components. Towards this objective, we use an online performance estimation algorithm to dynamically determine the mapping between any given resource configuration setting and the corresponding application latency. While designing and implementing a performance model for guiding the resource partitioning search is non-trivial, our key insight is to design a model with sufficient expressiveness to incorporate i) tracking of dynamic access patterns, and ii) sufficiently generic assumptions about the inner mechanisms of the system components and the system as a whole.
For this purpose we collect a trace of I/O accesses at the DBMS buffer pool level and we use periodic sampling of the average disk latency for each application in a baseline configuration, where the application is given all the disk bandwidth. We feed the access trace and baseline disk latency for each application into a performance model, which computes the latency estimates for that application for all possible resource configurations. We thus obtain a set of resource-to-performance mapping functions, i.e., performance models, one for each application. Next, we enhance the accuracy of each performance model through experimental sampling. We use statistical regression to re-approximate the performance model by interpolating between the precomputed and experimentally gathered sample points.
We then use the corresponding per-application performance models to determine the near-optimal allocation of resources to applications according to our overall goal. Specifically, we leverage the derived performance model of each application, and use hill climbing [21] to converge towards a partitioning setting that minimizes the combined application latencies. In the following subsection, we describe our model that estimates the performance of an application using multi-level caches and a shared disk.
We use two key insights about the inner workings of the system, as explained next, to derive a close performance approximation, while at the same time reducing the complexity of the model as much as possible.
Key Assumptions and Ideas: The key assumptions we use about the system are i) that the cache replacement policy used in the cache hierarchy is known to be either the standard, uncoordinated LRU, or the coordinated Demote [31] policy and ii) that the server is a closed-loop system i.e., it is interactive and the number of users is constant during periods of stable load. Both of these assumptions match our target system well, leading to a performance model with sufficient accuracy to find a near-optimal solution, as we will show in Section 6. With the assumptions above, our key idea is to replace the search space of a cache hierarchy with the simpler search space of a single level of cache, in order to obtain a close performance estimation, at higher speed, as described next.
We approximate the cache hierarchy with the model of a single-level cache, and we specialize this model for two most commonly deployed, or proposed cache replacement policies, i.e., uncoordinated LRU and coordinated Demote [31]. We also derive a simplified disk model. Based on our models, assuming that the application is given quotas i.e., fractions ρc, ρs and ρd of the buffer pool cache, storage cache and disk bandwidth, respectively, we estimate the overall data access latency for the respective quotas through a combination of selective on-line measurements and computation.
In the following, we first introduce an approximation of the cache miss ratio of a two-level cache hierarchy, M(ρc,ρs), as a function of the cache quotas ρc and ρs, for the two types of replacement policies we consider. Then we introduce our disk model that computes the disk latency as a function of the disk quota, Ld(ρd). Finally, we describe our overall data access latency model.
Modeling the Cache Hierarchy: In a cache hierarchy using the standard (uncoordinated) LRU replacement policy at all levels, any cache miss from cache level qi will result in bringing the needed block into all lower levels of the cache hierarchy, before providing the requested block to cache i. It follows that the block is redundantly cached at all cache levels, which is called the inclusiveness property [31]. Therefore, if an application is given a certain cache quota qi at a level of cache i, any cache quotas qj given at any lower level of cache j, with qj < qi will be mostly wasteful.
In contrast, in a cache hierarchy using coordinated Demote [31] cache replacement, when a block is fetched from disk, it is not kept in any lower cache levels. The lower cache levels cache blocks only when the block is evicted from a higher cache level. Therefore, the application benefits from the combined quotas at all levels due to cache exclusiveness. Based on these observations, we make the following simplifications to approximate the overall miss ratio of a two-level cache, i.e., M(ρc,ρs), based on a single-level cache model.
In an uncoordinated LRU cache hierarchy, only the maximum size quota
given at any level of cache matters; therefore, we approximate the miss ratio
of a two level cache, consisting of a buffer pool (with quota
ρc) and a storage cache (with quota ρs) by the
following formula:
|
In a coordinated Demote cache hierarchy,
the combined cache quotas given to the application at all levels of cache
has the same effect on the overall miss ratio as giving the total quota in
a single level of cache.
Therefore, for Demote cache replacement,
we use the following formula to approximate the miss ratio
of a two-level cache:
|
Modeling the Disk Latency: For modeling the disk latency, we observe that the typical server system is an interactive, closed-loop system. This means that, even if incoming load may vary over time, at any given point in time, the rate of serviced requests is roughly equal to the incoming request rate. According to the interactive response time law [10]:
| Ld = |
| − z (3) |
where Ld is the response time of the storage server, including both I/O request scheduling and the disk access latency, N is the number of application threads, X is the throughput, and z is the think time of each application thread issuing requests to the disk.
We then use this formula to derive the average disk access latency for each application, when given a certain quota of the disk bandwidth. We assume that think time per thread is negligible compared to request processing time, i.e., we assume that I/O requests are arriving relatively frequently, and disk access time is significant. If this is not the case, the I/O component of a workload is likely not going to impact overall application performance. However, if necessary, more precision can be easily afforded e.g., by a context tracking approach, which allows the storage server to distinguish requests from different application threads [25], hence infer the average think time.
We further observe that the throughput of an application varies proportionally to the fraction of disk bandwidth that the application is given. Since disk saturation is unlikely in interactive environments with a limited number of I/O threads, this is very intuitive, but also verified through extensive validation experiments using a quanta-based scheduler and a variety of workloads.
Through a simple derivation, we arrive at the following formula:
| Ld(ρd) = |
| (4) |
where Ld(1) is the baseline disk latency for an application, when the entire disk bandwidth is allocated to that application. This formula is intuitive. For example, if the entire disk was given to the application, i.e., ρd = 1, then the storage access latency is equal to the underlying disk access latency. On the other hand, if the application is given a small fraction of the disk bandwidth, i.e, ρd ≈ 0, then the storage access latency is very high (approaches ∞).
Finally, the total cache quota allocated to an application influences the arrival rate of I/O requests at the disk, hence the baseline disk latency for that application. For example, a larger cache quota may result in a smaller disk queue, which in its turn limits opportunities for scheduling optimizations to minimize disk seeks. Hence, in the absence of disk bandwidth saturation, a larger cache quota may result in a higher baseline disk latency for the corresponding application.
Therefore, to compute the baseline disk latency for an application given a particular cache configuration, we use linear interpolation based on experimental measurements, taken for a few cache settings, instead of a single measurement.
Computing the Overall Performance Model: Assuming that the hit access latency in the buffer pool is negligible, the overall latency is determined by the accesses that miss in the buffer pool and either i) hit in the storage cache or ii) miss in the storage cache, hence access the disk.
Assuming that the access latency for a hit/miss in the storage cache is approximately the network/disk latency, i.e., Lnet/Ld, respectively, then the average application latency is:
|
where the miss (and hit) ratio at the storage cache, i.e., Ms(ρc,ρs), is a function of both the quota at the first level cache (ρc), and the quota at the second level cache (ρs), while the miss ratio of the buffer pool, Mc(ρc), is only a function of ρc. We can further approximate the fraction of accesses that miss in both levels of cache, hence reach the disk, i.e., Mc(ρc)Ms(ρc,ρs) from the formula above, with the fraction of disk accesses given by the miss ratio of our previously introduced single-level cache model as:
|
By using the previously derived models for M(ρc,ρs) e.g., in the case of uncoordinated LRU (Equation 1), we obtain:
|
Therefore, we can approximate the miss ratio in the storage cache, Ms(ρc,ρs), in terms of the miss ratio of a single-level cache model. By replacing the respective miss/hit ratio of the storage cache in Equation 5, we derive the application latency based on our single-level cache performance model for either type of cache replacement policy.
Finally, in order to derive a complete resource-to-performance model, we perform access trace collection and compute the miss ratio curve (MRC) only at the buffer pool level. Then, we vary the quota allocations for the two caches and the disk bandwidth for the application, to all possible combinations in the model. For each quota setting, we then compute the corresponding application latencies based on the precomputed buffer pool MRC by Equation 5.
Model Adjustment to Dynamic Changes: The model needs periodic recalibration, in order to account for load variations. Recalibration involves taking new samples of the disk latency for each application in a few cache configurations, to recompute the baseline disk latency. A new application trace needs to be collected and the new MRC recomputed only if the application pattern changes. If a new application is co-scheduled on the same infrastructure, we need to sample and compute the performance model only for the new application.
In our simple performance model we ignore the effects of locking for concurrency control, dirty block flushes for the cache model, and imperfect I/O isolation at small disk quanta for the disk model.
Specifically, whenever a dirty block evicted from the buffer pool is flushed to disk, the write access goes through all lower levels of cache on its way out. Hence, the evicted block remains cached in the storage cache, violating our assumption of redundancy for uncoordinated LRU caches, hence impacting cache miss ratio predictions.
Moreover, for low disk quanta, the disk scheduler incurs frequent and potentially large disk seeks between the data locations of different applications on disk. Thereby, our disk latency prediction, as well as the underlying I/O bandwidth isolation mechanism itself would be inaccurate in this case. In particular, the disk quanta cannot be less than the maximum duration of a disk read/write, which is that of a block size of 16KB in our case (for MySQL).
In order to fine-tune our performance model at run time, hence adaptively correct any inaccuracies, we use more expensive sampling-based approaches to correct the model at runtime. We collect experimental samples of application latency in various resource partitioning configurations, and use statistical regression i.e., support vector machine regression (SVR) [8], to re-approximate the resource-to-performance mapping function without sampling the search space exhaustively. SVR allows us to estimate the performance for configuration settings we haven’t actuated, through interpolation between a given set of sample points.
We iteratively collect a set of k randomly selected sample points. Each sample represents the average application latency measured in a given configuration. We replace the respective points in our performance model with the new set of experimentally collected samples. Using all sample points, consisting of both computed and experimentally collected samples, we retrain the regression model. We also cross-validate the model by training the regression model on a sub-set of all samples and comparing with the regression function obtained using the remaining samples. If during cross-validation, we determine that the regression-based performance model is stable [8], then we conclude that we do not need to collect any more samples, and we have achieved a highly accurate performance model for the respective application. Otherwise, we iterate through the above process until convergence is achieved.
Based on the per-application performance models derived as above, we find the resource partitioning setting which gives the optimum i.e., lowest combined latency in our case, by using hill climbing with random-restarts [21]. The hill climbing algorithm is an iterative search algorithm that moves towards the direction of increasing combined utility value for all valid configurations at each iteration. To avoid reaching a local optimum, we conduct several searches from several points chosen randomly until each search reaches an optimum. We use the best result obtained from all searches.
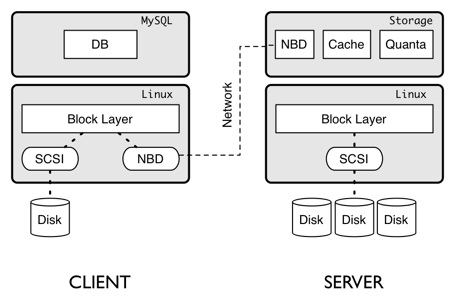
Our infrastructure (Akash1) consists of a virtual storage system prototype designed to run on commodity hardware. It supports data accesses to multiple virtual volumes for any storage client, such as, database servers and file systems. It uses the Network Block Device (NBD) driver packaged with Linux to read and write logical blocks from the virtual storage system, as shown in Figure 3. NBD is a standard storage access protocol similar to iSCSI, supported by Linux. It provides a method to communicate with a storage server over the network. The client machine (shown in left) mounts the virtual volume as a NBD device (e.g., /dev/nbd1) which is used by MySQL as a raw disk partition, (e.g., /dev/raw/raw1). We modified existing client and server NBD protocol processing modules for the storage client and server, respectively, in order to interpose our storage cache and disk controller modules on the I/O communication path, as shown in the figure.
In addition, we provide interfaces for creating/destroying new virtual volumes and setting resource quanta per virtual volume. Our infrastructure supports a resource controller in charge of partitioning multiple levels of storage cache hierarchy and the storage bandwidth. The controller determines per-application resource quotas on the fly, based on our performance model introduced in Section 3, in a transparent manner, with minimal changes to the DBMS i.e., to collect access traces at the level of the buffer pool and to monitor performance. In addition, we modify the MySQL/InnoDB buffer pool to support dynamic partitioning and resizing of its buffer pool, since it does not currently provide these features.
For each hosted application, and given configuration, in order to collect a sample point, we record the average and standard deviation of the data access latency, for the corresponding application in that configuration. For each sample point where we change the cache configuration, we wait for cache warm-up, until the application miss ratio is stable (which takes approximately 15 minutes on average in our experiments). Once the cache is stable, we monitor and record the application latency several times in order to reduce the noise in measurement. Once measured, sample points for an application can also be stored as an application surface on disk and later retrieved.
For the purpose of exhaustive sampling i.e., for comparing our model to measured optimum configurations (see Section 6.3.3), the controller iteratively sets the desired resource quotas and measures the application latency during each sampling period. We use the following rules of thumb in order to speed up the exhaustive sampling process:
Cost-aware Iteration: We sort resources in descending order of re-partitioning cost i.e., cache repartitioning has higher re-partitioning sampling cost compared to the disk due to the need to wait for cache warm-up in each new configuration. Therefore, we go through all cache partitioning possibilities as the outermost loop of our iterative exhaustive search; for each cache setting we go through all possible disk bandwidth settings in an inner loop, thus making fewer changes to stateful resources overall.
Order Reversal: The time to acquire a sample can be further reduced by iterating from larger cache quotas to smaller cache quotas i.e., from 1024MB to 32MB in a 1024MB cache. In this case, the cache warm-up of the largest cache quota will be amortized over the sampling for all cache quotas for the application.
In this section, we describe several resource partitioning algorithms we use in our evaluation. In addition, we describe the benchmarks and methodology we use.
We compare our GLOBAL+ resource partitioning scheme, where we combine performance estimation and experimental sampling, with the following resource partitioning schemes.
Our evaluation infrastructure consists of three machines: (1) a storage server running Akash to provide virtual disks, (2) a database server running MySQL, and (3) a load generator for the benchmarks.
We use three workloads: a simple micro-benchmark, called UNIFORM, and two industry-standard benchmarks, TPC-W and TPC-C. In our experiments, the benchmarks share both the database and storage server machines, using the (default) LRU replacement, and containing 1GB of memory each. Cache quotas are allocated in 64MB increments, with a minimum of 64MB. Disk quotas are allocated as 20ms disk quanta slices.
We run our Web based applications (TPC-W) on a dynamic content infrastructure consisting of the Apache web server, the PHP application server and the MySQL/InnoDB (version 5.0.24) database engine. We run the Apache Web server and MySQL on Dell PowerEdge SC1450 with dual Intel Xeon processors running at 3.0 Ghz with 2GB of memory. MySQL connects to the raw device hosted by the NBD server. We run the NBD server on a Dell PowerEdge PE1950 with 8 Intel Xeon processors running at 2.8 Ghz with 3GB of memory. To maximize I/O bandwidth, we use RAID 0 on 15 10K RPM 250GB hard disks.
We configure Akash to use 16KB block size to match the
MySQL/InnoDB block size. Each workload instance uses a different virtual volume:
a 32GB virtual disk for TPC-C, a 64GB virtual disk for TPC-W,
and a 64GB disk for UNIFORM. In addition, we use the
Linux O_DIRECT mode to bypass any OS-level buffer caching and
the noop I/O scheduler.
UNIFORM: We generate the UNIFORM workload by accessing data in an uniformly random order. The behavior is controlled by two parameters: the size of the data set (d) and the memory working set size (w). We run the workload with d=64GB and w=1GB.
TPC-W: The TPC-W benchmark from the Transaction Processing Council [1] is a transactional web benchmark designed for evaluating e-commerce systems. Several web interactions are used to simulate the activity of a retail store. The database size is determined by the number of items in the inventory and the size of the customer population. We use 100K items and 2.8 million customers which results in a database of about 4 GB. We use the shopping workload that consists of 20% writes. To fully stress our architecture, we run 10 TPC-W instances in parallel creating a database of 40 GB.
TPC-C: The TPC-C benchmark [20] simulates a wholesale parts supplier that operates using a number of warehouse and sales districts. Each warehouse has 10 sales districts and each district serves 3000 customers. The workload involves transactions from a number of terminal operators centered around an order entry environment. There are 5 main transactions for: (1) entering orders (New Order), (2) delivering orders (Delivery), (3) recording payments (Payment), (4) checking the status of the orders (Order Status), and (5) monitoring the level of stock at the warehouses (Stock Level). Of the 5 transactions, only Stock Level is read only, but constitutes only 4% of the workload mix. We scale TPC-C by using 128 warehouses, which gives a database footprint of 32GB.
We evaluate our approach using the TPC-C and TPC-W industry standard benchmarks. We also use the synthetic UNIFORM workload. We first characterize our workloads by preliminary experiments showing their computed MRC at the buffer pool level, then report and compare the average data access latency, measured at the first level cache, for each application, when using different resource partitioning schemes.
Figure 4 shows the miss ratio curves at the first level cache (buffer pool) for all applications. We can see that TPC-W and TPC-C are more cacheable than UNIFORM. UNIFORM has comparatively higher miss ratios, and it benefits greatly from larger cache allocations. On the other hand, TPC-W and TPC-C are less affected by cache allocations past 128MB.
We run either identical workload instances, or different workload instances, concurrently, on our infrastructure, and compare the performance of our partitioning algorithms. Figures 5-8 show the latency of each application after each partitioner produces a solution. We also show the respective partitioning solutions, and the time in which they were achieved by each resource partitioner (we include the time to collect a reliable access trace in the timing for our algorithms, although this is overlapped with normal application execution).
We notice the following overall trends in our results. Our GLOBAL+ partitioner arrives at the same partitioning solution as, and provides identical performance to IDEAL⋆, at a fraction of the cost. The performance of the GLOBAL partitioner, based only on the computational model, is relatively close to the ideal performance as well. GLOBAL registers significant improvements with experimental sampling only for workload combinations that include TPC-C, an application with a substantial fraction of writes. Moreover, with one exception, our GLOBAL partitioner is both faster and generates better partitioning settings than the combination of single resource controllers i.e., the MRC+DISK partitioner.
The single resource partitioning schemes, i.e., MRC and DISK, are limited in their ability to control performance. For example, DISK is ineffective for cache-bound workloads (see Figures 5, 6, 7). A more subtle point is that in some cases, the poor choices made by the MRC scheme can be corrected by providing more disk bandwidth to disadvantaged applications in the MRC+DISK scheme.
We discuss our performance results in detail next and we examine the accuracy of our model and its refinements in Section 6.3.
First, we look at cases where we run two instances of the same application. Figure 5 presents our results for the UNIFORM/UNIFORM configuration. The results for TPC-C/TPC-C and TPC-W/TPC-W are similar.
In these experiments, the miss ratio curves of the two applications are identical. Thus, the MRC/MRC+DISK/DISK schemes choose to partition the cache levels equally at both the client and storage caches. With this setting, due to cache inclusiveness, the second level cache, i.e., the storage cache, provides little benefit, resulting in poor performance for these partitioners. For the results shown in Figure 5, our GLOBAL scheme, finds a resource partitioning setting of 64MB/960MB and 960MB/64MB between the two instances of UNIFORM, at the buffer pool and storage caches respectively. This setting provides a much better cache usage scenario than equal partitioning of the two caches.
Overall, GLOBAL provides the same partitioning solution as IDEAL⋆ and obtains a factor of 2.4 speedup over MRC+DISK. For the experiments with two instances of TPC-W and TPC-C, GLOBAL obtains a factor of 1.05 and 1.5 speedup, respectively, over MRC+DISK.
[Latency]
[Allocation]
Scheme B.Pool S.Cache Quanta Time TPC-W UNIF W U W U (mins) GLOBAL 64 960 896 128 40 60 16 GLOBAL+ 64 960 896 128 40 60 59 MRC 128 896 384 640 50 50 32 DISK 512 512 512 512 40 60 5 MRC+DISK 128 896 384 640 40 60 37 IDEAL⋆ 64 960 896 128 40 60 3660
[Latency]
[Allocation]
Scheme B.Pool S.Cache Quanta Time TPC-C UNIF C U C U (mins) GLOBAL 64 960 896 128 40 60 16 GLOBAL+ 64 960 512 512 40 60 760 MRC 128 896 512 512 50 50 32 DISK 512 512 512 512 40 60 5 MRC+DISK 128 896 512 512 40 60 37 IDEAL⋆ 64 960 512 512 40 60 3660
[Latency]
[Allocation]
Scheme B.Pool S.Cache Quanta Time TPC-W TPC-C W C W C (mins) GLOBAL 192 960 896 128 60 40 16 GLOBAL+ 256 768 768 256 60 40 760 MRC 384 640 384 640 50 50 32 DISK 512 512 512 512 50 50 5 MRC+DISK 384 640 384 640 60 40 37 IDEAL⋆ 256 768 768 256 60 40 3660
Figures 6-8 present our results for different concurrent workloads. The results show that the allocations chosen by the GLOBAL partitioner are non-trivial, and good performance is obtained only when the settings of all resources are considered.
First, we examine the TPC-W/UNIFORM configuration, shown in Figure 6. The UNIFORM workload has both larger cache and disk requirements than TPC-W. Since the miss ratio curve of UNIFORM is steeper than that of TPC-W, once the first 128MB is allocated to TPC-W, the MRC partitioner allocates the rest of the buffer pool (896MB) to UNIFORM. However, UNIFORM is penalized by the 50/50 disk bandwidth partitioning in this case. On the other hand, the DISK partitioner selects a 60/40 disk bandwidth allocation in favor of UNIFORM. But, dividing the caches 50/50 results in poor performance for this partitioner. The MRC+DISK scheme corrects the disk quanta allocation of the MRC scheme. However, due to the underlying uncoordinated LRU replacement policy, it fails to obtain a synergistic configuration for the two caches. Therefore, GLOBAL performs a factor of 1.12 better than MRC+DISK, by obtaining a better cache configuration overall, in addition to allocating the disk bandwidth in favor of UNIFORM. GLOBAL performs a factor of 1.29 better than MRC, and a factor of 2.61 better than DISK.
Next, we look at the TPC-C/UNIFORM configuration, shown in Figure 7. The results are similar to the TPC-W/UNIFORM configuration, with one exception. The model for our GLOBAL partitioner mispredicts the cache behavior at the storage cache. The assumption about block redundancy between the buffer pool and storage cache does not hold for TPC-C, an application with a substantial fraction of writes. Hence, allocating more storage cache to TPC-C, as in the solutions of all other partitioners is beneficial, resulting in increased hit rates in this cache. The DISK and MRC partitioners under-perform for the same reason as before i.e., because allocating either cache or disk resources 50/50 penalizes UNIFORM. Hence, GLOBAL+ performs a factor of 1.14, and 2.29 better than MRC, and DISK, respectively, and similar to MRC+DISK.
Finally, we study the TPC-W/TPC-C configuration, shown in Figure 8. As the miss ratio curve for TPC-C is slightly steeper than TPC-W, the MRC partitioner allocates a larger fraction of the buffer pool (640MB) to TPC-C. Moreover, the miss ratio curves of the two applications are similar to each other at the storage cache level. Therefore, the same greedy MRC cache algorithm allocates a larger fraction of the storage cache (640MB) to TPC-C as well. This results in over-allocation of total cache space to TPC-C, severely penalizing TPC-W, when compared to the cache configuration, and performance achieved by IDEAL⋆ (and our GLOBAL+). Allocating a larger disk fraction to TPC-W in MRC+DISK compensates for the poor cache partitioning of MRC alone. The GLOBAL+ scheme allocates a larger proportion of the storage cache than GLOBAL to TPC-C, correcting the initial mis-prediction, while still balancing the allocation at the two caches for avoiding redundancy, hence providing overall better performance. As a result, GLOBAL+ is a factor of 2.89 better than MRC, a factor of 1.72 better than DISK, and a factor of 1.51 better than MRC+DISK.
In this section, we evaluate the accuracy of our cache and disk approximations in our performance model. In addition, we present results for online refinement of our model through experimental sampling.
Figure 9: Two-level Cache Approximation: Errors for cache configurations with TPC-W and TPC-C. Figure 6.3.1 shows the Measured and Predicted miss ratio curves for buffer pool sizes (64MB,256MB,512MB). Figures 6.3.1-6.3.1 show error heatmaps where light/dark colors represent low/high error, respectively. The magnitude of the error is shown in the legend on the right.
We evaluate the accuracy of the two-level cache miss ratio prediction. Figure 9 presents our results for TPC-W and TPC-C. We first provide a detailed analysis for TPC-W, for three buffer pool size (64MB, 256MB, 512MB) and a range of storage cache sizes, where we plot two cache miss ratio curves: experimentally measured (solid lines) and predicted by model (dashed lines). As we can see, the predicted and measured miss ratio curves are close together, hence, our cache approximation is accurate in calculating the miss ratio at the storage cache. The areas of inaccuracy, where the relative error is greater than 2%, occur when the storage cache is equal to the buffer pool size i.e., 512M. The replacement policy is affected by concurrency control i.e., through the fix/unfix of buffer blocks and some other thread optimizations to mitigate cache pollution for table scans, in this case.
We further present the error of our model as a more general heat-map, where low errors (0-20%) are shown in light colors, whereas higher errors are shown in darker colors, for a wide range of cache configurations, for both our benchmarks. For both benchmarks, the area of any significant inaccuracy is where the two cache sizes are equal, especially for large cache sizes. However, these very configurations are unlikely to be used as an allocation solution, because they correspond to a high level of redundancy for uncoordinated two-level LRU caches. Moreover, for high cache sizes, the miss ratio of most applications is low, hence the error is less relevant. The errors are higher for TPC-C due to its large fraction of writes, hence unpredictable hits in the storage cache for dirty blocks previously evicted from the buffer pool. For both benchmarks, the error falls below 2% when the storage cache is at least a factor of 2 larger than the buffer pool size.
We evaluate the accuracy of our disk latency approximation, when using a quanta-based scheduler (Equation 4). We plot both the predicted and the measured disk latency, for each application, by varying the storage bandwidth quanta. Figure 6.3.2 and Figure 6.3.2 present our results for TPC-C and TPC-W, respectively. In each graph, we plot and compare two lines: measured (solid lines) and predicted (dashed lines), for different cache sizes (given mostly at the buffer pool).
Overall, the predicted disk latency significantly deviates from the measured latency only for small quanta values. Moreover, slightly higher errors can be observed for higher cache sizes. In both of these cases, the explanation is the higher variability of the average disk latency over time when i) the underlying disk bandwidth isolation is less effective due to frequent switching between workloads and ii) disk scheduling optimizations are less effective and reliable due to fewer requests in the scheduler queue. Moreover, our model ignores the “think time” between successive requests for the same workload. On the other hand, we can see that our model successfully captures the latency deviations due to changes in the cache size for TPC-C.
As shown, our model is inaccurate in very localized areas of the total search space, where inaccuracies may not matter, or can be improved by experimental sampling. Figure 11 shows the accuracy improvement through online performance sampling. In the x-axis we show the number of samples added to our performance model experimentally, and on the y-axis we show the error between the predicted and the actual latencies. For both TPC-W and TPC-C, adding samples by online sampling significantly reduces the error rate from 72% to 16% for TPC-C and from 38% to 10% for TPC-W.
Previous related work has focused on dynamic allocation and/or controlling either memory allocation or disk bandwidth partitioning among competing workloads.
Dynamic Memory Partitioning: Dynamic memory allocation algorithms have been studied in the VMWare ESX server [28]. The algorithm estimates the working-set sizes of each VM and periodically adjusts each VM’s memory allocation such that performance goals are met. Adaptive cache management based on application patterns or query classes has been extensively studied in database systems. For example, the DBMIN algorithm [7] uses the knowledge of the various patterns of queries to allocate buffer pool memory efficiently. In addition, many cache replacement algorithms have been studied e.g., LRU-k [15], in the presence of concurrent workloads. LRU-k prevents useful buffer pages from being evicted due to sequential scans running concurrently. Brown et al. [3] study schemes to ensure per-class response time goals in a system executing queries of multiple classes by sizing the different memory regions. Finally, recently, IBM DB2 added the self-tuning memory manager (STMM) to size different memory regions [26].
Disk Bandwidth Partitioning: Dynamic allocation of the disk bandwidth has been studied to provide QoS at the storage server. Just like in our prototype, SLEDS [5], Façade [12], SFQ [11], and Argon [27] place a scheduling tier above the existing disk scheduler in order to control the I/Os issued to the underlying disk. However, these techniques assume that proportions are known e.g., set manually. However, more recent techniques, e.g., Cello [22], YFQ [4] and Fahrrad [19] build QoS-aware disk schedulers, which make low-level scheduling decisions that strive to minimize seek times as well as maintain quality of service.
Multi-resource Partitioning: Multi-resource partitioning is an emerging area of research where multiple resources are partitioned to provide isolation and QoS for several competing applications. Wachs et al. [27] show the benefit of considering both cache allocation and disk bandwidth allocation to improve the performance in shared storage servers. However, the resource allocation is done after modelling applications through extensive profiling. Chanda et al. [6] implement priority scheduling at the web and database server levels. Wang et al. [30] extend the SFQ [11] algorithm to several storage servers. Padala et al. [17] study methods to allocate memory and CPU to several virtual machines located within the same physical server. However, these papers focus on either i) dynamic partitioning and/or quota enforcement of a single resource on multiple machines [6, 30] or ii) allocation of multiple resources within a single machine [17, 27]. In our study, we have shown that global resource partitioning of multiple resources located at different tiers results in significant performance gains.
Resource allocation to applications on the fly is increasingly desirable in shared data centers with server consolidation. While many techniques for enforcing a known allocation exist, dynamically finding the appropriate per-resource application quotas has received less attention. The challenge is the exponential growth of the search space for the optimal solution with the number of applications and resources. Hence, exhaustively evaluating application performance for all possible configurations experimentally is infeasible.
Our contribution is an effective multi-resource allocation technique based on a unified resource-to-performance model incorporating i) pre-existing generic knowledge about the system and inter-dependencies between system resources e.g., due to cache replacement policies and ii) application access tracking and baseline system metrics captured on-line.
We show through experiments using several standard e-commerce benchmarks and synthetic workloads that our performance model is sufficiently accurate in order to converge towards a near-optimal global partitioning solution within minutes. At the same time, our performance model effectively optimizes high-level performance goals, providing up to factors of 2.9 and 2.4 improvement compared to state-of-the-art single-resource controllers, and their ad-hoc combination, respectively.
We are grateful to our shepherd, David Black, and the anonymous reviewers for their valuable and detailed feedback on our paper. We also thank the systems group at University of Toronto for their excellent suggestions and comments. Finally, we acknowledge the generous support of our sponsors: Natural Sciences and Engineering Research Council (NSERC), Ontario Centers of Excellence (OCE), Ontario Ministry of Research and Innovation, IBM Center of Advanced Studies, IBM Research, Intel and Bell Canada. Gokul Soundararajan is supported by an NSERC Canada Graduate Scholarship.
This document was translated from LATEX by HEVEA.