We now
present an end-to-end test where multiple VMs run a mix of realistic
workloads with different shares. We use
Filebench [20], a well-known IO modeling tool,
to generate an OLTP workload similar to TPC-C.
We employ
four VMs
running Filebench, and two generating 16 KB random reads.
A pair of Filebench VMs are placed on each of two hosts, whereas the
micro-benchmark VMs occupy one host each. This is exactly the same
experiment discussed in Section 2; data for the uncontrolled
baseline case is presented in Table 1. Recall that
without PARDA, hosts 1 and 2 obtain similar throughput even though the
overall sum of their VM shares is different.
Table 6 provides setup details and reports
data using PARDA control. Results
for the OLTP VMs are presented as Filebench operations per second (Ops/s).
|
We run PARDA (![]() = 25 ms) with host weights (
= 25 ms) with host weights (![]() )
set according to shares of their VMs
(
)
set according to shares of their VMs
(
![]() for hosts 1 to 4). The maximum window size
for hosts 1 to 4). The maximum window size ![]() is
64 for all hosts. The OLTP VMs on host 1 receive 1266 and 591 Ops/s, matching their
is
64 for all hosts. The OLTP VMs on host 1 receive 1266 and 591 Ops/s, matching their ![]() share ratio. Similarly, OLTP VMs on host 2 obtain 681 and 673 Ops/s,
close to their
share ratio. Similarly, OLTP VMs on host 2 obtain 681 and 673 Ops/s,
close to their ![]() share ratio.
Note that the overall Ops/s for hosts 1 and 2 have a
share ratio.
Note that the overall Ops/s for hosts 1 and 2 have a ![]() ratio, which
is not possible in an uncontrolled scenario.
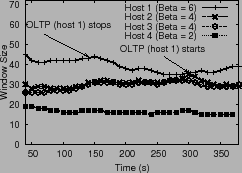
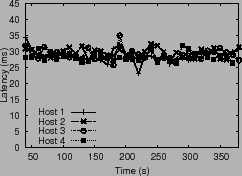
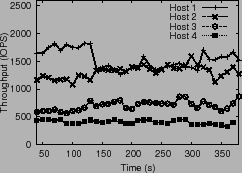
Figure 12 plots the window size, latency and throughput
observed by the hosts. We note two key properties: (1) window
sizes are in proportion to the overall
ratio, which
is not possible in an uncontrolled scenario.
Figure 12 plots the window size, latency and throughput
observed by the hosts. We note two key properties: (1) window
sizes are in proportion to the overall ![]() values and (2) each
VM receives throughput in proportion to its shares.
This shows that PARDA provides
the strong property of enforcing VM shares,
independent of their placement on hosts.
The local SFQ scheduler divides host-level capacity across VMs in a
fair manner, and together with PARDA, is able to
provide effective end-to-end isolation among VMs. We also modified one
VM workload during the experiment to test our burst-handling mechanism,
which we discuss in the next section.
values and (2) each
VM receives throughput in proportion to its shares.
This shows that PARDA provides
the strong property of enforcing VM shares,
independent of their placement on hosts.
The local SFQ scheduler divides host-level capacity across VMs in a
fair manner, and together with PARDA, is able to
provide effective end-to-end isolation among VMs. We also modified one
VM workload during the experiment to test our burst-handling mechanism,
which we discuss in the next section.
Ajay Gulati 2009-01-14