|
To test PARDA and its robustness with mixed workloads, we ran very different workload patterns at the same time from our six hosts. Table 5 presents the uncontrolled case.
Next, we enable PARDA with ![]() = 40 ms, and assign
shares in a
= 40 ms, and assign
shares in a
![]() ratio for hosts 1 through 6 respectively,
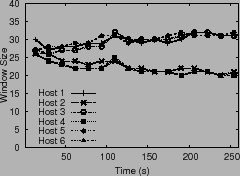
plotted in Figure 10.
Window sizes are differentiated between hosts with different shares.
Hosts with more shares reach a
window size of 32 (the upper bound,
ratio for hosts 1 through 6 respectively,
plotted in Figure 10.
Window sizes are differentiated between hosts with different shares.
Hosts with more shares reach a
window size of 32 (the upper bound, ![]() ) and remain there. Other
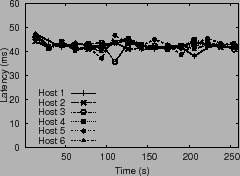
hosts have window sizes close to 19. The average latency
observed by the hosts remains close to
) and remain there. Other
hosts have window sizes close to 19. The average latency
observed by the hosts remains close to ![]() , as shown in
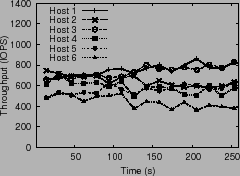
Figure 10(b). The throughput observed by
hosts
follows roughly the same pattern as window sizes, but is not always
proportional because of array scheduling and block placement
issues.
We saw similar adaptation in window sizes and latency when we repeated
this experiment using
, as shown in
Figure 10(b). The throughput observed by
hosts
follows roughly the same pattern as window sizes, but is not always
proportional because of array scheduling and block placement
issues.
We saw similar adaptation in window sizes and latency when we repeated
this experiment using ![]() = 30 ms (plots omitted due to space
constraints).
= 30 ms (plots omitted due to space
constraints).