We first consider a single host running one VM executing different workloads, to examine the variation in average latency measured at the host. A Windows Server 2003 VM running Iometer [1] is used to generate each workload, configured to keep 8 IOs pending at all times.
We varied three workload parameters: reads - 0 to 100%, IO size - 4, 32, 64, and 128 KB, and sequentiality - 0 to 100%. For each combination, we measured throughput, bandwidth, and the average, min and max latencies.
Over all settings, the minimum latency was observed for the workload consisting of 100% sequential 4 KB reads, while the maximum occurred for 100% random 128 KB writes. Bandwidth varied from 8 MB/s to 177 MB/s. These results show that bandwidth and latency can vary by more than a factor of 20 due solely to workload variation.
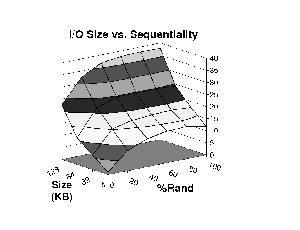
Figure 5 plots the average latency (in ms) measured for a VM while varying IO size and degree of sequentiality. Due to space limitations, plots for other parameters have been omitted; additional results and details are available in [11].
There are two main observations: (1) the absolute latency value is not very high for any configuration, and (2) latency usually increases with IO size, but the slope is small because transfer time is usually dominated by seek and rotational delays. This suggests that array overload can be detected by using a fairly high latency threshold value.
Ajay Gulati 2009-01-14