Weihang Jiang, Chongfeng Hu, Yuanyuan Zhou, and Arkady Kanevsky

This paper analyzes the failure characteristics of storage subsystems. More specifically, we analyzed the storage logs collected from about 39,000 storage systems commercially deployed at various customer sites. The data set covers a period of 44 months and includes about 1,800,000 disks hosted in about 155,000 storage shelf enclosures. Our study reveals many interesting findings, providing useful guideline for designing reliable storage systems. Some of our major findings include: (1) In addition to disk failures that contribute to 20-55% of storage subsystem failures, other components such as physical interconnects and protocol stacks also account for significant percentages of storage subsystem failures. (2) Each individual storage subsystem failure type and storage subsystem failure as a whole exhibit strong self-correlations. In addition, these failures exhibit ``bursty'' patterns. (3) Storage subsystems configured with redundant interconnects experience 30-40% lower failure rates than those with a single interconnect. (4) Spanning disks of a RAID group across multiple shelves provides a more resilient solution for storage subsystems than within a single shelf.
Reliability is a critically important issue for storage systems
because storage failures can not only cause service downtime,
but also lead to data loss. Building reliable storage systems becomes
increasingly challenging as the complexity of modern storage systems
grows into an unprecedented level. For example,
the EMCTM Symmetrix DMX-4 can be
configured with up to 2400 disks [8],
the GoogleTM File System cluster is composed of 1000 storage
nodes [9], and
the NetApp![]() FAS6000 series can support more than 1000
disks per node, with up to 24 nodes in a system [12].
FAS6000 series can support more than 1000
disks per node, with up to 24 nodes in a system [12].
To make things even worse, disks are not the only component in storage systems. To connect and access disks, modern storage systems also contain many other components, including shelf enclosures, cables and host adapters, and complex software protocol stacks. Failures in these components can lead to downtime and/or data loss of the storage system. Hence, in complex storage systems, component failures are very common and critical to storage system reliability.
To design and build a reliable storage system, it is crucially important to understand the storage failure characteristics. First, accurate estimation of storage failure rate can help system designers decide how many resources should be used to tolerate failures and to meet certain service-level agreement (SLA) metrics (e.g., data availability). Second, knowledge about factors that greatly impact the storage system reliability can guide designers to select more reliable components or build redundancy into unreliable components. Third, understanding the statistical properties such as failure distribution over time of modern storage systems is necessary to build right testbed and fault injection models to evaluate existing resiliency mechanisms and to develop better fault-tolerant mechanisms.
While several recent studies have been conducted on understanding storage failures, almost all of them focused on the failure characteristics of one storage component--disks. For example, disk vendors have studied the disk failure characteristics through running accelerated life tests and collecting statistics from their return unit databases [4,21]. Based on such tests, they calculate the mean-time-to-failure (MTTF) and record it in a disk specification. For most of the disks, the specified MTTF is typically more than one million hours, equivalent to a lower than 1% annualized failure rate (AFR). But such low AFR is usually not what has been experienced by users. Motivated from this observation, recently some researchers have studied disk failures from a user's perspective by analyzing disk replacement logs collected in the field [14,16]. Interestingly, they found disks are replaced much more frequently (2-4 times) than vendor-specified AFRs. But as this study indicates, there are other storage subsystem failures besides disk failures that are treated as disk faults and lead to unnecessary disk replacements. Additionally, some researchers analyzed the characteristics of disk sector errors, which can potentially lead to complete disk failures [2], and they found that sector errors exhibit strong temporal locality (i.e., bursty patterns).
While previous works provide very good understanding of disk failures and an inspiring starting point, it is not enough since, besides disks, there are many other components that may contribute to storage failures. Without a good understanding of these components' failure rates, failure distributions, and other characteristics, as well as impacts of these component failures on the storage system, it can make our estimation of the storage failure rate/distribution inaccurate. For example, as we will show in our study from real-world field data, having a lower disk failure rate does not necessarily mean that the corresponding storage system is more reliable--because some other components may not be as reliable.
More importantly, if we only focus on disk failures and ignore other component failures, we may fail to build a highly reliable storage system. For example, RAID is usually the only resiliency mechanism built in to most modern storage systems (various forms of checksumming are considered as part of RAID). As RAID is mainly designed to tolerate disk failures, it is insufficient to handle other component failures such as failures in shelf enclosures, interconnects, and software protocol layers.
While we are interested in failures of a whole storage system, this study is concentrated on the core part of it -- the storage subsystem, which contains disks and all components providing connectivity and usage of disks to the entire storage system.
We conducted a study using real-world field data from Network ApplianceTMAutoSupport Database, to answer the following questions:
Data from the same AutoSupport Database was first analyzed in [2] on latent sector errors and was further analyzed in [3] on data corruptions.
There are other redundancy and resiliency mechanisms in storage system layers higher than the storage subsystem and RAID-based resiliency mechanism studied in this paper. These mechanisms handle some of the storage subsystem failures. Studying impacts of these resiliency and redundancy mechanisms on storage failures, including storage subsystem failures, is part of the future work.
This paper analyzes the failure characteristics of storage subsystems, including disks and other system components, based on a significant amount of field data collected from customers. Specifically, we analyzed the storage logs collected from about 39,000 storage systems commercially deployed at various customer sites. The data set covers a period of 44 months and includes about 1,800,000 disks hosted in about 155,000 storage shelf enclosures. Furthermore, our data covers a wide range of storage system classes, including near-line (backup), low-end, mid-range, and high-end systems.
This paper studies failure characteristics from several angles. First, we classify storage subsystem failures into four failure types based on their symptoms and root causes and examine the relative frequency of each failure type. Second, we study the effect of several factors on storage subsystem reliability. These factors include disk models, shelf enclosure models, and network redundancy mechanisms. Finally, we analyze the statistical properties of storage subsystem failures, including the correlation between failures and their time distribution.
Our study reveals many interesting findings, providing useful guideline for designing reliable storage systems. Following is a summary of our major findings and the corresponding implications:
The rest of the paper is organized as follows. Section 2 provides the background and describes our methodology. Section 3 presents the contribution of disk failures to storage subsystem failures and frequency of other types of storage subsystem failures. Section 4 quantitatively analyzes the effects of several factors on storage subsystem reliability, while Section 5 analyzes the statistical properties of storage subsystem failures. Section 6 discusses the related work, and Section 7 concludes the paper and provides directions for future work.
In this section, we detail the typical architecture of storage systems, the definition and terminology used in this paper, and the source of the data studied in this paper.
Figure 1 shows the typical architecture of a modern storage system.
From the customers' perspective, a storage system is a virtual device that is attached to customers' systems and provides customers with the desired storage capacity with high reliability, good performance, and flexible management.
Looking from inside, a storage system is composed of storage subsystems, resiliency mechanisms, storage head/controller, and other higher-level system layers. The storage subsystem is the core part of a storage system and provides connectivity and usage of disks to the entire storage system. It contains various components, including disks, shelf enclosures, cables and host adapters, and complex software protocol stacks. Shelf enclosures provide power supply, cooling service and prewired backplane for the disks mounted in them. Cables initiated from host adapters connect one or multiple shelf enclosures to the network. Each shelf enclosure can be optionally connected to a secondary network for redundancy. In Section 4.3 we will show the impact of this redundancy mechanism on failures of the storage subsystem.
Usually, on top of the storage subsystem, resiliency mechanisms, such as RAID, are used to tolerate failures in storage subsystems.
We use the followings terms in this paper.
Figure 2 shows the steps and components that are involved in fulfilling an I/O request in a storage subsystem. As shown in Figure 2, for the storage layer to fulfill an I/O request, the I/O request will first be processed and transformed by protocols and then delivered to disks through networks initiated by host adapters. Storage subsystem failures are the failures that break the I/O request path, and can be caused by hardware failures, software bugs, and protocol incompatibilities along the path.
To better understand storage subsystem failures, we partition them into four categories along the I/O request path:
The occurrences of these four types of failures are recorded in logs collected by Network Appliance.
Table 1 provides an overview of the data used in this study. Support logs from about 39,000 commercially deployed storage systems in four system classes are used for the results presented in this paper. There are totally about 1,800,000 disks mounted in 155,000 shelf enclosures. The disks are a combination of SATA and FC disks. The population of disks contains at least 9 disk families and 15 disk models. The storage logs used for this study were collected between January 2004 and August 2007.
Below we describe each storage system class.
Near-line systems are deployed as cost-efficient archival or backup storage systems. Less expensive SATA disks are used in nearline systems. In nearline systems, one storage subsystem on average contains about 7 shelf enclosures and 98 disks. Both RAID4 and RAID6 are supported as resiliency mechanisms in nearline systems.
Primary storage systems, including low, mid, and high-end systems, are mainly used in mission- or business-critical environments and primarily use FC disks. Low-end storage systems have embedded storage heads with shelf enclosures, but external shelf enclosures can be added. Mid-range and high-end systems use external shelves and are usually configured with more shelf enclosures and disks than low-end systems. Each mid-range system has about 7 shelf enclosures and 80 disks (not every shelf is fully utilized and configured with 14 disks), and high-end systems are in similar scale. Going from low to high-end systems, more reliable components and more redundancy mechanisms are used. For example, both mid-range and high-end systems support dual paths for redundant connectivity.
The storage systems studied in this paper have a low-overhead logging mechanism that automatically records informational and error events on each layer (software and hardware) and each subsystem during operation. Several recent works such as [2,3] also studied the same set of storage logs from different aspects.
Figure 3 shows a log example that reports a physical interconnect failure. As can be seen in the figure, when a failure happens, multiple events are generated as the failure propagates from lower layers to higher layers (Fibre Channel to SCSI to RAID). By keeping track of events generated by lower layers, higher layers can identify the cause of events and tag the events with corresponding failure types. In this example, the RAID layer, which is right above the storage subsystem, generates a disk missing event, indicating a physical interconnect failure. In this paper, we look at four types of events generated by the RAID layer, corresponding to four categories of storage subsystem failures.
Besides the events shown in the example, there are many other events recorded in the logs. For example, standard error reports from the SCSI protocol layer tell us what failure mechanisms happen inside disks [18]. Disk medium error messages from disk drivers provide information about broken sectors [2]. Similarly, messages from FC protocol and FC host adapter drivers report errors that occur in FC networks and FC adapters.
It is important to notice that not all failures propagate to the RAID layer, as some failures are recovered or tolerated by storage subsystems. For example, an interconnect failure can be recovered through retries at SCSI layer or be tolerated through multipathing. Therefore, storage failures characterized as storage subsystem failure as a whole are those errors exposed by storage subsystems to the rest of the system.
As Figure 3 shows, each event is tagged with the time-stamps when the failure is detected and with the ID of the disk affected by the failure. Since all the storage systems studied in this paper periodically send data verification requests to all disks as a proactive method to detect failures, the lag between the occurrence and the detection of the failure is usually shorter than an hour.
System information is also copied with snapshots and recorded in storage logs on a weekly basis. This information is particularly important for understanding storage subsystem reliability since it provides the insight into the system parameters of storage subsystems. More specifically, storage logs contain the information about hardware components used in storage subsystems, such as disk models and shelf enclosure models, and they also contain the information about the layout of disks, such as which disks are mounted in the same shelf enclosures, and which disks are in the same RAID group. This information is used for analyzing statistical properties of storage subsystem failures in Section 5.
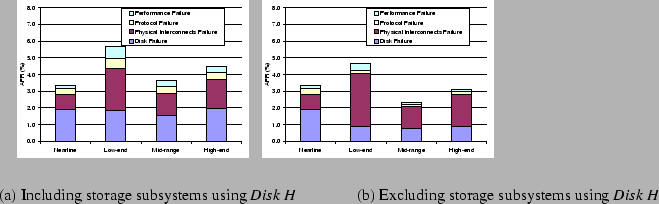 |
As we categorize storage subsystem failures into four failure types based on their root causes, a natural question is therefore what the relative frequency of each failure type is. To answer this question, we study the storage logs collected from 39,000 storage systems.
Figure 4(a) presents the breakdown of AFR for storage subsystems based on failure types, for all four system classes studied in this paper. Since one problematic disk family, denoted as Disk H, has already been reported in [2], for Figure 4(b) we exclude data from storage subsystems using Disk H, so that we can analyze the trend without being skewed by one problematic disk family. The discussion on Disk H is presented in Section 4.1.
![\begin{boxedminipage}[t]{3.3in}
{\bf Finding (1): }
In addition to {\it disk fa...
...ures}.
Resilient mechanisms should target all failure types.
\end{boxedminipage}](img9.png)
As Figure 4(b) shows, across all system classes, disk failures do not always dominate storage subsystem failures. For example, in low-end storage systems, the AFR for storage subsystems is about 4.6%, while the AFR for disks is only 0.9%, about 20% of overall AFR. On the other hand, physical interconnect failures account for a significant fraction of storage subsystem failures, ranging from 27% to 68%. The other two failure types, protocol failures and performance failures, contribute to 5-10% and 4-8% of storage subsystem failures, respectively.
![\begin{boxedminipage}[t]{3.3in}
{\bf Finding (2): }
For {\it disks}, near-line ...
...ate is not indicative of the storage subsystem failure rate.
\end{boxedminipage}](img10.png)
Figure 4(b) also shows that near-line systems, which mostly use SATA disks, experience about 1.9% AFR for disks, while for low-end, mid-range, and high-end systems, which mostly use FC disks, the AFR for disks is under 0.9%. This observation is consistent with the common belief that enterprise disks (FC) are more reliable than near-line disks (SATA).
However, the AFR for storage subsystems does not follow the same trend. Storage subsystem AFR of near-line systems is about 3.4%, lower than that of low-end systems (4.6%). This indicates that other factors, such as shelf enclosure model and network configurations, strongly affect storage subsystem reliability. The impacts of these factors are examined in the next section.
Another interesting observation that can be seen in Figure 4(b) is that for FC drives, the disk failure rate is consistently below 1%, as published by disk drive manufacturers, while some previous works claim that the AFR for disks is much higher [14,16]. We believe that the main reason for the discrepancy is that these studies look at disk failures from different angles. Our study is from a system's perspective, as we extract disk failure events from system logs, similar to disk drive manufacturers' studies. On the other hand [14,16], look at disk failures from a user's perspective. Since their studies are based on disk replacement logs, they cannot identify the reasons for disk replacement. As system administrators often replace disks when they observe unavailability of disks, the disk replacement rates reported in these studies are actually close to the storage subsystem failure rate of this paper.
As we have seen above, storage subsystems of different system classes show different AFRs. While these storage subsystems are architecturally similar, the characteristics of their components, like disks and shelves, and their redundancy mechanisms, like multipathing, differ. We now explore the impact of these factors on storage subsystem failures.
The disk is the key component of a storage subsystem; therefore it is important to understand how disk models affect storage subsystem failures. To understand the impact of the disk model, we study data collected from near-line, low-end, mid-range, and high-end systems.
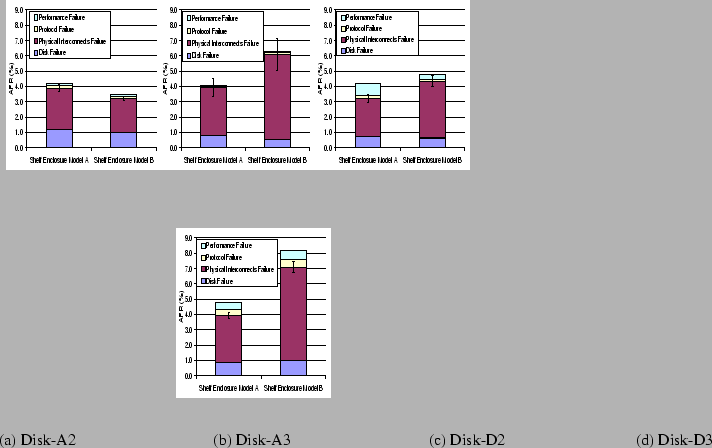
Figure 5 shows the AFRs for storage subsystems from 4 system classes configured with 3 shelf enclosure models, 6 combinations in total (not every shelf enclosure model works with all system classes). Since we find that the enclosure model also has a strong impact on storage subsystem failures, we group data based on system class, shelf enclosure model, and disk model so that we can separately study the effects of these factors. In this section, we mainly focus on disk model; shelf enclosure model will be discussed in Section 4.2.
There are a total of 20 disk models used in these systems, and each disk model is denoted as family-type, with the same convention as in [2]. For anonymization purpose, a single letter is used to represent a disk family (e.g., Seagate Cheetah 10k.7), and type is a single number indicating the disk's capacity. The relative capacity within a family is ordered by the number. For example, Disk A-2 is larger than A-1 and B-2 is larger than B-1.
![\begin{boxedminipage}[t]{3.3in}
{\bf Finding (3): }
Storage subsystems using di...
...ctor to consider for designing reliable storage subsystems.
\end{boxedminipage}](img12.png)
We can see from Figure 5 (a)-(f) that for most storage subsystems, AFR is about 2% - 4%. However, storage subsystems using Disk H-1 and Disk H-2 show 3.9%-8.3% AFR, higher than the average AFR by a factor of two.
We know that Disk H-1 and Disk H-2 are problematic. It is interesting to observe that not only disk failures but also protocol failures and performance failures are negatively affected by the problematic disks. The possible reason is that as disks experience failures, corner-case bugs in the protocol stacks are more likely to be triggered, leading to more occurrences of protocol failures. At the same time, some I/O requests cannot be served in time, causing more performance failures.
![\begin{boxedminipage}[t]{3.3in}
{\bf Finding (4): }
Storage subsystems using di...
...ailures,
while they are not revealed by {\it disk failures}.
\end{boxedminipage}](img13.png)
As Figure 5 shows, some disk models are used by storage subsystems of multiple system classes, together with various shelf enclosure models. For example, Disk A-2 and Disk D-2 are used in low-end systems with different shelf models and by mid-range and high-end systems with the same shelf model.
As we can see from Figure 5, for the storage subsystems using the same disk models, disk failure rates do not change much. For example, disk AFR of Disk D-2 varies from 0.6% to 0.77% with a standard deviation of 8%. For all storage subsystems sharing the same disk models, the average standard deviation of disk AFR is less than 11%.
On the other hand, the storage subsystem AFR exhibits strong variation. For example, AFR for storage subsystems using Disk D-2 varies from 2.2% to 4.9%, with a standard deviation of 127%. For all such storage subsystems, the average standard deviation of storage subsystem AFR is as high as 98%. This observation indicates that storage subsystem AFR is strongly affected by factors other than disk model, while these factors do not affect disk failures much.
![\begin{boxedminipage}[t]{3.3in}
{\bf Finding (5): }
The AFR for {\it disks} and...
...ore {\it disk failures} or
{\it storage subsystem failures}.
\end{boxedminipage}](img14.png)
We do not observe increasing disk failure rate or storage subsystem failure rate with increasing disk capacity. For example, as Figure 5 (e) shows, storage subsystems using Disk D-2 show lower disk and storage subsystem AFR than those using Disk D-1.
Shelf enclosures contain power supplies, cooling devices, and prewired backplanes that carry power and I/O bus signals to the disks mounted in them. Different shelf enclosure models are different in design and have different mechanisms for providing these services; therefore, it is interesting to see how shelf enclosure model affects storage subsystem failures.
 |
In order to study the impact of the shelf enclosure model, we look at the data collected from low-end storage systems, since low-end systems use the same disk models with different shelf enclosure models, so that we can study the effect of shelf enclosure models without inference from disk models.
![\begin{boxedminipage}[t]{3.3in}
{\bf Finding (6): }
The shelf enclosure model h...
...r one component depending on the
choice of other components.
\end{boxedminipage}](img16.png)
Figure 6 (a)-(d) shows AFR for storage subsystems when configured with different shelf enclosure models but the same disk models. As expected, shelf enclosure model primarily impacts physical interconnect failures, with little impact on other failure types, different from disk model, which impacts all failure types.
To confirm this observation,
we tested the statistical significance using a T-test [15].
As Figure 6 (a) shows,
the physical interconnect failures with different shelf enclosure models
are quite different (
![]() versus
versus
![]() ).
A T-test shows that this is significant at the 99.5% confidence interval,
indicating that
the hypothesis that physical interconnect failures are impacted by shelf enclosure models
is very strongly supported by the data.
Figure 6(b)-(d) shows similar observations
with significance at 99.5%, 99.9%, and 99.9% confidence.
).
A T-test shows that this is significant at the 99.5% confidence interval,
indicating that
the hypothesis that physical interconnect failures are impacted by shelf enclosure models
is very strongly supported by the data.
Figure 6(b)-(d) shows similar observations
with significance at 99.5%, 99.9%, and 99.9% confidence.
It is also interesting to observe that for different disk models, different shelf enclosure models work better. For example, for Disk-A2, storage subsystems using Shelf Enclosure B show better reliability than those using Shelf Enclosure A, while for Disk-A3, Disk-D2, and Disk-D3, Shelf Enclosure A is more reliable. Such observations might be due to component interoperability issues between disks and shelf enclosures. This indicates that we might not be able to make the best decision on selecting the most reliable hardware components without evaluating the components from a system perspective and taking the effect of interoperability into account.
As we have seen, physical interconnect failures contribute to a significant fraction (27-68%) of storage subsystem failures. Since physical interconnect failures are mainly caused by network connectivity issues in storage subsystems, it is important to understand the impact of network redundancy mechanisms on storage subsystem failures.
For the mid-range and high-end systems studied in this paper, FC drivers support a network redundancy mechanism, commonly called active/passive multipathing. This network redundancy mechanism connects shelves to two independent FC networks, and redirects I/O requests through the redundant FC network when one FC network experiences network component failures (e.g., broken cables).
![\begin{figure*}\htmlimage
\centering
\hspace{-0.3in}
\includegraphics[width=6cm]...
...ange systems \hspace{1.2in} (b) High-end systems }
\vspace{0.5pt}\end{figure*}](img19.png) |
To study the effect of this network redundancy mechanism, we look at the data collected from mid-range and high-end storage systems, and group them based on whether the network redundancy mechanism is turned on. As we observed from our data set, about 1/3 of storage subsystems are utilizing the network redundancy mechanism, while the other 2/3 are not. We call these two groups of storage subsystems dual paths systems and single path systems, respectively. In our data set, there are very few disk models used in both configurations; other disk models are mainly used in either dual paths systems or single path systems. Therefore, we cannot further break down the results based on disk models and shelf enclosure models.
![\begin{boxedminipage}[t]{3.3in}
{\bf Finding (7): }
Storage subsystems configur...
...g can greatly improve the reliability of storage subsystems.
\end{boxedminipage}](img20.png)
Figure 7 (a) and (b) show the AFR for storage subsystems in mid-range and high-end systems, respectively.
As expected, secondary path reduces physical interconnect failures by 50-60%
(
![]() versus
versus
![]() and
and
![]() versus
versus
![]() ),
with little impact on other failure types.
Since physical interconnect failure is just a subset of all storage subsystem failures,
AFR for storage subsystems is reduced by 30-40%.
This indicates that multipathing is an exceptionally good redundancy mechanism that delivers reduction of failure rates as promised.
As we applied a T-test on these results,
we found out that for both mid-range and high-end systems
the observation is significant at the 99.9% confidence interval,
indicating that the data strongly support the hypothesis
that physical interconnect failures are reduced by multipathing configuration.
),
with little impact on other failure types.
Since physical interconnect failure is just a subset of all storage subsystem failures,
AFR for storage subsystems is reduced by 30-40%.
This indicates that multipathing is an exceptionally good redundancy mechanism that delivers reduction of failure rates as promised.
As we applied a T-test on these results,
we found out that for both mid-range and high-end systems
the observation is significant at the 99.9% confidence interval,
indicating that the data strongly support the hypothesis
that physical interconnect failures are reduced by multipathing configuration.
However, the observation also tells us that there is still further potential in network redundancy mechanism designs. For example, given that the probability for one network to fail is about 2%, the idealized probability for two networks to both fail should be a few magnitudes lower (about 0.04%). But the AFR we observe is far from the ideal number.
One reason is that not only failures from networks between shelves contribute to physical interconnect failures; other failures, such as shelf backplane errors, can also lead to physical interconnect failures, while multipathing does not provide redundancy for shelf backplane. Another possible reason is that most modern host adapters support more than one port, and each port can be used as a ``logical'' host adapter. If two independent networks are initiated by two ``logical'' host adapters sharing the same physical host adapter, a host adapter failure can cause failures of both networks.
An important aspect of storage subsystem failures is their statistical properties. Understanding the statistical properties such as failure distribution of modern storage subsystems is necessary to build right testbed and fault injection models to evaluate existing resiliency mechanisms and to develop better ones. For example, some researchers have assumed a constant failure rate, which means an exponentially distributed time between failures, and that failures are independent, when calculating the expected time to failure for a RAID [13].
Figure 8 illustrates how disks are laid out in storage subsystems. As Figure 8 shows, multiple disks are mounted in one shelf enclosure and share the cooling service, power supply, and intrashelf connectivity provided by the shelf enclosure.
The figure also shows how disks are assigned to build up RAID groups, which include both data disks and parity disks containing redundant data. In order to prevent shelf enclosure from being the single point of failures for a whole RAID group, it is a common practice for a RAID group to span disks from multiple shelf enclosures.
In this section, we will study the statistical property of storage subsystem failures both from a shelf perspective and from a RAID group perspective.
![\begin{figure*}\htmlimage
\centering
\hspace{-1in}
\includegraphics[width=8cm]{s...
...ace{1.2in} (b) Failure distribution in a RAID group}
\vspace{3pt}\end{figure*}](img26.png) |
Figure 9 (a) and (b) show the empirical cumulative distribution function (CDF) of time between storage subsystem failures from a shelf and from a RAID group, respectively. To study the failure distribution from different disks in the same shelf/RAID group, we filtered out all duplicate failures. Since we only know when the failures are detected, instead of when the failures occur, the CDFs do not start from ``zero'' point. As all the storage subsystems studied in this paper send data verification requests to all disks hourly, as a proactive method to detect failures, we expect a short lag (up to an hour) between the occurrence and the detection of storage subsystem failures.
![\begin{boxedminipage}[t]{3.3in}
{\bf Finding (8): }
{\it Physical interconnect ...
...e effective in handling all storage subsystem failure types.
\end{boxedminipage}](img27.png)
As can be seen in Figure 9 (a), overall storage subsystem failures are very ``bursty.'' About 48% of overall storage subsystem failures arrive at the same shelf within 10,000 seconds of the previous failure. As expected, physical interconnect failures show the highest temporal locality, while even protocol failures and performance failures show strong temporal locality. None of these failure types follows distributions commonly used in failure theory, such as exponential distribution, Gamma distribution, or Weibull distribution.
On the other hand, disk failures show a much less ``bursty'' pattern, and the Gamma distribution provides a best fit for disk failure. For disk failures, we cannot reject the null hypothesis that disk failures follow the Gamma distribution with the Chi-Square-Test at the significance level of 0.05.
![\begin{boxedminipage}[t]{3.3in}
{\bf Finding (9): }
{\it Storage subsystem fail...
... subsystem failures to happen during a short period of time.
\end{boxedminipage}](img28.png)
As we mentioned above, it is common to build a RAID group across multiple shelves, in order to prevent shelf from being a single point of failure. As we found out from the storage logs, a RAID group on average spans about 3 shelves.
Figure 9 (b) shows the CDF of time between failures from the same RAID group. Compared to Figure 9 (a), failures are less ``bursty.'' About 30% of failures arrive at the same RAID group within 10,000 seconds of the previous failure, lower than 48% for failures from the same shelf enclosure. For all failure types, the temporal locality is reduced. This observation supports the common practice of building a RAID group across multiple shelves and encourages storage system designers to distribute RAID groups more sparsely.
![\begin{boxedminipage}[t]{3.3in}
{\bf Finding (10): }
{\it Storage subsystem fai...
...d resiliency mechanisms that can handle \lq\lq bursty'' failures.
\end{boxedminipage}](img29.png)
However, Figure 9 (b) still shows strong temporal locality, since multiple shelves may share the same physical interconnect, and a network failure can still affect all disks in the RAID group.
We repeated this analysis using data broken down by system classes and shelf enclosure models. In all cases, similar patterns and trends were observed.
![\begin{figure*}\htmlimage
\centering
\hspace{-0.3in}
\includegraphics[width=6cm]...
...sure failures \hspace{1in} (b) RAID group failures }
\vspace{4pt}\end{figure*}](img30.png) |
Our analysis of the correlation between failures is composed of two steps:
(1) Derive the theoretical failure probability model based on the assumption that failures are independent.
(2) Evaluate the assumption by comparing the theoretical probability against empirical results.
Next, we describe the statistical method we use for deriving the theoretical failure probability model.
We denote the probability for a shelf enclosure (including all mounted disks) to experience one failure during time T as P(1) and denote the probability for it to experience two failures during T as P(2). Let f(t) specify the failure probability at moment t.
Assume failures are independent, then we know that
 |
(1) |
 |
|||
 |
|||
 |
(2) |
Therefore,
 |
(4) |
We can derive the same formula for RAID group failure probability by replacing shelf enclosure with RAID group in the derivation above.
It is important to notice that the relation shown in equation 3 is a variation of a more common form:
| (5) |
The main difference is that we do not care about the order of failures in equation 3.
In the next section, we will compare this theoretically derived model against the empirical results collected from storage logs.
To evaluate the theoretical relation between P(1) and P(2) shown in equation 3, we first calculate empirical P(1) and empirical P(2) from storage logs. Empirical P(1) is the percentage of shelves (RAID groups) that have experienced exactly one failure during time T (we set T as one year), and empirical P(2) is the percentage of the ones that have experienced exactly two failures during time T. Only storage systems that have been in the field for one year or more are considered.
![\begin{boxedminipage}[t]{3.3in}
{\bf Finding (11): }
For each failure type, sto...
... by all disks in the same shelf enclosures (or RAID groups).
\end{boxedminipage}](img40.png)
Figure 10 (a) shows the comparison between empirical P(2) and theoretical P(2), which is calculated based on empirical P(1). As we can see in the figure, empirical P(2) is higher than theoretical P(2). More specifically, for disk failure, the observed empirical P(2) is higher than theoretical P(2) by a factor of 6. For other types of storage subsystem failures, the empirical probability is higher than the theoretical correspondences by a factor of 10-25. Furthermore, T-tests confirm that the theoretical P(2) and the empirical P(2) are statistically different with 99.5% confidence intervals.
This is a strong indication that, when a shelf experiences a storage subsystem failure, the probability for it to have another storage subsystem failure increases. In another word, storage subsystem failures from the same shelves are not independent.
Figure 10 (b) shows the similar trend for the failures from the same RAID groups. Therefore, the same conclusion can be made for storage subsystem failures from the same RAID groups.
Although in Figure 10 we set T to be one year, the conclusion is general to different values of T. We have set T to 3 months, 6 months, and 2 years, and also grouped data based on other factors, such as system classes and shelf enclosure models. In all cases, similar correlations were observed.
There are several reasons that can explain the correlation between each type of storage subsystem failures.
The disk failure probability depends on environmental factors, such as temperature [4]. Disks in the same shelf or the same RAID group are close to each other, sharing the same room temperature. Furthermore, disks in the same shelf are also sharing the cooling facility (e.g., fans) provided by the shelf. When the machine room temperature is above or below the normal range, all disks in the same shelf and the same RAID group may experience a higher than normal failure probability. Similarly, when shelf cooling facility does not work properly, all disks in the same shelf may have higher probability to fail.
Most physical interconnect components, such as host adapters, cables, and FC terminators on the shelf, are shared by disks in the same shelf or in the same RAID group. When a physical interconnect component such as a host adapter experiences transient hardware errors, all disks in the same shelf or the same RAID group have a higher than normal probability of physical interconnect failures.
Similarly, drivers for disks in the same shelf or the same RAID group are usually updated around the same time. If a particular version is buggy or has compatibility issues, all disks will have a higher probability of protocol failures.
For example, Seagate and Quantum study long-term reliability characteristics through accelerated life tests of small populations and collecting statistics from their return unit databases [4,21]. Based on such tests, they calculate the mean-time-to-failure (MTTF) and record it in a disk specification. For most of the disks, the specified MTTF is typically more than one million hours, equivalent to a lower than 1% annualized failure rate (AFR), which is slightly lower than what we observed (0.9-1.9%).
But vendor-specified MTTF is usually not what has been experienced by users. A study explained how disk manufactures and end customers can calculate MTTF in different ways [7].
Motivated by this observation, recently researchers have studied disk failures from a user's perspective by analyzing disk replacement logs collected in the field [14,16]. Interestingly, they found disks are replaced much more frequently (2-4 times) than vendor-specified AFRs. More interestingly, [16] found that the time between disks replacements in the same machine room does not follow the exponential distribution and exhibits significant levels of correlation. This finding is consistent with what we find about the time between storage subsystem failures in the same shelf and the same RAID group, while we further found out that different failure types show different statistical properties.
Additionally, some researchers analyzed the characteristics of disk latent sector errors, which can potentially lead to complete disk failures, using the data from Network Appliance AutoSupport Database as in [2]. Based on the same set of data, they further conducted a study on data corruption in [3]. They found enterprise class (e.g. FC) disks are more reliable than near-line (SATA) disks. Similarly, we discovered that FC disks have lower AFR (0.9%) compared to SATA disks (1.9%). However, we also observed that storage systems using FC disks are not necessarily more reliable than those using SATA disks, due to other component failures.
Some studies also look at the factors affecting disk failure rate, such as disk model, the number of disk heads, disk size, and environmental factors [2,6,14]. Similarly, in this paper, we looked at factors affecting storage failure rate, and found out that some factors strongly affecting storage failure rate have little impact on disk failure rate.
System component failure studies
Unfortunately, there is little work published on analyzing the reliability of storage system components.
Early work [17] presented a reliability analysis on disk array, and
claimed that other system components such as power supplies, HBAs, cooling equipment, and cabling cannot be ignored
when analyzing the reliability of a disk array.
However, their study was not based on real-world data.
Instead, they estimated reliability of disk array based on formula and datasheet-specified MTTF of each components,
assuming component failures follow exponential distributions and failures are independent.
One of the very few empirical studies on storage system failures was presented in [20]. This paper presented an analysis of hardware failures in their prototype storage systems during 6 months. They found out that disks are among the most reliable components in the system, while SCSI components (physical interconnects in their prototypes) generated a considerable number of failures. These findings are consistent with our study. However, limited by the scale of the study, their failure sample size (limited to 16 storage systems and a few hundred failures) is too small to study important characteristics of failures such as failure distribution and failure correlations, nor to identify factors affecting storage system reliability. Another related empirical study looked at storage system outages based on 4,400 system-year records, and categorized the outages based on their root causes [11]. Although sharing the similar goal of categorizing failures, our study looks into the details of the storage subsystem failure, which is considered as one outage category in [11]. Furthermore, our study is based on data in a much larger scale (about 137,000 system-years).
Beyond storage systems, an analysis of Tandem systems found out that software errors are an increasing portion of failures reported by customers [10]. Similarly, we found that protocol stacks account for 5-10% of storage subsystem failures.
Our study is based on support logs collected from 39,000 commercially deployed storage systems, which contain about 1,800,000 disks mounted in about 155,000 shelf enclosures. The studied data cover a period of 44 months. The result of our study provides guidelines for designing more reliable storage systems and developing better resiliency mechanisms.
Although disks are the primary components of storage subsystems and disk failures contribute to 20-55% of storage subsystem failures, other components such as physical interconnects and protocol stacks also account for significant percentages (27-68% and 5-10%, respectively) of storage subsystem failures. The results clearly show that the rest of storage subsystem components cannot be ignored when designing a reliable storage system.
One way to improve storage system reliability is to select more reliable components. As data suggests, storage system reliability is highly dependent on both disk model and shelf enclosure model. We also found out that there might be a different ``better'' model for different storage systems, depending on other components used in the systems. Another way to improve reliability is to employ redundancy mechanisms to tolerate component failures. One such mechanism studied in the paper is multipathing, which can reduce AFR for storage systems by 30-40% when the number of paths is increased from one to two. Storage system designers should also think about using smaller shelves (fewer disks per shelf) but more shelves in storage systems, since data indicates that spanning a RAID group across multiple shelves can reduce the probability of ``bursty'' failures.
We also found out that storage subsystem failure and individual storage subsystem failure type exhibit strong self-correlations. In addition, these failures also exhibit ``bursty'' patterns. These results motivate a revisit to resiliency mechanisms such as RAID that assume independent failures.
Future work will compare the impact of different failure types and study how to design resiliency mechanisms targeting individual failure types, given that different failure types show different statistical properties. Another future direction is to design storage failure prediction algorithms based on component errors. We also want to extend this study to other components of storage systems beyond the storage subsystem.
0.8
Trademark Notice: NetApp, the Network Appliance logo are registered trademarks and Network Appliance is a trademark of Network Appliance, Inc. in the U.S. and other countries. All other brands or products are trademarks or registered trademarks of their respective holders and should be treated as such.
![\begin{figure}\htmlimage
\centering
\includegraphics[height=9cm]{arch.eps}
\end{figure}](img5.png)
![\begin{figure}\htmlimage
\centering
\includegraphics[height=8cm]{disk_subsys.eps}\end{figure}](img6.png)
![\begin{figure}\htmlimage
\centering
\vspace{-0.2in}
\includegraphics[height=6cm]{log.eps}
\vspace{-0.6in}\end{figure}](img7.png)
![\begin{figure}\htmlimage
\vspace{-0.3in}
\includegraphics[width=7cm]{shelf_raid.eps}
\vspace{-0.3in}\end{figure}](img25.png)