 |

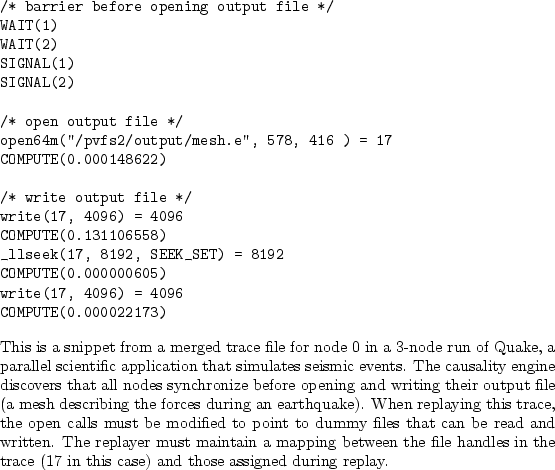
After traces have been annotated with COMPUTE(), SIGNAL(), and WAIT() calls, replay is straightforward, and the traces are easy to interpret. Each file operation can be replayed almost as-is; the syntax is similar to that of Unix strace. Of course, filenames must be modified to point to dummy data files (which must be created prior to replay if they are not created by the application) and the replayers must maintain a mapping between the file handles in the trace and those assigned during replay. As for the synchronization, developers are free to implement these calls using any synchronization library (e.g., MPI [20], Java [19,43], CORBA [49]) that is convenient (we use MPI); the COMPUTE() call is implemented by spinning for the specified amount of time. Computation is simulated by spinning, rather than sleeping, in order to induce a CPU load on the system like the application.
Figure 8 shows a merged trace file, obtained via the causality engine from a parallel scientific application [2]. In addition to enabling accurate replay, a trace instrumented with synchronization and computation reveals interesting information regarding program structure.