I/O traces play a critical role in storage systems evaluation. They are captured through a variety of mechanisms [3,4,7,16,24,50], analyzed to understand the characteristics and demands of different applications, and replayed against real and simulated storage systems to recreate representative workloads. Often, traces are much easier to work with than actual applications, particularly when the applications are complex to configure and run, or involve confidential data or algorithms.
However, one well-known problem with trace replay is the lack of appropriate feedback between storage response times and the arrival rate of requests. In most systems, storage system performance affects how quickly an application issues I/O. That is, the speed of a storage system in part determines the speed of the application. Unfortunately, information regarding such feedback is rarely present in I/O traces, leaving replayers with little guidance as to the proper replay rate. As a result, some replayers use the traced inter-arrival times (i.e., timing-accurate), some adjust the traced times to approximate how a workload might scale, and some ignore the traced times in favor of an ``as-fast-as-possible'' (AFAP) replay. For many environments, none of these approaches is correct [17]. Worse, one rarely knows how incorrect.
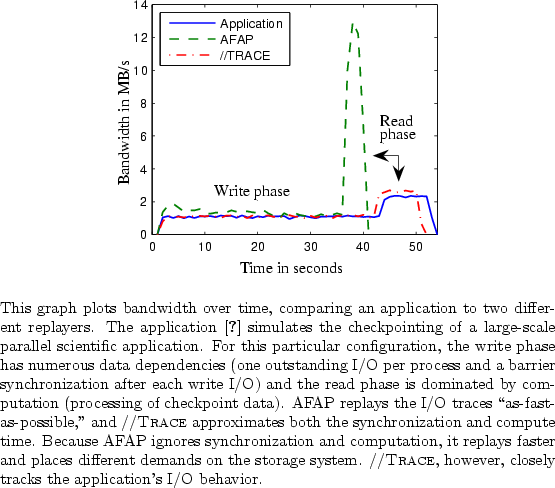
Tracing and replaying parallel applications adds complexity to an already difficult problem. In particular, data dependencies among the compute nodes in a parallel application can further influence the I/O arrival rate and, therefore, its demands on a storage system. So, in addition to computation time and I/O time, nodes in a parallel application also have synchronization time; such is the case when, for example, one node's output is another node's input. If a replay of a parallel application is to behave like the real application, such dependencies must be respected. Otherwise, replay can result in unrealistic performance or even replay errors (e.g., reading a file before it is created). Figure 1 illustrates how synchronization and computation can affect the replay accuracy.
Parallel applications represent an important class of applications in scientific and business environments (e.g., oil/gas, nuclear science, bioinformatics, computational chemistry, ocean/atmosphere, and seismology). This paper presents //TRACE, an approach to accurately tracing and replaying their I/O in order to create representative workloads for storage systems evaluation.
//TRACE actively manages the nodes in a traced application in order to extract both the computation time and information regarding data dependencies. It does so in a black-box manner, requiring no modification to the application or storage system. An application is executed multiple times with artificial delays inserted into the I/O stream of a selected node (called the ``throttled'' node). Such delays expose data dependencies with other nodes and also assist in determining the computation time between I/Os. I/O traces can then be annotated with this information, allowing them to be replayed on a real storage system with appropriate feedback between the storage system and the I/O workload.
//TRACE includes an execution management script, a tracing engine, multi-trace post-processing tools, and a parallel trace replayer. Execution management consists of running an application multiple times, each time delaying I/O from a different node to expose I/O dependencies. The tracing engine interposes on C library calls from an unmodified application to capture I/O requests and responses. In the throttled node, this engine also delays I/O requests. The post-processing tools merge I/O traces from multiple runs and create per-node I/O traces that are annotated with synchronization and computation calls for replay. The parallel trace replayer launches a set of processes, each of which replays a trace from a given node by computing (via a tight loop that tracks the CPU counter), synchronizing (via explicit SIGNAL() and WAIT() calls), and issuing I/O requests as appropriate.
Experiments confirm that //TRACE can accurately recreate the I/O of
a parallel application.
For all applications
evaluated in this paper,
the average error is below 6%.
Of course, the cost of //TRACE is the
extra time required to extract the I/O dependencies. In the extreme, //TRACE
could require ![]() runs to trace an application executed
on
runs to trace an application executed
on ![]() nodes. Further, each of these runs will be slower than
normal because of the inserted I/O delays. Fortunately, one can
sample which nodes to throttle and
which I/Os to delay, thus introducing a useful trade-off between tracing time and replay accuracy.
For example, when tracing a run of Quake [2] (earthquake simulation),
delaying every 10 I/Os (an I/O sampling period of 10) increases
tracing time by a factor of 5 and yields a replay accuracy of 7%. However, one can increase the
period to 100 for an 18% error and a tracing time increase of 1.7x.
nodes. Further, each of these runs will be slower than
normal because of the inserted I/O delays. Fortunately, one can
sample which nodes to throttle and
which I/Os to delay, thus introducing a useful trade-off between tracing time and replay accuracy.
For example, when tracing a run of Quake [2] (earthquake simulation),
delaying every 10 I/Os (an I/O sampling period of 10) increases
tracing time by a factor of 5 and yields a replay accuracy of 7%. However, one can increase the
period to 100 for an 18% error and a tracing time increase of 1.7x.
This paper is organized as follows. Section 2 provides more background, motivates the design of //TRACE, and discusses the types of parallel applications for which it is intended. Section 3 overviews the design of //TRACE. Section 4 details the design and implementation of //TRACE. Section 5 evaluates //TRACE. Section 6 summarizes related work. Section 7 concludes.