


Next: Conclusions
Up: Results
Previous: Throughput versus Response Time
Figure 10:
A comparison
of LRW, CSCAN, and WOW. The left panel displays
achieved overall throughput versus achieved average response time.
This set-up has significant temporal locality since the ratio of
NVS size to the size of the backend is relatively high (4.52%).
WOW increases the peak throughput over LRW by 9% and
over CSCAN by 129%. The right panel shows the target
throughput corresponding to the data points in the left panel. It
can be clearly seen that CSCAN hits an insurmountable stiff
wall at a much lower throughput.
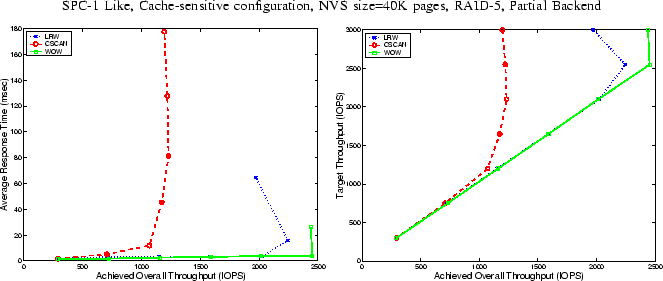 |
In Figure 10, we compare LRW, CSCAN,
and WOW using SPC-1 Like workload directed to Partial
Backend on RAID-5. We use an NVS size of 40K pages each of 4KB.
Hence, NVS to backing store ratio is relatively large, namely,
4.52%, constituting a cache-sensitive scenario.
We vary the target throughput of SPC-1 Like from 300 IOPS to 3000
IOPS. At each target throughput, we allow a settling time of 10
mins, after which we record average response time over a period of
8 minutes.
It can be clearly seen that WOW dramatically outperforms
CSCAN and even outperforms LRW. In particular, it can
be seen that CSCAN finds it impossible to support throughput
beyond 1070 IOPS. In contrast, WOW and LRW saturate, respectively, at 2453 and 2244 IOPS. In other
words, WOW delivers a peak throughput that is 129% higher
than CSCAN, and 9% higher than LRW.
Remark 6.1 (backwards bending)
Observe that in Figures 9 and 10
when trying to increase the target throughput beyond what the
algorithms can support, the throughput actually drops due to
increased lock and resource contention. This ``backwards bending''
phenomenon is well known in traffic control and congestion where
excess traffic lowers throughput and increases average response
time.
Next: Conclusions
Up: Results
Previous: Throughput versus Response Time
Binny Gill
2005-10-17