
 |
 |
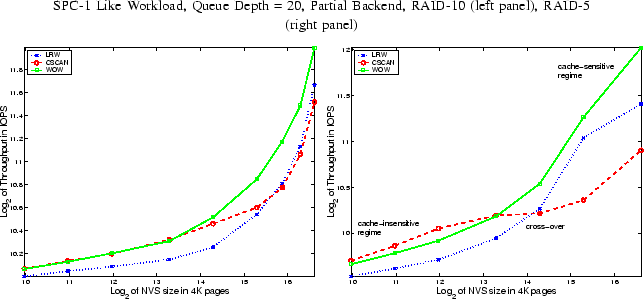
In Figure 7, we compare LRW, CSCAN, and WOW using SPC-1 Like workload (Section V-B) directed to Partial Backend on RAID-5 and RAID-10. We vary the size of NVS from very small (corresponding to cache-insensitive regime) to relatively large (corresponding to cache-sensitive regime). For RAID-10, a target throughput of 6000 IOPS was used for all NVS sizes. For RAID-5, a target throughput of 3000 IOPS was used for all NVS size except the largest one (100,000 pages) for which a target throughput of 6000 IOPS was used to drive the disks to full capacity.
In both graphs, it is easy to see that CSCAN dominates LRW in the cache-insensitive regime, but loses to LRW in the cache-sensitive regime. WOW, however, is evergreen, and performs well in both the regimes. This is easy to see since in a cache-insensitive regime CSCAN wins by exploiting spatial locality, whereas in cache-sensitive regime LRW puts up a nice performance by exploiting temporal locality. However, WOW which is designed to exploit both temporal and spatial locality performs well in both the regimes and across the entire range of NVS sizes.
Specifically, in RAID-10, for the smallest NVS size, in a favorable situation for CSCAN, WOW performs the same as CSCAN, but outperforms LRW by 4.6%. On the other hand, for the largest NVS size, in a favorable situation for LRW, WOW outperforms CSCAN by 38.9% and LRW by 29.4%.
Similarly, in RAID-5, for the smallest NVS size, in a favorable situation for CSCAN, WOW loses to CSCAN by 2.7%, but outperforms LRW by 9.7%. On the other hand, for the largest NVS size, in a favorable situation for LRW, WOW outperforms CSCAN by 129% and LRW by 53%. In Figure 8, we examine, in detail, the write hit ratios and average difference in logical address between consecutive destages for all three algorithms. The larger the write hit ratio the larger is the temporal locality. The larger the average distance between consecutive destages the smaller is the spatial locality. It can be seen that temporal locality is the highest for LRW, followed by WOW, and the least for CSCAN. On the contrary, spatial locality is the highest for CSCAN, followed by WOW, and the least (by 3 to 4 orders of magnitude) for LRW. As shown in the right panel of Figure 7, WOW outperforms both LRW and CSCAN by effectively combining temporal as well as spatial locality.