
Carnegie
Mellon’s CyDAT
Harnessing
a Wide Array of Telemetry Data to Enhance
Distributed System Diagnostics
Chas DiFatta (chas@cmu.edu), Mark Poepping
(poepping@cmu.edu), Carnegie Mellon University
Daniel V. Klein (dvk@lonewolf.com), LoneWolf Systems
Abstract
The number and complexity of distributed applications has exploded, and to-date, each has had to create its own method for providing diagnostic tools and performance metrics. These distributed services have become increasingly dependent, not only on the system and network infrastructures upon which they are built, but also each other. The effectiveness of a diagnostician is seriously hindered by the difficulty in accessing diagnostic data. However, even when access can be gained, it exposes the daunting challenge of correlating a myriad of different data formats and an incredible amount of data (both in static files and real time streams). To say that diagnosis of distributed systems is a complex and difficult is a vast understatement; and the task is getting tougher every day. There is a paucity of tools, data mining methods and logfile standards that has been worsening for years. Researchers face the same difficulty in gaining access to data for purposes of experimentation. Responding to these difficulties, we've established the CyDAT (Cyber-center for Diagnostics Analytics and Telemetry) effort within CyLAB at Carnegie Mellon, to enable researchers to interact with a rich and varied set of data in an open, multi-vendor environment that enables and supports open, interdisciplinary research. This paper described the CyDAT and a reference implementation of an event framework (EDDY) to normalize, transform, and transport telemetry data to the analytics that need them, providing a means for tackling the diagnostic Hydra.
Introduction
Consider any of the myriad daily tasks we perform at our computers: sending email, browsing web and ftp sites, accessing remote databases, submitting forms on the web (including the submission of this paper). Now consider the myriad failures that we have all experienced when attempting these tasks – some silent, some cryptic, and some verbose. When something goes wrong, what is the cause?
The problem could be caused by a hundred different circumstances: perhaps the web site is at fault, maybe there’s an intervening firewall, possibly a link is down, or your perhaps the document has a virus. How can we quickly pinpoint the most effective next step as we try to fix (or work around) the difficulties?
There are many difficult issues to address, and the most significant challenge is that the log information is never written in the language of the problem. There’s no log that says “Doug doesn’t know if he submitted his proposal,” so even in the simplest of scenarios it is incredibly difficult to map the question of “what went wrong?” to a solution of “here’s what happened and what you need to do next”.
In spite of great strides in software development languages, software engineering techniques, hardware engineering, fabrication, and quality management methodologies, errors remain inevitable in the systems we deploy, and systems still fail. As the demands on computing systems continue to increase and the complexity of interdependent components continues to grow, problems in production environments will increasingly result from unexpected interactions between software components; from a range of infrastructure layers that were developed separately, at different times, and by different people, mostly with little knowledge of the requirements now placed on their components.
This combination of conditions leaves the modern IT shop in the very difficult position of having precious little information about failures when they occur, with little to go on in trying to avoid the next failure or limit its potential impact. Diagnostic procedures have gone from a simple program to test the proper functioning of a component to black-art intuition based on incomplete information.
Logging (or the lack thereof) extends to physical systems and environments as well as virtual. The process control industry long ago learned that process monitors, flow-rate meters, and active controls are as essential to the manufacturing process as the pipes, valves, and reactions they monitor and control. With the recent and continuing emergence of inexpensive small sensors, an explosion in capability for sensing and telemetry has been created. Networked through Information Technology standards, this new physical sensing and control capability is partly transformed into an Information Technology problem.
Carnegie Mellon has significant research efforts that have contributed solutions to IT and IT-enabled systems. From embedded sensor systems, health of legacy infrastructures, and behavior of active physical environments, through software systems research, security infrastructures, and process modeling techniques, involving data mining, fault tolerance, and autonomics, to algorithms for pattern analysis, behavior characterization, and anomaly detection. All this research shares at least one common thread: the need for systematic gathering and management of data related to the system being studied and the experiment designed to inform the researcher. This Data Problem forces most researchers to become expert data collectors in addition to their core domain expertise as data analyzers, synthesizers, and hypothesizers.
The Cyber-center for Diagnostics, Analytics, and Telemetry is a attempt to create an open, advanced, collaborative instrument to support research into the collection, management, and use of advanced telemetry and analytics in a multi- and inter-disciplinary fashion.
It is not aimed at any particular discipline or analytic approach. Rather it expects to accommodate and integrate telemetry data, analytic algorithms, and response mechanisms for multiple disciplines for radical improvement.
CyDAT is positioned to catalyze and significantly reduce the data collection and management burden for researchers while simultaneously expanding the realm and reach of data possibilities, including information from operational systems, experimental sensors, and laboratory environments. The essential goal is to create a capability and expertise in data orchestration and management along with a generalized, sustained research instrument to gather and manage data from arbitrary IT-enabled observation points, making that data available to researchers with interest to study it.
We have established a framework and created an evolving environment where we can begin to effectively experiment with parameters of Telemetry, Analytics, Diagnostics, and Autonomics
Interviews were initially conducted with a wide variety of individuals who both use and manage large distributed system facilities, as well as smaller IT shops. Help desk staff, system and network administrators, managers, systems architects and developers all participated in the interviews. Surprisingly, most shared a common belief of the major obstacles in diagnosing distributed systems. These obstacles can be categorized into five specific areas which we call the “banes of the distributed system diagnostician:”
· Access: Little or no access to diagnostic data on systems that may be involved in the fault. If access could be obtained to the system, then chances are that file protection access was restricted. When there was a need to share data with others outside the administrative domain of the system in question, it was an extremely difficult process due to policy concerns. In many cases the logging of specific diagnostic data had been suspended or had never been enabled.
· Multiple Formats: Most systems have many log formats (typically one for each service: application, version, OS type, etc). Keeping up with version changes becomes a daunting task.
· Scale: Systems that provide enterprise mail or web services generally have an enormous amount of log data generated. Network devices (such as routers) have flow data in excess of 100K flow events/sec. Each event could contain between 128 and 512 bytes, which is approx. 50MB/sec. Clearly, collecting these events and inserting them in a database is not possible.
· Proof of the diagnosis: There is a need for a common audit record to provide evidence for non-repudiation when two or more participants are working on the problem. A typical scenario is where the network group says “it’s the problem with the web application,” and the web developers say “it’s the network.” Which group is right and how can you prove it?
· Sharing Knowledge: Having domain experts share their diagnoses and the methods for discovery with the rest of the organization is essential, not only for rapid fault diagnosis but efficient use of resources. Automating the transfer of knowledge from an expert to less experienced operational staff was deemed very important to those interviewed.
The group agreed to take a direction that promoted experimenting with new diagnostic methods to begin to understand the scale of the task at hand and test if our ideas would expose any possibility of success without the investment of too many resources.
While the access problem was complex, we decided to opt for a simple solution: to export the diagnostic data off the system quickly (in real-time), to a common data-store and use file/directory permissions as well as specific anonymization methods to preserve privacy while exposing valuable information. An additional requirement was when exporting the diagnostic data off the target system, there should be minimum changes needed to the existing logging system. This way, adoption of our methods within production facilities would be more widely accepted.
The diagnostic data format issue (currently being addresses by many standards organizations) was extremely fragmented; based primarily on the diagnostic domain (network, security, etc). Monitoring their assorted efforts would be the best approach to gain insight of any consolidation. Rather then waiting (perhaps years) for the standards to consolidate, we decided to take a radical leap and build a common event record (CER). In designing the CER, we attempted to maximize the ability to correlating events while remaining as domain-agnostic as possible (and enabling us to proceed with research while the standards were still being bickered over).
While our main focus was within the IT realm (system, network, application and security events), colleagues began encouraging us to consider including events outside of IT, including building management, environmental sensors, and healthcare domains. This expansion would certainly test the design of our CER as regards being a generic event diagnostic record. At the same time it would prove that the CER would be flexible enough to serve as a base for experimentation in other (non-IT) domains. Additiionally, the CER design also directly addressed the non-repudiation requirement. so a common audit record could be used for all diagnostic domains.
Some members within our development group thought that the issue of scale would be the primary challenge, drawing analogies to “finding a needle in a haystack.” Interviews with diagnostic experts suggested that most of the diagnostic data generated would be of little use to a broad audience. Specific diagnostic domain areas would be interested in only that data that their analysis tools could process, but regardless wanted the ability to receive additional diagnostic data, as needed. Since network events presented the greatest volume of data (and thus the greatest challenge to scalability), the group set a proof-of-concept scale of at least 5K events/sec initally. If our testbed could handle that, we stood a good change of addressing scale in other event domains.
We also wanted to capture the knowledge of expert diagnosticians and export it to other members of their tream in an automated way, therefore a new taxonomy was needed. This taxonomy would result in an automated means of collecting information into manageable groups. We focused on an approach that acknowledged that:
· there would be multiple orders of diagnostic events, where the lower orders would be the single records within the logs themselves,
· by combining events multiple events, one could generate higher orders of events (much like an expert does when they begin to diagnose a problem).
See Figure 1 for a representational overview of the flow of data consolidation, reduction, and synthesizing higher order analysis records.
Consider the case where an organization uses flow records to monitor their network egress for bandwidth abuse. We envisioned (and constructed) agents that:
· process flow records at a high rate of over 8,000 events/sec
· transform groups of flow events into a consolidated record that enables better correlation
· strip off the attributes that are of little value to the end analysis tool
· build higher order events that express the N hosts that use the most network bandwidth, packets, and flows (as well as which services each uses).
The higher order events would only need to be updated every 10 seconds or so (which would be a mere fraction of the traffic generated by the network flow records). These high-order events (which would mimic those created by a domain-expert) could feed help desk and bandwidth abuse applications. The intermediate events could feed security applications and (if properly anonymized), could be used by researchers for a myriad of purposes (see Figure 2).
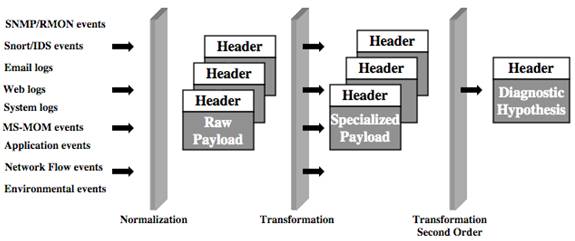
Figure 1: Representational overview of event collection, transformation/reduction and analysis
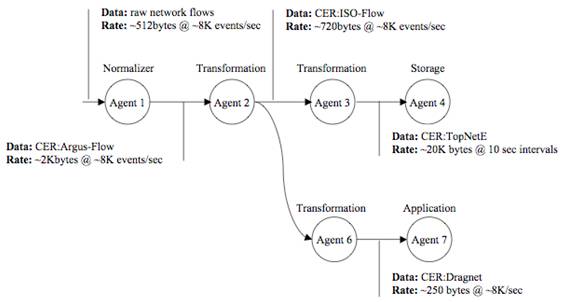
Figure 2: Real-world usage, analysis of Network Flows
It was clear from the onset that a generalized architecture and data model was required as a reference to assist in managing integration-maturity through the variety of data formats and transport models.
With the pre-exisiting and on-going work on standard formats for representing log and performance data, it was not scalable or effective for us to immediately engage in standards work. Indeed, the goals of data standardization are entirely complementary to the primary goals of CyDAT as a place for integration and experimentation, so we instead opted for a very simple and flexible model to encapsulate the native format while allowing for experimentation on incremental exposure of native semantics.
Since we had had significant experience with a data-driven model for real-time reporting of network flow information, it was natural for us to design from a data-flow (or streaming database) perspective. Although many log and event models engage file-based recording instead of a push-based event model, a real-time element provides significant additional flexibility to the current routine.
The general model engages a modified pipeline pattern where data sources are immediately normalized into a common event form. They may then be transported across a backplane of agents to optimize the flow of information to target analytics. Figure 3 shows a high-level view of the proposed architecture (as embodied in the reference implementation). The following is a short description of the core elements of the pipeline model.
· Normalize – encapsulate raw events in their native form for transport to interested agents
· Select – choose which events to receive based on preset (or adaptive) search criteria
· Transform – modify the form (e.g. syntax or scale) of an event
· Project – choose a subset of elements from a particular event (this feature requires some semantic parsing of raw events)
· Route – transport events to downstream agents based on static or dynamic configuration
· Store – retain sets of events for later analysis
· Query – ask for historical events of interest
· Analyze – examine contents of one or more events from one or more sources to automate correlation and validate hypotheses
· Application Proxy – reformat event syntax so it may be consumed by an external application
There are many other semantic elements not described in detail here, including issues of discovery, access control, privacy, delivery guarantees, data lifecycle, optimization, provisioning, element actuation, adaptive configuration, and proxy to/from existing applications, but these nine methods are suggested as basic capability for the event backplane to support a good base model from which to build.
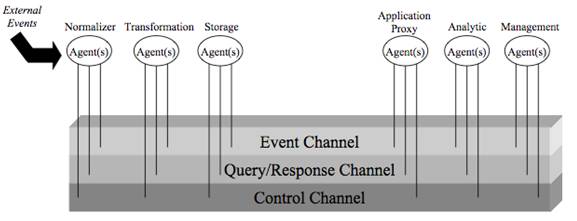
Figure 3: The CyDat Architecture as embodied in the EDDY diagnostic backplane
Getting Started: The EDDY Reference Implementation
For a basic architecture, we needed an experimental core to build around in order to begin testing concepts and begin integration as use-cases brought new platforms and pieces to be fitted. We created a reference implementation called EDDY (for End-to-end Diagnostic Discovery) to get ourselves started.
EDDY is an experimental lingua franca for exchange, management, and correlation of log and event information. It defines a common form for encapsulation and a method for efficient transport of native event information from sensors to data managers to analyzers.
The EDDY architecture is grounded in the following assumptions:
1. Performance matters and pragmatics are important – there is no end to the monitoring one might do and no limit to the variations that different sites will choose. A system must be simple enough to be useable by a small installation with only a few focused events per minute, yet flexible and fast enough to accommodate a large installation with millions of distributed events per second.
2. It must be possible to experiment and grow into the use of a unified diagnostic data management system without mandating a ‘cutover’ day – without immediate or catastrophic change to existing diagnostic infrastructures and techniques.
3. Leverage domain expertise, don’t reinvent the wheel. The initial goal of EDDY is to provide a data orchestration function that can be leveraged by existing analytic techniques, but the final goal is to enable those techniques to be composed, modified, and extended to consider other information (possibly including that which hadn’t previously been available) in the analysis.
4. Models may be pretty but there must be working code. Our initial approach has led to some innovative correlation, but there is much to learn. There are many options for creating an interoperable diagnostic infrastructure. We intend to build and learn and rebuild, focusing on the standardization and reference implementation of key formats and interfaces to enable interoperation.
Initial Directions and Prototypes
In 2004 we decided to focus on building a diagnostic event orchestration platform to experiment with different methods and data structures. This would address the five banes of the diagnostician, be as inobtrusive as possible (to create a low barrier for adoption), and be flexible enough to enable component substitution (to facilitate experimentation). The initial version (0.1) of this experimental platform (the End-to-end Diagnostic DiscoverY, or EDDY), was released in 2005. It was developed in Java, which proved to be a good compromise between application performance and rapid application development. Other languages would be considered at a later date, incoporating developer preference, performance, or interfaces to event import/export. A requirement of the platform was the ability to supply campus researchers with a source of data that was isolated from format changes at the source (version changes or changing network flow engines) and that accommodated a wide variety of analysis applications (with different APIs). The initial data types we focused on were network flow events and application events such as HTTPD, and Syslog.
The EDDY architecture was designed fundamentally to be simple, efficient, and highly extensible. We started from the assumption that there was much we didn’t know, and any initial design was likely to require several iterations before the components of value would become apparent. In that spirit then, we started from a small kernel of functionality to satisfy some simple requirements and constraints.
The following provides the basic motivation and description of the elements and format of the EDDY Common Event Record (CER) architecture, the basic data construct of the EDDY diagnostic infrastructure.
1. Minimal common event elements: to maintain efficiency and maximize generality, we felt that only a few elements were essential
o CER version
o Unique reference identifier per record
o Timestamp for event creation
o Location where the event was seen
o Location where the event was introduced into the event backplane
o Type of enclosed event
2. Additional common elements: to allow immediate experimentation with generic analysis and correlation across multiple sources and event types.
o Severity of the event, an easily identifiable and discoverable parameter to assist in high-level classification of events;
o An explicit, extensible user ‘tag’ attribute, representative to the desire to easily leverage (and route) important event semantics
3. Encapsulation of the transported events: no constraints on domain-based definition of events.
o Opaque encapsulation of external schema – many domains have ongoing efforts to define control and audit information appropriate for their own components. The basic idea is to capture the external event in its entirety, attach the required common elements, calculate and attach the extra common elements, and forward it along, now enabled for normalized processing.
o Ad hoc schema – in addition to pre-existing events, we anticipate that a pipelining of events and event processors will give rise to new event types, borne from creative analysis of sets of event flows. Two possibilities include: composing events (merging a set of events into a single “class” or “super” event) and analyzed events (where a certain sequence of events indicates another condition).
4. Event representation: variations in representation and exposure of key event elements can allow for pipeline processing and real-time insights not previously possible.
We decided to use XML for formatted representation of common event elements. This has its tradeoffs (verbosity and the overall volume of data transmitted), but the flexibility and wide availability of XML read/write tools allows us to easily experiment and still optimize when needed. This enables us to easily encapsulate events, with both “raw events” (a complete, opaque origin event encapsulated in minimal XML) and “cooked event elements” (a hierarchical XML representation of specific components from the origin event).
Generic correlation across event types from different domains will require common semantics, but as this is very new, we also wanted to enable experimentation. We started with two forms of standardization of common schema elements for inter-domain processing:
o Simple data types (e.g. integer, string) for event elements. This will allow a great number of generic analyses completely agnostic of event domain. Instance counts and statistical analyses are often the best first reporting requirements.
o Common diagnostic objects (e.g. host, temperature, location). As we learn more, we will discover objects and elements that are common subjects and actors across a great number of domains. As we attempt to correlate events based on the commonality of subject or actor, new experimental syntax and semantics will be required. We have little preconceived notion for the extent of this need, but expect to see many models for experimentation.
The following provides a summary description of the elements and form of the EDDY transport architecture, the basic method for moving Common Event Records.
1. The Event Channel emulates a UNIX pipeline for transporting events from a source, through selection and translation, to analysis or storage. There are several key values we immediately gain through a data-driven approach:
o it enables in-line analytics and some easy data-reduction optimizations.
o it allowed us to defer issues regarding data discovery, location, and authorization. If we presume to push the appropriate data to those with the interest and authorization to receive it, we do not have to design nor implement universal data access and protection protocols. Simplifying the problem simplified our task.
o it deferred considerations for database maintenance and lifecycle issues
o it is entirely compatible with and complementary to a process-driven model.
The default model for the event channel is unmodified event forwarding from source to destination (other models are of course available). The EDDY architecture enhances this basic view by an explicit definition of event selection, and by replication methods at each point in the pipeline. The EDDY architecture also provides a control method for a downstream component to interact with an upstream provider, in order to modify the content of the data stream.
2. The Query Channel is a process-driven system for event processing, where an investigator writes queries against a data store to acquire information. The EDDY reference implementation currently does not implement a rich query model, expecting that other common, complementary elements could easily add this desired functionality.
While the reference implementation is primarily to experiment with functional elements, our first pragmatic assumption was that performance matters, so we did identify a few goals to support the notion of CyDAT as living laboratory:
Our initial target rate was 10,000 records per second between two modern desktop hosts. This number was chosen because it mapped to the event rate for a network flow probe on a moderately loaded enterprise backbone. Transaction rates for most other logging systems are generally substantially less than this, though there are many scenarios where this is woefully inadequate.
As the bandwidth of data being analyzed (and reported) increases, a divide-and-conquer method can be applied to assist in event processing. We envision several approaches to horizontal scaling to aid performance:
· Selective projection – substantially reduce total bandwidth and text processing by in-flight trimming of records to contain only data of interest.
· Partial stream commonality – replication of a single source feed to multiple sinks.
· Parallel striping – combine selective projection and partial stream commonality to enable striped processing.
· Compression of XML (reducing a verbose general format into a concise domain-specific format).
· Sessioning – collecting redundant elements of successive events into a session to reduce overall data transmissions.
Although “a little learning is a dangerous thing,” a complete knowledge of the workings (and failings) of an IT network can be even more dangerous in the wrong hands. Therefore, the security ramifications of collecting and correlating activity data cannot be overstated. It is our opinion that we must address the issues up-front to allow for open dialogue about the risks inherent in this style of activity, but also to weigh the value of new methods against the risk of abuse, and to openly encourage work to maximize value and minimize risk.
One aspect of the transformation of data must include the ability to anonymize data so that trends can be identified without exposing individual components to targeted attack.
CyDAT is a real-world, active testbed for experimentation with real-time and historical performance data for active and experimental systems in many areas across Carnegie Mellon. CyDAT leverages EDDY to deliver diagnostic events to algorithms for dynamic analysis. In the current incarnation at Carnegie Mellon, we are monitoring network flows from both core and egress networks comprising over 100,000 hosts, we’re enabling analysis on DNS lookups, web access, syslog records, email logs, Shibboleth logs, embedded system events, environmental sensors, and more..
We are continuing to evolve the testbed based on our experiences, and believe that it is a fertile environment for experimenting with a highly distributed, ever-changing distributed ecosystem. The EDDY prototype supplies both IT staff and researchers valuable diagnostic data to their analytics, in real-time and in the form that they need.
The EDDY source code is freely available at http://www.cmu.edu/eddy, and we encourage other organizations to experiment, grow, and contribute to the toolset. We are also actively encouraging industry leaders to adopt the EDDY diagnostic framework, which will further enhance its usability and acceptance, and ultimately improve the state of distributed diagnostics
TBD. There are many auxiliary references, but little of the related work is directly cited, above. If accepted, we will fill out this section, but time constraints preclude this in our initial [delayed] submission.
Development of the EDDY Toolkit was supported with funding from Carnegie Mellon University and the National Science Foundation (CNS-0433540), plus early support from Internet2 and the NSF Middleware Initiative (Cooperative Agreement No. OCI-0330626).