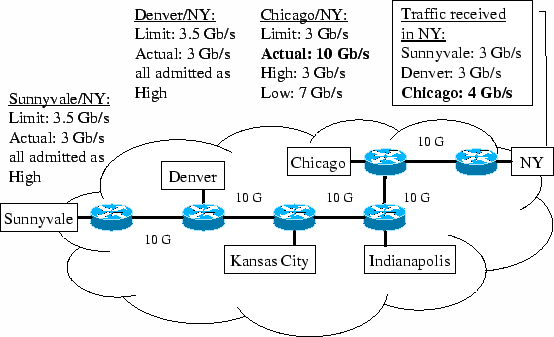
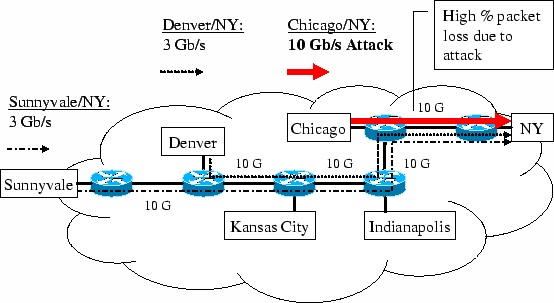
Proactive Surge Protection: A Defense Mechanism
for Bandwidth-Based Attacks


Jerry Chou, Bill Lin University of California San Diego
Subhabrata Sen, Oliver Spatscheck AT&T Labs-Research

Abstract

Large-scale bandwidth-based distributed denial-of-service (DDoS) attacks can quickly knock out substantial parts of a network before reactive defenses can respond. Even traffic flows that are not under direct attack can suffer significant collateral damage if these flows pass through links that are common to attack routes. Given the existence today of large botnets with more than a hundred thousand bots, the potential for a large-scale coordinated attack exists, especially given the prevalence of high-speed Internet access. This paper presents a Proactive Surge Protection (PSP) mechanism that aims to provide a broad first line of defense against DDoS attacks. The approach aims to minimize collateral damage by providing bandwidth isolation between traffic flows. This isolation is achieved through a combination of traffic measurements, bandwidth allocation of network resources, metering and tagging of packets at the network perimeter, and preferential dropping of packets inside the network. The proposed solution is readily deployable using existing router mechanisms and does not rely on any unauthenticated packet header information. Thus the approach is resilient to evading attack schemes that launch many seemingly legitimate TCP connections with spoofed IP addresses and port numbers. Finally, our extensive evaluation results across two large commercial backbone networks, using both distributed and targeted attack scenarios, show that up to 95.5% of the network could suffer collateral damage without protection, but our solution was able to significantly reduce the amount of collateral damage by up to 97.58% in terms of the number of packets dropped and 90.36% in terms of the number of flows with packet loss. Furthermore, we show that PSP can maintain low packet loss rates even when the intensity of attacks is increased significantly.

1  Introduction

A coordinated attack can potentially disable a network by flooding it with traffic. Such attacks are also known as bandwidth-based distributed denial-of-service (DDoS) attacks and are the focus of our work. Depending on the operator, the provider network may be a small-to-medium regional network or a large core network. For small-to-medium size regional networks, this type of bandwidth-based attacks has certainly disrupted service in the past. For core networks with huge capacities, one might argue that such an attack risk is remote. However, as reported in the media [6], large botnets already exist in the Internet today. These large botnets combined with the prevalence of high speed Internet access can quite easily give attackers multiple tens of Gb/s of attack capacity. Moreover, core networks are oversubscribed. For example, in the Abilene network [1], some of the core routers have an incoming capacity of larger than 30 Gb/s from the access networks, but only 20 Gb/s of outgoing capacity to the core. Although commercial ISPs do not publish their oversubscription levels, they are generally substantially higher than the ones found in the Abilene network due to commercial pressures of maximizing return on investments.
Considering these insights, one might wonder why we have not seen multiple successful bandwidth-based attacks to large core networks in the past. The answer to this question is difficult to assess. Partially, attacks might not be occurring because the organizations which control the botnets are interested in making money by distributing SPAM, committing click frauds, or extorting money from mid-sized websites. Therefore, they would have no commercial interest in disrupting the Internet as a whole. Another reason might be that network operators are closely monitoring their traffic and actively trying to intervene. Nonetheless, recent history has shown that if such an attack possibility exists, it will eventually be exploited. For example, SYN flooding attacks were described in [3] years before such attacks were used to disrupt servers in the Internet.
To defend against large bandwidth-based DDoS attacks, a number of defense mechanisms currently exist, but many are reactive in nature (i.e., they can only respond after an attack has been identified in an effort to limit the damage). However, the onset of large-scale bandwidth-based attacks can occur almost instantaneously, causing potentially a huge surge in traffic that can effectively knock out substantial parts of a network before reactive defense mechanisms have a chance to respond. To provide a broad first line of defense against DDoS attacks when they happen, we propose a new protection mechanism called Proactive Surge Protection (PSP). In particular, under a flooding attack, traffic loads along attack routes will exceed link capacities, causing packets to be dropped indiscriminately. Without proactive protection, even for traffic flows that are not under direct attack, substantial packet loss will occur if these flows pass through links that are common to attack routes, resulting in significant collateral damage. The PSP solution is based on providing bandwidth isolation between traffic flows so that the collateral damage to traffic flows not under direct attack is substantially reduced.
This bandwidth isolation is achieved through a combination of traffic data collection, bandwidth allocation of network capacity based on traffic measurements, metering and tagging of packets at the network perimeter into two differentiated priority classes based on capacity allocation, and preferential dropping of packets in the network when link capacities are exceeded. It is important to note that PSP has no impact on the regular operation of the network if no link is overloaded. It therefore introduces no penalty in the common case. In addition, PSP is deployable using existing router mechanisms that are already available in modern routers, which makes our approach scalable, feasible, and cost effective. Further, PSP is resilient to IP spoofing as well as changes in the underlying traffic characteristics such as the number of TCP connections. This is due to the fact that we focus on protecting traffic between different ingress-egress interface pairs in a provider network and both the ingress and egress interface of an IP datagram can be directly determined by the network operator. Therefore, the network operator does not have to rely on unauthenticated information such as a source or destination IP address to tag a packet.
In particular, we have significantly extended our previous algorithm for bandwidth allocation to take into consideration the traffic variability observed in historical traffic measurements.
The work presented in this paper substantially extends a preliminary version of our work that was initially presented at a workshop [10]. In particular, we propose a new bandwidth allocation algorithm called CDF-PSP that takes into consideration the traffic variability observed in historical traffic measurements. CDF-PSP aims to maximize in a max-min fair manner the acceptance probability (or equivalently the min-max minimization of the drop probability) of packets by using the cumulative distribution function over historical data sets as the objective function. By taking into consideration the traffic variability, we show that the effectiveness of our protection mechanism can be significantly improved. In addition, we have also substantially extended our preliminary work with much more extensive in-depth evaluation of our proposed PSP mechanism using detailed trace-driven simulations.
To test the robustness of our proposed approach, we evaluated the PSP mechanism using both highly distributed attack scenarios involving a high percentage of ingress and egress routers, as well as targeted attack scenarios in which the attacks are concentrated to a small number of egress destinations. Our extensive evaluations across two large commercial backbone networks show that up to 95.5% of the network could suffer collateral damage without protection, and our solution was able to significantly reduce the amount of collateral damage by up to 97.58% in terms of the number of packets dropped and up to 90.36% in terms of the number of flows with packet loss.
In comparison to our preliminary work, the performance of our new algorithm was able to achieve a relative reduction of up to 53.09% in terms of the number of packets dropped and up to 59.30% in terms of the number of flows with packet loss. In addition, we show that PSP can maintain low packet loss rates even when the intensity of attacks is increased significantly. Beyond evaluating extensively the impact of our protection scheme on packet drops, we also present detailed analysis on the impact of our scheme at the level of flow aggregates between individual ingress-egress interface pairs in the network.
The rest of this paper is organized as follows. Section II outlines related work. Section III presents a high-level overview of our proposed PSP approach. Section IV describes in greater details the central component of our proposed architecture that deals with bandwidth allocation policies. Section V describes our experimental setup, and Section VI presents extensive evaluation of our proposed solutions across two large backbone networks. Section VII concludes the paper.

2  Related Work

DDoS protection has received considerable attention in the literature. The oldest approach, still heavily in use today, is typically based on coarse-grain traffic anomalies detection [21,2]. Traceback techniques [32,27,28] are then used to identify the true attack source, which could be disguised by IP spoofing. After detecting the true source of the DDoS traffic the network operator can block the DDoS traffic on its ingress interfaces by configuring access control lists or by using DDoS scrubbing devices such as [4]. Although these approaches are practical, they do not allow for an instantaneous protection of the network. As implemented today, theses approaches require multiple minutes to detect and mitigate DDoS attacks, which does not match the time sensitivity of today's applications. Similarly, network management mechanisms that generally aim to find alternate routes around congested links also do not operate on a time scale that matches the time sensitivity of today's applications.
More recently, the research community has focused on enhancing the current Internet protocol and routing implementations. For example, multiple proposals have suggested to limit the best effort connectivity of the network using techniques such as capabilities models [24,33], proof-of-work schemes [19], filtering schemes [20] or default-off communication models [7]. The main focus of these papers is the protection of customers connecting to the core network rather than protecting the core itself, which is the focus of our work. To illustrate the difference, consider a scenario in which an attacker controls a large number of zombies. These zombies could communicate with each other, granting each other capabilities or similar rights to communicate. If planned properly, this traffic is still sufficient to attack a core network. The root of the problem is that the core cannot trust either the sender or the receiver of the traffic to protect itself.
Several proactive solutions have been proposed. One solution was presented in [30]. Similar to the proposals limiting connectivity cited above, it focuses on protecting individual customers. This leads again to a trust issue in that a service provider should not trust its customers for protection. Furthermore, their solution relies heavily on the operator and customers knowing a priori who are the good and bad network entities, and their solution has a scalability issue in that it is not scalable to maintain detailed per-customer state for all customers within the network. Router-based defense mechanisms have also been proposed as a way to mitigate bandwidth-based attacks. They generally operate either on traffic aggregates [17] or on individual flows [22]. However, as shown in [31], these router-based mechanisms can be defeated in several ways. Moreover, deploying router-based defense mechanisms like pushback at every router can be challenging.
Our work builds on the existing body of literature on max-min fair resource allocation [8,29,16,9,25,26,23] to the problem of proactive DDoS defense. However, our work here is different in that we use max-min fair allocation for the purpose of differential tagging of packets with the objective of minimizing collateral damage when a DDoS attack occurs. Our work here is also different than the server-centric DDoS defense mechanism proposed in [34], which is aimed at protecting end-hosts rather than the network. In their solution, a server explicitly negotiates with selected upstream routers to throttle traffic destined to it. Max-min fairness is applied to set the throttling rates of these selected upstream routers. Like [30] discussed above, their solution also has a scalability issue in that the selected upstream routers must maintain per-customer state for the requested rate limits.
Finally, our work also builds on existing preferential dropping mechanisms that have been developed for providing Quality-of-Service (QoS) [11,13]. However, for providing QoS, the service-level-agreements that dictate the bandwidth allocation are assumed to be either specified by customers or decided by the operator for the purpose of traffic engineering. There is also a body of work on measurement-based admission control for determining whether or not to admit new traffic into the network, e.g. [15,18]. With both service-level-agreement-based and admission-control-based bandwidth reservation schemes, rate limits are enforced. Our work here is different in that we use preferential dropping for a different purpose to provide bandwidth isolation between traffic flows to minimize the damage that attack traffic can cause to regular traffic. Our solution is based on a combination of traffic measurements, fair bandwidth allocation, soft admission control at the network perimeter, and lazy dropping of traffic inside the network only when needed. As the mechanisms of differential tagging and preferential dropping are already available in modern routers, our solution is readily deployable.

3  Proactive Surge Protection

Figure 1:Attack scenario on the Abilene network.
(a)Attack along Chicago/NY (b)Shielded Sunnyvale/NY and Denver/NY traffic from collateral damage
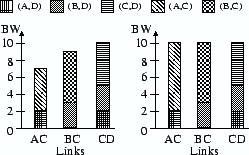
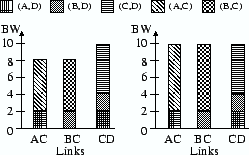
Figure 2:Proactive Surge Protection (PSP) architecture.
In this section, we present a high-level architectural overview of a DDoS defense solution called Proactive Surge Protection (PSP). To illustrate the basic concept, we will depict an example scenario for the Abilene network. That network consists of 11 core routers that are interconnected by OC192 (10 Gb/s) links. For the purpose of depiction, we will zoom in on a portion of the Abilene network, as shown in Figure 1(a). Consider a simple illustrative situation in which there is a sudden bandwidth-based attack along the origin-destination (OD) pair Chicago/NY, where an OD pair is defined to be the corresponding pair of ingress and egress nodes. Suppose that the magnitude of the attack traffic is 10 Gb/s. This attack traffic, when combined with the regular traffic for the OD pairs Sunnyvale/NY and Denver/NY (3 + 3 + 10 = 16 Gb/s), will significantly oversubscribe the 10 Gb/s Chicago/NY link, resulting in a high percentage of indiscriminate packet drops. Although the OD pairs Sunnyvale/NY and Denver/NY are not under direct attack, these flows will also suffer substantial packet loss on links which they share with the attack OD pair, resulting in significant collateral damage. The flows between Sunnyvale/NY and Denver/NY are said to be caught in the crossfire of the Chicago/NY attack.

3.1  PSP Approach

The PSP approach is based on providing bandwidth isolation between different traffic flows so that the amount of collateral damage sustained along crossfire traffic flows is minimized. This bandwidth isolation is achieved by using a form of soft admission control at the perimeter of a provider network. In particular, to avoid saturation of network links, we impose rate limits on the amount of traffic that gets injected into the network for each OD pair. However, rather than imposing a hard rate limit, where packets are blocked from entering the network, we classify packets into two priority classes, high and low. Metering is performed at the perimeter of the network, and packets are tagged high if the arrival rate is below a certain threshold. But when a certain threshold is exceeded, packets will get tagged as low priority. Then, when a network link gets saturated, e.g. when an attack occurs, packets tagged with a low priority will be dropped preferentially. This ensures that our solution does not drop traffic unless a network link capacity has indeed been exceeded. Under normal network conditions, in the absence of sustained congestion, packets will get forwarded in the same manner as without our solution.
Consider again the above example, now depicted in Figure 1(b). Suppose we set the high priority rate limit for the OD pairs Sunnyvale/NY, Denver/NY, and Chicago/NY to 3.5 Gb/s, 3.5 Gb/s, and 3 Gb/s, respectively. This will ensure that the total traffic admitted as high priority on the Chicago/NY link is limited to 10 Gb/s. Operators can also set maximum rate limits to some factor below the link capacity to provide the desired headroom (e.g. set the target link load to be 90%). If the limit set for a particular OD pair is above the actual amount of traffic along that flow, then all packets for that flow will get tagged as high priority. Consider the OD pair Chicago/NY. Suppose the actual traffic under an attack is 10 Gb/s, which is above the 3 Gb/s limit. Then, only 3 Gb/s of traffic will get tagged as high priority, and 7 Gb/s will get tagged as low priority. Since the total demand on the Chicago link exceeds the 10 Gb/s link capacity, considerable packets would get dropped. However, the packets drop will come from the OD pair Chicago/NY since all packets from Sunnyvale/NY and Denver/NY would have been tagged as high priority. Therefore, the packets for the OD pairs Sunnyvale/NY and Denver/NY would be shielded from collateral damage.
Although our simple illustrative example shown in Figure 1 only involved one attack flow from one ingress point, the attack traffic in general can be highly distributed. As we shall see in Section VI, the proposed PSP method is also quite effective in such distributed attack scenarios.

3.2  PSP Architecture

Our proposed PSP architecture is depicted in Figure 2. The architecture is divided into a policy plane and an enforcement plane. The traffic data collection and bandwidth allocation components are on the policy plane, and the differential tagging and preferential drop components are on the enforcement plane.
Traffic Data Collector: The role of the traffic data collection component is to collect and summarize historical traffic measurements. For example, the widely deployed Cisco sampled NetFlow mechanism can be used in conjunction with measurement methodologies such that those outlined in [14] to collect and derive traffic matrices for different times throughout a day, a week, a month, etc, between different origin-destination (OD) pairs of ingress-egress nodes. The infrastructure for this traffic data collection already exists in most service provider networks. The derived traffic matrices are used to estimate the range of expected traffic demands for different time periods.
Bandwidth Allocator: Given the historical traffic data collected, the role of the bandwidth allocator is to determine the rate limits at different time periods. For each time period t, the bandwidth allocator will determine a bandwidth allocation matrix, B(t) = [   bs,d(t)   ], where bs,d(t) is the rate limit for the corresponding OD pair with ingress node s and egress node d for a particular time of day t. For example, a different bandwidth allocation matrix B(t) may be computed for each hour in a day using the historical traffic data collected for same hour of the day. Under normal operating conditions, network links are typically underutilized. Therefore, traffic demands from historical measurements will reflect this underutilization. Since there is likely to be room for admitting more traffic into the high priority class than observed in the historical measurements, we can fully allocate in some fair manner the available network resources to high priority traffic. By fully allocating the available network resources beyond the previously observed traffic, we can provide headroom to account for estimation inaccuracies and traffic burstiness. The bandwidth allocation matrices can be computed offline, and operators can remotely configure routers at the network perimeter with these matrices using existing router configuration mechanisms.
Differentiated Tagging: Given the rate limits determined by the bandwidth allocator, the role of the differential tagging component is to perform the metering and tagging of packets in accordance to the determined rate limits. This component is implemented at the perimeter of the network. In particular, packets arriving at ingress node s and destined to egress node d are tagged as high priority if their metered rates are below the threshold given by bs,d(t), using the bandwidth allocation matrix B(t) for the corresponding time of day. Otherwise, they are tagged as low priority. These traffic management mechanisms for metering and tagging are commonly available in modern routers at linespeeds.
Preferential Drops: With packets tagged at the perimeter, low priority packets can be dropped preferentially over high priority packets at a network router whenever a sustained congestion occurs. Again, this preferential dropping mechanism [11] is commonly available in modern routers at linespeeds. By using preferential drop at interior routers rather than simply blocking packets at the perimeter when a rate limit has been reached, our solution ensures that no packet gets dropped unless a network link capacity has indeed been exceeded. Under normal network conditions, in the absence of sustained congestion, packets will get forwarded in the same manner as without our surge protection scheme.

4  Bandwidth Allocation Policies

Intuitively, PSP works by fully allocating the available network resources into the high priority class in some fair manner so that the high priority class rate limits for the different OD pairs are at least as high as the expected normal traffic. This way, should a DDoS attack occur that would saturate links along the attack route, normal traffic corresponding to crossfire OD pairs would be isolated from the attack traffic, thus minimizing collateral damage. In particular, packets for a particular crossfire OD pair would only be dropped at a congested network link if the actual normal traffic for that flow is above the bandwidth allocation threshold given to it. Therefore, bandwidth allocation plays a central role in affecting the drop probability of normal crossfire traffic during an attack. As such, the goal of bandwidth allocation is to allocate the available network resources with the objective of minimizing the drop probabilities for all OD pairs in some fair manner.

4.1  Formulation

To achieve the objectives of minimizing drop probability and ensuring fair allocation of network resources, we formulate the bandwidth allocation problem as a utility max-min fair allocation problem [8,9,26,23]. The utility max-min fair allocation problem can be stated as follows. Let [x\vec] = (x1, x2, ¼, xN) be the allocation to N flows, and let (b1(x1), b2(x2), ¼, bN(xN)) be N utility functions, with each bi(xi) corresponding to the utility function for flow i. An allocation [x\vec] is said to be utility max-min fair if and only if increasing one component xi must be at the expense of decreasing some other component xj such that bj(xj) £ bi(xi).
Conventionally, the literature on max-min fair allocation uses the vector notation [x\vec](t) = (x1(t), x2(t), ¼, xN(t)) to represent the allocation for some time period t. The correspondence to our bandwidth allocation matrix B(t) = [   bs,d(t)   ] is straightforward: bsi,di(t) = xi(t) is the bandwidth allocation at time t for flow i, with the corresponding OD pair of ingress and egress nodes (si, di). Unless otherwise clarified, we will use the conventional vector notation [x\vec](t) = (x1(t), x2(t), ¼, xN(t)) and our bandwidth allocation matrix notation interchangeably.
The utility max-min fair allocation problem has been well-studied, and as shown in [9,26], the problem can be solved by means of a "water-filling" algorithm. We briefly outline here how the algorithm works. The basic idea is to iteratively calculate the utility max-min fair share for each flow in the network. Initially, all flows are allocated rate xi = 0 and are considered free, meaning that its rate can be further increased. At each iteration, the water-filling algorithm aims to find largest increase in bandwidth allocation to free flows that will result in the maximum common utility with the available link capacities. The provided utility functions, (b1(x1),b2(x2), ¼, bN(xN)), are used to determine this maximum common utility. When a link is saturated, it is removed from further consideration, and the corresponding flows that cross these saturated links are fixed from further increase in bandwidth allocation. The algorithm converges after at most L iterations, where L is the number of links in the network, since at least one new link becomes saturated in each iteration. The reader is referred to [9,26] for detailed discussions.
In the context of PSP, the utility max-min fair algorithm is used to implement different bandwidth allocation policies. In particular, we describe in this section two bandwidth allocation policies, one called Mean-PSP, and the other called CDF-PSP. Both are based on traffic data collected from historical traffic measurements. The first policy, Mean-PSP, simply uses the average historical traffic demands observed as weights in the corresponding utility functions. Mean-PSP is based on the simple intuition that flows with higher average traffic demands should receive proportionally higher bandwidth allocation. This policy was first presented in our preliminary work [10]. However, this policy does not directly consider the traffic variance observed in the traffic measurements.
To directly account for traffic variance, we propose a second policy, CDF-PSP, that explicitly aims to minimize drop probabilities by using the Cumulative Distribution Functions (CDFs) [8] derived from the empirical distribution of traffic demands observed in the traffic measurements. These CDFs can be used to capture the probability that the actual traffic will not exceed a particular bandwidth allocation. When these CDFs are used as utility functions, maximizing the utility corresponds directly to the minimization of drop probabilities. Each of these two policies is further illustrated next.

4.2  Mean-PSP: Mean-based Max-min Fairness

Our first allocation policy, Mean-PSP, simply uses the mean traffic demand as the utility function. In particular, the utility function for flow i is a simple linear function bi(x) = [x/(mi)], where mi is the mean traffic demand of flow i, which simplifies to an easier weighted max-min fair allocation problem.
(a) 1st iteration(b) 2nd iteration (a) 1st iteration(b) 2nd iteration
Figure 3:Network. Figure 4:Mean-PSP water-filling illustrated. Figure 5:CDF-PSP water-filling illustrated.

Table 1:Traffic demands and the corresponding bandwidth allocations for Mean-PSP and CDF-PSP.
Flows Historical traffic measurements BW allocation
Measured demands (sorted)Mean Mean-PSP CDF-PSP
1st 2nd 1st 2nd
(A,D)1 1 2 2 4 2 2 2 2 2
(B,D)1 1 1 3 4 2 2 2 3 3
(C,D)4 5 5 5 11 6 6 6 5 5
(A,C)4 5 5 5 11 6 6 8 5 8
(B,C)5 5 6 6 8 6 6 8 6 7
To illustrate how Mean-PSP works, consider the small example shown in Figure 3. It depicts a simple network topology with 4 nodes that are interconnected by 10 Gb/s links. Consider the corresponding traffic measurements shown in Table I. For simplicity of illustration, each flow is described by just 5 data points, and the corresponding mean traffic demands are also indicated in Table I. Consider the first iteration of the Mean-PSP water-filling procedure shown in Figure 4(a). The maximum common utility that can be achieved by all free flows is b(x) = 1, which corresponds to allocating 2 Gb/s each to the OD pairs (A, D) and (B, D) and 6 Gb/s each to the OD pairs (C, D), (A, C), and (B, C). For example, bA,D(x) = [x/(m)] = 1 corresponds to allocating x = 2 Gb/s since m for (A,D) is 2. Since all three flows, (A, D), (B, D), and (C, D), share a common link CD, the sum of their first iteration allocation, 2 + 2 + 6 = 10 Gb/s, would already saturate link CD. This saturated link is removed from consideration in subsequent iterations, and the flows (A, D), (B, D), and (C, D) are fixed at the allocation of 2 Gb/s, 2 Gb/s, and 6 Gb/s, respectively.
On the other hand, link AC is only shared by flows (A, C) and (A, D), which has an aggregate allocation of 2 + 6 = 8 Gb/s on link AC after the first iteration. This leaves 10 - 8 = 2 Gb/s of residual capacity for the next iteration. Similarly, link BC is only shared by flows (B, C) and (B, D), which also has an aggregate allocation of 2 + 6 = 8 Gb/s on link BC after the first iteration, with 2 Gb/s of residual capacity. After the first iteration, flows (A, C) and (B, C) remain free.
In the second iteration, as in shown Figure 4(b), the maximum common utility is achieved by allocating the remaining 2 Gb/s on link AC to flow (A, C) and the remaining 2 Gb/s on link BC to flow (B, C), resulting in each flow having 8 Gb/s allocated to it in total. The final Mean-PSP bandwidth allocation is shown in Table I.

4.3  CDF-PSP: CDF-based Max-min Fairness


Figure 6: Empirical CDFs for flows (A, D), (B, D), (C, D), (A, C), (B, C).

Our second allocation policy, CDF-PSP, aims to explicitly capture the traffic variance observed in historical traffic measurements by using a Cumulative Distribution Function (CDF) model as the utility function. In particular, the use of CDFs [8] captures the acceptance probability of a particular bandwidth allocation as follows. Let Xi(t) be a random variable that represents the actual normal traffic for flow i at time t, and let xi(t) be the bandwidth allocation. Then the CDF of Xi(t) is denoted as
Pr[Xi(t) £ xi(t)] = Fi,t(xi(t)),
and the drop probability is simply the complementary function
Pr[Xi(t) > xi(t)] = 1 - Fi,t(xi(t)).
Therefore, when CDFs are used to maximize the acceptance probabilities for all flows in a max-min fair manner, it is equivalent to minimizing the drop probabilities for all flows in a min-max fair manner.
In general, the expected traffic can be modeled using different probability density functions with the corresponding CDFs. One probability density function is to use the empirical distribution that directly corresponds to the historical traffic measurements taken. In particular, let ( ri,1(t), ri,2(t), ¼, ri,M(t) ) be M measurements taken for flow i at a particular time of day t over some historical data set. Then the empirical CDF is simply defined as
Fi,t(xi(t)) = # measurements £ xi(t)

M

= 1

M
= M
å
k=1 
I(ri,k(t) £ xi(t)),
where I(ri,k(t) £ xi(t)) is the indicator that the measurement ri,k(t) is less than or equal to xi(t). For the example shown in Table I, the corresponding empirical CDFs are shown in Figure 6. For example in Figure 6(a) for OD pair (A, D), a bandwidth allocation of 2 Gb/s would correspond to an acceptance probability of 80% (with the corresponding drop probability of 20%).
To illustrate how CDF-PSP works, consider again the example shown in Figure 3 and Table I. Consider the first iteration of the CDF-PSP water-filling procedure shown in Figure 5(a). To simplify notation, we will simply use for example bA,D(x) = FA,D(x) to indicate the utility function for flow (A, D) for some time period t, and we will use analogous notations for the other flows.
In the first iteration, the maximum common utility that can be achieved by all free flows is an acceptance probability of b(x) = 80%, which corresponds to allocating 2 Gb/s to (A, D), 3 Gb/s to (B, D), 5 Gb/s each to (C, D) and (A, C), and 6 Gb/s to (B, C). This first iteration allocation is shown in bold black lines in Figure 6. With this allocation in the first iteration, link CD is again saturated since the sum of the first iteration allocation to flows (A, D), (B, D), and (C, D) is 2 + 3 + 5 = 10 Gb/s, which would already reach the link capacity of CD. Therefore, the saturated link CD is removed from consideration in subsequent iterations, and the flows (A, D), (B, D), and (C, D) are fixed at the allocation of 2 Gb/s, 3 Gb/s, and 5 Gb/s, respectively.
For link AC, which is shared by flows (A, C) and (A, D), the first iteration allocation is 2 + 5 = 7 Gb/s, leaving 10 - 7 = 3 Gb/s of residual capacity. Similarly, for link BC, which is shared by flows (B, C) and (B, D), the first iteration allocation is 3 + 6 = 9 Gb/s, leaving 10 - 9 = 1 Gb/s of residual capacity.
In the second iteration, as in shown Figure 5(b), the maximum common utility 90% is achieved for the remaining free flows (A, C) and (B, C) by allocating the remaining 3 Gb/s on link AC to flow (A, C) and the remaining 1 Gb/s on link BC to flow (B, C), resulting in a total of 8 Gb/s allocated to (A, C) and 7 Gb/s allocated to (B, C). This second iteration allocation is shown in dotted lines in Figure 6. The final CDF-PSP bandwidth allocation is shown in Table I.
Comparing the results for CDF-PSP and Mean-PSP shown in Figure 6 and Table I, we see that CDF-PSP was able to achieve a higher worst-case acceptance probability for all flows than Mean-PSP. In particular, the CDF-PSP results shown in Figure 6 and Table I show that CDF-PSP was able to achieve a minimum acceptance probability of 80% for all flows whereas Mean-PSP was only able to achieve a lower worst-case acceptance probability of 70%. For example, for flow (B, D), the bandwidth allocation of 3 Gb/s determined by CDF-PSP corresponds to an 80% acceptance rate whereas the 2 Gb/s determined by Mean-PSP only corresponds to a 70% acceptance rate. The better worst-case result is because CDF-PSP specifically targets the max-min optimization of the acceptance probability by using the cumulative distribution function as the objective.
Comparing the results of CDF-PSP and Mean-PSP shown in Table I, we found the allocations of both algorithm are similar in our example because of the limited number of flows and links. However, under CDF-PSP, all flows have at least 80% acceptance probability, and both flows (B, D) and (C, D) have 80% acceptance probability. On the other hand, under Mean-PSP, flow (B, D) only receives 70% acceptance rate, while flow (C, D) gets about 84% acceptance rate. The difference between flows would greatly increase as higher diversity among flow demand distributions and more flows sharing the same critical links. This is because under those circumstances, the demand distribution plays greater role on deciding allocation among flows.

5  Experimental Setup

We employed ns-2 based simulations to evaluate our PSP methods on two large real networks.
US: This is the backbone of a large service provider in the US, and consists of around 700 routers and thousands of links ranging from T1 to OC768 speeds.
EU: This is the backbone of a large service provider in Europe. It has a similar network structure as the US backbone, but it is larger with about 150 more routers and 500 more links.
While the results for the individual networks cannot be directly compared to each other because of differences in their network characteristics and traffic behavior, multiple network environments allow us to explore and understand the performance of our PSP methods for a range of diverse scenarios.

5.1  Normal Traffic Demand

For each network, using the methods outlined in [14], we build ingress router to egress router traffic matrices from several weeks worth of sampled Netflow data that record the traffic for that network : US (07/01/07-09/03/07) and EU (11/18/06-12/18/06 & 07/01/07-09/03/07). Specifically, the Netflow data contains sampled Netflow records covering the entire network. The sampling is performed on the routers with 1:500 packet sampling rate. The volume of sampled records are then subsequently reduced using a smart sampling technique [12]. The total size of smart sampled data records was 3,600 GB and 1,500 GB for US and EU, respectively. Finally, we annotate each record with its customer egress interface (if it was not collected on the egress router) based on route information.
For each time interval t, the corresponding OD flows are represented by a N ×N traffic matrix where N is the number of access routers providing ingress or egress to the backbone, and each entry contains the average demand between the corresponding routers within that interval. The above traffic data are used both for creating the normal traffic demand for the simulator as well as for computing the corresponding bandwidth allocation matrices for the candidate PSP techniques. One desirable characteristic from a network management, operations and system overhead perspective is to avoid too many unnecessary fine time scale changes. Therefore, one goal of our study was to evaluate the effectiveness of using a single representative bandwidth allocation matrix for an extended period of time. An implicit hypothesis is that the bandwidth allocation matrix does not need to be computed and updated on a fine timescale. To this end, in the simulations, we use a finer timescale traffic matrix with t = 1 min for determining the normal traffic demand, and a coarser timescale 1 hour interval for computing the bandwidth allocation matrix from historical data sets.

5.2  DDoS Attack Traffic

To test the robustness of our PSP approach, we used two different types of attack scenarios for evaluation - a distributed attack scenario for the US backbone and a targeted attack scenario for the EU backbone. As we shall see in Section VI, PSP is very effective in both types of attacks. In particular, we used the following attack data.
US DDoS: For the US backbone, the attack matrix that we used for evaluation is based on large DDoS alarms that were actually generated by a commercial DDoS detection system deployed at key locations in the network. In particular, among the actual large DDoS alarms there were generated during the period of 6/1/05 to 7/1/06, we selected the largest one involving the most number of attack flows as the attack matrix. This was a highly distributed attack involving 40% (nearly half) of the ingress routers as attack sources and 25% of the egress routers as attack destinations. The number of attack flows observed at a single ingress router were up to 150 flows, with an average of about 24 attack flows sourced at each ingress router. The attacks were distributed over a large number of egress routers. Although the actual attacks were large enough to trigger the DDoS alarms, they did not actually cause overloading on any backbone link. Therefore, we scaled up each attack flow to an average of 1% of the ingress router link access capacity. Since there were many flows, this was already sufficient to cause overloading on the network.
EU DDoS: For the Europe backbone, we had no commercial DDoS detection logs available. Therefore, we created our own synthetic DDoS attack data. To evaluate PSP under different attack scenarios, we created a targeted attack scenario in which all attack flows are targeted to only a small number of egress routers. In particular, to mimic the US DDoS attack data, we randomly selected 40% of ingress routers to be attack sources. However, to create a targeted attack scenario, we purposely selected at random only 2% of the egress routers as attack destinations. With only 2% of the egress routers involved as attack destinations, we concentrated the attacks from each ingress router to just 1-3 destinations with demand set at 10% of the ingress router link access capacity.
be the victims. For each selected victim, 2% of the access routers are randomly chosen as the attackers. Then for each attack OD flow, its demand is 10% of the total access capacity on the corresponding ingress router. The resulting attack scenario consists of attack flows along only 0.1% of the OD pairs. This is in accordance with the very limited distributed nature of DDoS attacks in a core network as discovered by an earlier study [].

5.3  ns-2 Simulation Details

Our experiments are implemented using ns-2 simulations. This involved implementing the 2-class bandwidth allocation, and simulating both the normal and DDoS traffic flows.
Bandwidth Allocation and Enforcement: The metering and class differentiation of packets are implemented at the perimeter of each network using the differentiated service module in ns-2, which allows users to set rate limits for each individual OD pair. Our simulation updates the rate limits hourly by pre-computing the bandwidth allocation matrix based on the historical traffic matrices that were collected several weeks prior to the attack date: US (07/01/07-09/02/07) and EU (11/18/06-12/17/06 & 07/01/07-09/02/07).
The differentiated service module marks incoming packets into different priorities based on the configured rate limits set by our bandwidth allocation matrix and the estimated incoming traffic rate of the OD pair. Specifically, we implemented differentiated service using TSW2CM (Time Sliding Window with 2 Color Marking), an ns-2 provided policer. As its name implies, the TSW2CM policer uses a sliding time window to estimate the traffic rate.
If the estimated traffic exceeds the given threshold, the incoming packet is marked into the low priority class; otherwise, it is marked into the high priority class. We then use existing preferential dropping mechanisms to ensure that lower priority packets are preferentially dropped over higher priority packets when memory buffers get full. In particular, WRED/RIO1 is one such preferential dropping mechanism that is widely deployed in existing commercial routers [11,5]. We used this WRED/RIO mechanism in our ns-2 simulations.
\lhd When a queue gets full, the classified packets are then be dropped preferentially by the ns-2 queue management module WRED/RIO [11] which is commonly available in modern routers. \rhd
We then use existing preferential dropping mechanisms to ensure that high priority packets are always forwarded ahead of low priority packets. Strict priority queuing [11] is commonly available in modern routers where lower priority packets are preferentially dropped over higher priority packets when memory buffers get full. In our ns-2 simulation, the strict priority queuing is simulated by storing the packet of two classes in separate logical queues on routers. The two logical queues are scheduled with priority queuing such that packets in the low priority queue are only forwarded when the high priority queue is empty. The packets are dropped when the queue is full. We configure the drop policy of two virtual queues by RED [], such that the high priority packets are only dropped when the physical is full, while the low priority packets are early dropped proportional to the physical queue length.
Traffic Simulation: For simulation data (testing phase), we purposely used a different data set than the traffic matrices used for bandwidth allocation (learning phase). In particular, for each network, we selected a week-day outside of the days used for bandwidth allocation, and we considered 48 1-minute time intervals (one every 30-minutes) across the entire 24 hours of this selected day. The exact date that we selected to simulate normal traffic is 09/03/07 for both the US and EU networks. Recall that for a given time interval t, we compute normal and DDoS traffic matrices that give average traffic rates across that interval. These matrices are used to generate the traffic flows for that time interval. Both DDoS and network traffic are simulated as constant bandwidth UDP streams with fixed packet sizes of 1 kB.

6  Experimental Results

We begin our evaluations in Section VI-A by quantifying the potential extent and severity of the problem that we are trying to address - the amount of collateral damage in each network in the absence of any protection mechanism. We then develop an understanding of the damage mitigation capabilities and properties of our PSP mechanism, first at the network level in Section VI-B and then at the individual OD-pair level in Section VI-C. Section VI-D explores the effectiveness of the proposed schemes under scaled attacks, and Section VI-E summarizes all the results.
We shall use the term No-PSP to refer to the baseline scenario with no surge protection. We use the terms Mean-PSP and CDF-PSP to refer to the PSP schemes that use proportional and empirical CDF-based water-filling bandwidth allocation algorithms respectively. Recall that an OD pair is considered as (i) an attacked OD pair if there is attack traffic along that pair, (ii) a crossfire OD pair if it shares at least one link with an OD pair containing attack traffic, and (iii) a non-crossfire OD pair if it is neither an attacked nor a crossfire OD pair.

6.1  Potential for Collateral Damage

 
We first explore the extent to which OD pairs and their offered traffic demands are placed in potential harm's way because they share network path segments with a given set of attack flows. In Figure 7, we report the relative proportion of OD pairs in the categories of attacked, crossfire, and non-crossfire OD pairs for both the US and EU backbones.
As described in Section V-B, 40% of the ingress routers and 25% of the egress routers were involved in the DDoS attack on the US backbone. In general, for a network with N ingress/egress routers, there are N2 possible OD pairs (the ratio of routers to OD pairs is 1-to-N). For the US backbone, with about 700 routers, there are nearly half a million OD pairs. Although 40% of the ingress routers and 25% of the egress routers were involved in the attack, the number of attack destinations from each ingress router was on average about 24 egress routers, resulting in just 1.2% of the OD pairs under direct attack. In general, because the number of OD pairs grows quadratically with N (i.e. N2), even in a highly distributed attack scenario where the attack flows come from all N routers, the number of OD pairs under direct attack may still only correspond to a small percentage of OD pairs. For the EU backbone, there are about 850 routers and about three quarters of million OD pairs. For the targeted attack scenario described in Section V-B, 40% of the ingress routers were also involved in the DDoS attack, but the attacks were concentrated to just 2% of the egress routers. Again, even though 40% of the ingress routers were involved, only 0.1% of the OD pairs, among N2 OD pairs, were under direct attack.
In general, the percentage of OD pairs that are in the crossfire of attack flows depends on where the attacks occurred and how traffic is routed over a particular network. For the US backbone, we observe that the percentage of crossfire OD pairs is very large (95.5%), causing substantial collateral damage even though the attacks were directed over only 1.2% the OD pairs. This is somewhat expected given the distributed nature of the attack where a high percentage of both ingress and egress routers were involved in the attack. For the EU backbones, the observed percentage of crossfire OD pairs is also very large (83.5%). This is somewhat surprisingly because the attacks were targeted to only a small number of egress routers. This large footprint can be attributed to the fact that even a relatively small number of attack flows can go over common links that were shared by a vast majority of other OD pairs.
(a) US(b) Europe(a) US(b) Europe
Figure 7:The percentage of the number of the three OD pair types classified under an attack traffic. Figure 8:The proportion of normal traffic demand corresponding to the three types of OD pairs.
We next depict the relative proportions of the overall normal traffic demand corresponding to each type of OD pairs. While the classification of the OD pairs into the 3 categories is fixed for a given network and attack matrix, the relative traffic demand for the different classes is time-varying, depending on the actual normal traffic demand in a given time interval. Figure 8 presents a breakdown of the total normal traffic demands for the 3 classes across the 48 time intervals that we explored. Note that for both the networks, crossfire OD pairs account for a significant proportion of the total traffic demand. Figures 7 and  8 together suggest that an attack directed even over a relatively small number of ingress-egress interface combinations, could be routed around the network in a manner that can impact a significant proportion of OD pairs and overall network traffic.
The results above provide us an indication of the potential "worst-case" impact footprint that an attack can unleash, if its strength is sufficiently scaled up. This is because a crossfire OD pair will suffer collateral packet losses only if some link(s) on its path get congested. While the above results do not provide any measure of actual damage impact, they do nevertheless point to the existence of a real potential for widespread collateral damage, and underline the importance and urgency of developing techniques to mitigate and minimize the extent of such damage.
Table 2: Collateral damage in the absence of PSP with the 10th and 90th percentile indicated in the brackets.
Impacted Impacted Mean packet loss rate
OD Pairs(%) Demand(%) of impacted OD pairs(%)
US41.3737.7949.15
[39.64, 42.72][35.16, 39.37][47.62, 50.43]
EU43.1845.3368.11
[38.48, 47.81][38.90, 52.05][65.51, 70.46]
We next consider the actual collateral damage induced by the specified attacks in the absence of any protection scheme. We define a crossfire OD pair to be impacted in a given time interval, if it suffered some packet loss in that interval. Table II presents (i) the total number of, and (ii) traffic demand for the impacted OD pairs as a percentage of the corresponding values for all crossfire OD pairs, and (iii) the mean packet loss rate across the impacted OD pairs. To account for time variability, we present the average value (with the 10th and 90th percentile indicated in the brackets) for the three metrics across the 48 attacked time intervals. Overall, the tables show that not only can the attacks impact a significant proportion of the crossfire OD pairs and network traffic, but that they can cause severe packet drops in many of them. For example, in the EU network, in 90% of the time intervals, (i) at least 39.64% of the cross-fire OD pairs were impacted, and (ii) the average packet loss rate across the impacted OD pairs was 47.62% or more. To put these numbers in proper context, note that TCP, which accounts for the vast majority of traffic today, is known to have severe performance problems once the loss rate exceeds a few single-digit percentage points.

6.2  Network-wide PSP Performance Evaluation

 
We start the evaluation of PSP by focusing on network-wide aggregate performance for crossfire OD pairs and note the consistent substantially lower loss rates under either Mean-PSP or CDF-PSP across the entire day.

6.2.1  Total Packet Loss Rate

 
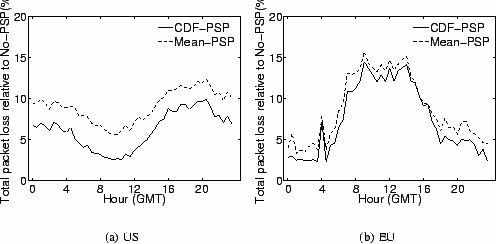
Figure 9:The crossfire OD pair total packet loss rate ratio over No-PSP across 24 hours.(48 attack time intervals, 30 minutes apart).
Table 3:The time-averaged crossfire OD-pair total packet loss rate with the 10th and 90th percentile indicated in the brackets.
No-PSP Mean-PSP CDF-PSP
US17.931.631.11
[16.40, 18.79][1.02, 2.14][0.47, 1.71]
EU30.482.732.32
[27.22, 32.86][1.21, 4.54][0.79, 4.22]
    
Table 4:The time-averaged total packet loss reduction relative to No-PSP or Mean-PSP with the 10th and 90th percentile indicated in the brackets.
Reduction ratio Reduction ratioReduction ratio
from No-PSP from No-PSP from Mean-PSP
to Mean-PSP to CDF-PSP to CDF-PSP
US91.00 93.90 34.75
[88.56, 93.89][90.77, 97.21][20.06, 53.09]
EU91.1792.5119.90
[85.79, 96.17][86.46, 97.58][4.01, 41.58]
For each attack time interval, we compute the total packet loss rate which is the total number of packets lost as a percentage of the total offered load from all crossfire OD pairs. Table III summarizes the mean, 10th and 90th percentile of the total packet loss rates across 48 attack time intervals. The mean loss rates under No-PSP in US and EU networks are 17.93% and 30.48%, respectively. The loss rate is relatively stable across time as indicated by the tight interval between the 10th and 90th percentile numbers. In contrast, the mean loss rate is much smaller, less than 3%, for either PSP scheme. Figure 9 shows the loss rate across time, for the 2 PSP schemes, expressed as a percentage of the corresponding loss rates under No-PSP. Note that even though the attack remains the same over all 48 attack time intervals, the normal traffic demand matrix is time-varying, and hence the observed variability in the time series. In particular, we observe comparatively smaller improvements during the the network traffic peak times, such as 12PM (GMT) in the EU backbone and 6PM (GMT) in the US backbone. This behavior is because the amount of traffic that could be admitted as high priority is bounded by the network's carrying capacity. During high demand time intervals, on one hand, links will be more loaded increasing the likelihood of congestion and overload. On the other hand, more packets will get classified as low priority, increasing the population size that can be dropped under congestion and overload. Table IV summarizes the performance improvements for the PSP schemes in terms of relative loss rate reduction to No-PSP or Mean-PSP across the different time intervals. For each network, on average, either PSP scheme reduces the loss rate in a time interval by more than 90% from the corresponding No-PSP value. In addition CDF-PSP has consistently better performance than Mean-PSP with loss rates that are on average 34.75% and 19.90% lower for the US and EU networks, respectively.
(a) US(b) Europe(a) US(b) Europe
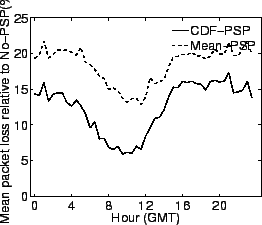
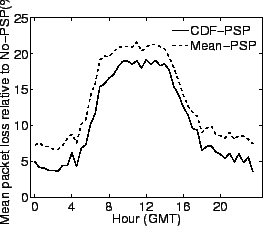
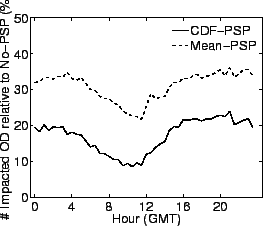
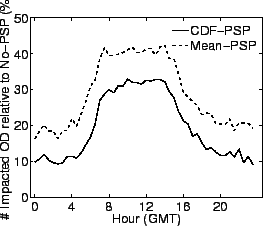
Figure 10:The mean OD packet loss rate ratio over No-PSP across 24 hours.(48 attack time intervals, 30 minutes apart). Figure 11:The ratio of number of crossfire OD-pairs with packet loss over No-PSP across 24 hours.(48 attack time intervals, 30 minutes apart).

6.2.2  Mean OD Packet Loss Rate

 
Our second metric is the mean OD packet loss rate which measures the average packet loss rate across all crossfire OD pairs with non-zero traffic demand. For each of the 48 attack time intervals, for each crossfire OD pair that had traffic demand in that interval, we compute its packet loss rate, ie., the number of packets dropped as a percentage of its total offered load. The mean OD packet loss rate is obtained by averaging across these per-OD pair loss rates for that interval. Table V presents the average, 10th and 90th percentile values for that metric across the 48 time intervals for the different PSP scenarios. Figure 10 shows the time series of the metric for Mean-PSP and CDF-PSP, expressed as a percentage of the corresponding value for No-PSP. The table and the figure clearly show that, across time, No-PSP had consistently much higher mean OD packet loss rate than Mean-PSP and CDF-PSP, while CDF-PSP has the best performance. The percentage improvements are summarized in Table VI, which show that going from No-PSP to CDF-PSP results in a reduction in the mean OD packet loss rate by 87.50% and 89.93% for the US and EU networks, respectively. Moving from Mean-PSP to CDF-PSP reduces this loss rate metric by 33.20% and 25.46% respectively in the two networks.
Table 5:The time-averaged crossfire OD-pair mean packet loss rate. The 10th and 90th percentile number are indicated in the brackets.
No-PSP Mean-PSP CDF-PSP
US20.333.752.56
[19.25, 21.07][2.69, 4.31][1.33, 3.39]
EU29.344.043.23
[26.62, 32.16][2.02, 6.71][1.09, 5.98]
    
Table 6:The time-averaged crossfire OD-pair mean packet loss rate reduction relative to No-PSP and Mean-PSP with the 10th and 90th percentile indicated in the brackets.
Reduction ratio Reduction ratio Reduction ratio
from No-PSP from No-PSP from Mean-PSP
to Mean-PSP to CDF-PSP to CDF-PSP
US81.65 87.50 33.20
[79.27, 86.19][83.88, 93.33][19.65, 52.84]
EU86.6389.39 25.46
[79.01, 92.77][81.15, 95.92][9.83, 44.94]

Table 7:The time-averaged number of impacted OD-pairs with packet loss with the 10th and 90th percentile indicated in the brackets.
No-PSP Mean-PSP CDF-PSP
US41.3712.857.16
[39.06, 42.73][9.58, 14.58][3.94, 9.24]
EU43.1812.818.79
[38.43, 47.94][7.28, 19.70][3.84, 15.46]

    
Table 8:The time-averaged reduction of number of impacted OD-pairs with packet loss relative to No-PSP and Mean-PSP with the 10th and 90th percentile indicated in the brackets.
Reduction ratio Reduction ratio Reduction ratio
from No-PSP from No-PSP from Mean-PSP
to CDF-PSP to CDF-PSP to CDF-PSP
US69.05 82.82 45.47
[65.20, 75.64][78.11, 90.22][35.12, 59.30]
EU71.1880.4234.94
[58.62, 81.49][67.66, 90.36][21.72, 47.60]

6.2.3  Number of impacted crossfire OD pairs

We next determine the number of impacted OD pairs, ie., the crossfire OD pairs that suffer some packet loss at each time interval. It is desirable to minimize this number, since many important network applications including real-time gaming and VOIP are very sensitive to and experience substantial performance degradations even under relatively low packet loss rates. For each of the 48 attack time intervals, we determine the number of impacted crossfire OD pairs as a percentage of the total number of crossfire OD pairs with non-zero traffic demand in that time interval. We summarize the mean and the 10th and 90th percentiles from the distribution of the resulting values across the 48 time intervals in Table VII for No-PSP and the two PSP schemes. The mean proportion of impacted OD pairs drops from a high of 41.37% under No-PSP to 12.85% for No-PSP to 7.16% for CDP-PSP. We present the time series of the proportion of impacted OD pairs for the two PSP schemes (normalized by the corresponding value for No-PSP) across the 48 time intervals in Figure 11, and summarize the savings from the 2 PSP schemes in Table VIII. Across all the time intervals, we note that a high percentage of crossfire OD pairs had packet losses under-No-PSP, and that both PSP schemes dramatically reduce this proportion, with CDF-PSP consistently having the lowest proportion of impacted OD pairs. Considering the Table VIII , the proportion of impacted OD pairs in the US network is reduced, on average, by over 69% going from No-PSP to Mean-PSP. From Mean-PSP to CDF-PSP, the proportion drops, on average, by a further substantial 45.47%.

6.3  OD pair-level Performance

In Section VI-B, we explored the performance of the PSP techniques from the overall network perspective. We focus the analysis below on the performance of individual crossfire OD pairs across time.
(a) US(b) Europe(a) US(b) Europe
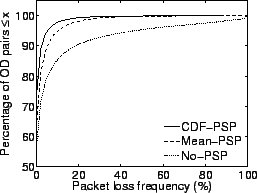
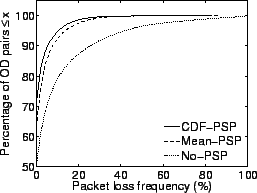
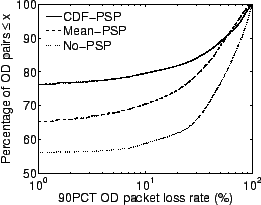
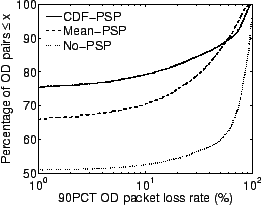
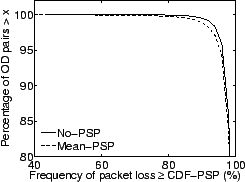
Figure 12:CDF of the loss frequency for all crossfire OD pairs. Figure 13:CDF of the 90 percentile packet loss rate for all crossfire OD pairs.

6.3.1  Loss Frequency

For each crossfire OD pair, we define its loss frequency to be the percentage of of the 48 attack time intervals in which it incurred some packet loss. Note that this metric only captures how often across the different times of day, a crossfire OD pair experiences loss events, and is not meant to capture the actual magnitude of individual loss events which we shall study later. Figure 12 plots the cumulative distribution function (CDF) of the loss frequencies across all the crossfire OD pairs which had some traffic in any of the 48 intervals. In the figure, a given point (x,y) indicates that y percent of crossfire OD-pairs had packet loss in at most x percent of the attack time intervals. Therefore, corresponding to the same x value, the larger the y value for a PSP scheme, the better because that indicates that the scheme had a higher percentage of OD pairs with loss frequency less or equal to x. The figure shows that across the range of loss frequencies, CDF-PSP always has the highest percentage of OD pairs comparing to the other PSP schemes at any given x value. In particular, both CDF-PSP and Mean-PSP substantially increase the number of OD pairs without packet loss at any of 48 attack time intervals, with CDF-PSP performing the best. The percentage of OD pairs with 0% loss frequency increase from 55.86% for No-PSP to 62.83% for Mean-PSP and 72.97% for CDF-PSP for the US network. The corresponding values for the EU network are 50.44%, 63.22% and 70.91%, respectively. In addition, for the US network, 98% of the OD pairs have loss frequencies bounded by 22.92% under Mean-PSP and 18.75% under CDF-PSP. Considering the 98% coverage of the OD pairs population under No-PSP, the bounding loss frequency is a much higher 66.67%. Thus, using either Mean-PSP or CDF-PSP substantially reduces the loss frequency for a large proportion of the crossfire OD pairs.

6.3.2  Packet Loss Rate per OD pair

 
After exploring how often packet losses occur, we next analyze the magnitude of packet losses for different crossfire OD pairs. An OD-pair can have different loss rates at different attack time intervals, and here for each crossfire OD pair, we consider the 90th percentile of these loss rates across time, where we consider only time intervals where that OD pair had non-zero traffic demand. Figure 13 shows the cumulative distribution function (CDF) of this 90th percentile packet loss rate across all crossfire OD-pairs, except those that had no traffic demand during the entire 48 attack time intervals. In the figure, a given point (x,y) indicates that for y% of crossfire OD-pairs, in 90% of the time intervals in which that OD pair had some traffic demand, the packet loss was at most x%. The most interesting region from a practical performance perspective lies to the left of the graph for low values of the loss rate. This is because many network applications and even reliable transport protocols like TCP have very poor performance and are practically unusable beyond a loss rate of a few percentage points. Focussing on 0-10% loss rate range which is widely considered to include this 'habitable zone of loss rates', the figure shows that both Mean-PSP and CDF-PSP both have substantially higher percentage of OD pairs in this zone, compared to No-PSP, and that CDF-PSP has significantly better performance. For example, the US network, the percentage of OD pair with less than 10% loss rate increases from just 59% for No-PSP to 70.48% for Mean-PSP and 79.62% for CDF-PSP. The trends are similar for the EU network.
It should be noted that towards the tail of the distribution, for very large values of the loss rate, the percentage of OD pairs that have less than a certain loss rate x is not always greater for CDF-PSP than for Mean-PSP. We defer the explanation for this to Section VI-C.4 where we analyze the packet losses of a OD-pair under different PSP schemes in greater detail.

6.3.3  Correlating Loss Rate with OD pair characteristics

 
(a) US(b) Europe(a) US(b) Europe
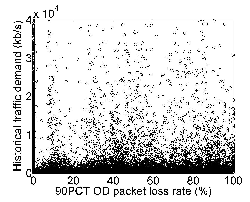
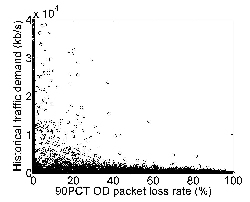
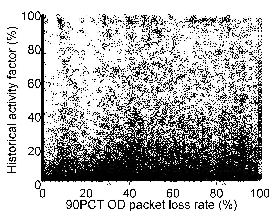
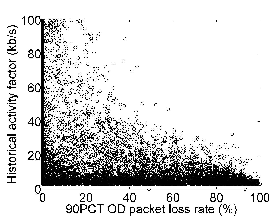
Figure 14:The correlation scatter plot for all crossfire OD-pairs between its 90 percentile OD packet loss rate under No-PSP/CDF-PSP and its historical traffic demand. Figure 15:The correlation scatter plot for all crossfire OD-pairs between its 90 percentile OD packet loss rate under No-PSP/CDF-PSP and its historical activity factor.
The loss rate experienced by an OD pair for a PSP scheme is a function of various factors including the historical traffic demand for that OD pair which influences the admission decisions to the high priority class. To understand the relationship, we consider 2 simple features of its historical traffic profile. The historical traffic demand of an OD pair is the traffic demand for that OD pair averaged across all the historical time intervals. The historical activity factor is the percentage of time intervals that the OD pair had some traffic demand out of all historical time intervals. We explore the relation between each of these features and the 90th percentile packet loss rate defined in the previous subsection in the scatter plots in Figures  142 and  153, where each dot corresponds to a crossfire OD pair and the location of the dot is determined by its 90th percentile packet loss rate and either its historical demand (Figure  14) or its historical activity factor (Figure 15).
Comparing the results for No-PSP and CDF-PSP in the 2 figures, we note that unlike No-PSP, under CDF-PSP, the top right region in the plots are empty and that no OD pair with high historical demand or high historical activity has a high loss rate. Since the historical demand and activity factor values for an OD pair does not change from No-PSP to CDF-PSP, the scatter plots indicate that for many high demand or high activity factor OD pairs, the loss rates are dramatically reduced going from No-PSP to CDF-PSP, shifting their corresponding points to the left side. Under CDF-PSP, all the points with high loss rates correspond to OD pairs with low historical demand or activity factors.
This suggests that CDF-PSP provides better protection for OD pairs with high demand or high activity. This is very desirable from a service provider perspective because OD pairs with high demand or high activity typically carry traffic from large customers who pay the most and are the most sensitive to service interruptions.

6.3.4  OD pair Loss Improvement

 
(a) US(b) Europe(a) US(b) Europe
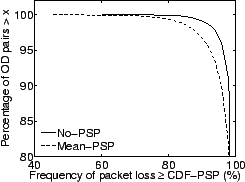
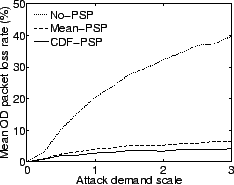
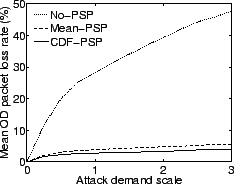
Figure 16:CCDF of percentage of time that the loss rate for a crossfire OD pair under No-PSP and Mean-PSP exceeds that under CDF-PSP Figure 17:The time-averaged mean crossfire OD-pair packet loss rate as the attack volume scaling factor increases from 0 to 3.
As mentioned in Section VI-C.2, CDF-PSP does not always result in a lower packet loss for every OD pair than Mean-PSP. This can be attributed to the different amounts of packets being marked in the high priority class for an OD pair under different policies. It is also possible that both PSP techniques may exhibit higher loss rates for some OD pair in some time interval, compared to No-PSP. This is because under either PSP scheme, under high load conditions, most of the network capacity is used to serve high priority packets, and any residual capacity is used to serve low priority packets. Therefore packets that are marked as low priority will tend to have higher drop rates than under No-PSP, where all packets were treated equally. Therefore for an OD pair, if a large proportion of its offered load gets marked as low priority, and there is congestion on the path, in theory it could suffer more losses than under No-PSP. However, this should not be a common case, since the PSP bandwidth allocation is designed to accommodate the normal traffic demand of an OD pair in the high priority class, based on historical demands. In the following, we examine how often CDF-PSP has better performance than either No-PSP or Mean-PSP.
For both No-PSP and Mean-PSP, we determine for each OD pair the percentage of the 48 attack time intervals when the packet loss rate was no less than the loss rate under CDF-PSP. We plot the complementary cumulative distribution function (CCDF) of this value across all crossfire OD pairs with demand at any of the 48 attack time intervals, for No-PSP and Mean-PSP in Figure 16. For each curve, a given point (x,y) in the figure indicates that for y percent of the crossfire OD pairs, the loss rates are greater than or equal to that under CDF-PSP in at least x percent of the time intervals. The graphs indicate that CDF-PSP outperforms both No-PSP and Mean-PSP for most OD pairs in a large proportion of the time intervals. Compared to No-PSP, for the EU network, under CDF-PSP, 90.72% of the OD pairs have equal or lower loss rates in all 48 time intervals, and 98% of the OD pairs have lower loss rates in at least 93.75% of the time intervals. For the same network, compared to Mean-PSP, CDF-PSP resulted in equal or lower loss rates at all 48 time intervals for 81.27% of the OD pairs.

6.4  Performance under scaled attacks

Given the growing penetration of broadband connections and the ever-increasing availability of large armies of botnets "for hire", it is important to understand the effectiveness of the PSP techniques with respect to increasing attack intensity. To study this, for each network, we vary the intensity of the attack matrix by scaling the demand of every attack flow by a factor ranging from 0 to 3, in steps of size 0.25. For each value of the scaling factor, we measure the time-averaged Mean OD packet loss rate of crossfire OD pairs  (defined in Section VI-B.2) across eight 1-min. time intervals, equally spaces across 24 hours. Figure 17 shows that the loss rate under No-PSP increases much faster than under Mean-PSP and CDF-PSP, as the attack intensity increases. This is because under No-PSP, all the normal traffic packets have to compete for limited bandwidth resources with the attack traffic, while with our protection scheme only normal traffic marked in low priority class is affected by the increasing attack. Therefore, even in the extreme case when the attack traffic demand is sufficient to clog all links, our protection scheme can still guarantee that the normal traffic marked in the high priority class goes through the network. Consequently, our PSP schemes are much less sensitive to the degree of congestion, as evident by the much slower growth of the drop rate. For example, in the US network, as the scale factor increases from 1 to 3, under No-PSP, the mean drop rate jumped from slightly above 20% to almost 40% . In comparison, under CDF-PSP, the mean loss rate increases very little from less than 3% to 4% over the same range of attack intensities. The trends demonstrate that across the range of scaling factor values, both the PSP schemes are very effective in mitigating collateral damage by keeping loss rates low, with CDF-PSP having an edge over Mean-PSP.

6.5  Summary of Results

In this section, we summarize the main findings from the evaluation of our PSP methods on two large backbone networks. First, we show that the potential for collateral damage is significant in that even when a small number of OD pairs are attacked, a majority of the OD pairs in a network can be substantially impacted. For both the US and EU backbones, we observed that the percentage of OD pairs impacted is surprisingly large, 95.5% and 83.5%, even though the attacks were directed over only 1.2% and 0.1% of the OD pairs, respectively. Comparing to no protection, Mean-PSP and CDF-PSP significantly reduced the total packet loss up to 97.58%, the mean OD pair packet loss rates up to 95.92%, and the number of crossfire OD pairs with packet loss by 90.36%. Further, CDF-PSP substantially improved over Mean-PSP by reducing the loss rate across all evaluation matrices. Specifically, CDF-PSP reduced the total packet loss of Mean-PSP up to 53.09% in the US network and up to 41.58% in the EU network, and CDF-PSP reduced the number of OD pairs with packet loss by up to 59.30% in the US network and up to 47.60% in the EU network. Finally, we show PSP can maintain low packet loss rates even when the intensity of attacks is increased significantly.

7  Conclusion

PSP provides network operators with a broad first line of proactive defense against DDoS attacks, significantly reducing the impact of sudden bandwidth-based attacks on a service provider network. The proactive surge protection is achieved by providing bandwidth isolation between traffic flows. This isolation is achieved through a combination of traffic data collection, bandwidth allocation of network resources, metering and tagging of packets at the network perimeter, and preferential dropping of packets inside the network. Among its salient features, PSP is readily deployable using existing router mechanisms, and PSP does not rely on any unauthenticated packet header information. The latter feature makes the solution resilient to evading attack schemes that launch many seemingly legitimate TCP connections with spoofed IP addresses and port numbers. This is due to the fact that PSP focuses on protecting traffic between different ingress-egress interface pairs in a provider network, and both the ingress and egress interface of an IP datagram can be directly determined by the network operator. By taking into consideration traffic variability observed in traffic measurements, our proactive protection solution can ensure the maximization of the acceptance probability of each flow in a max-min fair manner, or equivalently the minimization of the drop probability in a min-max fair manner. Our extensive evaluation results across two large commercial backbone networks, using both distributed and targeted attack scenarios, show that up to 95.5% of the network could suffer collateral damage without protection, but our solution was able to significantly reduce the amount of collateral damage by up to 97.58% in terms of the number of packets dropped and 90.36% in terms of the number of flows with packet loss. In addition, we show that PSP can maintain low packet loss rates even when the intensity of attacks is increased significantly.

References

[1]
Advanced networking for leading-edge research and education. http://abilene.internet2.edu.
[2]
Arbor peakflow. www.arbor.net.
[3]
CERT CA-1996-21 TCP SYN Flooding and IP Spoofing Attacks.
[4]
Cisco guard. http://www.cisco.com/en/US/products/ps5888/index.html.
[5]
Distributed weighted random early detection. http://www.cisco.com/univercd/cc/td/doc/product/software/ios111/cc111/wred.pdf.
[6]
Washington Post, The Botnet Trackers, Tursday, February 16, 2006.
[7]
H. Ballani, Y. Chawathe, S. Ratnasamy, T. Roscoe, and S. Shenker. Off by default! In ACM HotNets Workshop, November 2005.
[8]
D. Bertsekas and R. Gallager. Data Networks. Prentice Hall, 1987.
[9]
Z. Cao and E. W. Zegura. Utility max-min: An application-oriented bandwidth allocation scheme. In IEEE INFOCOM, pages 793-801, 1999.
[10]
J. Chou, B. Lin, S. Sen, and O. Spatscheck. Minimizing collateral damage by Proactive Surge Protection. In ACM LSAD Workshop, pages 97-104, August 2007.
[11]
D. Clark and W. Fang. Explicit allocation of best-effort packet delivery service. IEEE/ACM ToN, August 1998.
[12]
N. G. Duffield, C. Lund, and M. Thorup. Estimating flow distributions from sampled flow statistics. In ACM SIGCOMM, August 2003.
[13]
M. A. El-Gendy, A. Bose, and K. G. Shin. Evolution of the Internet QoS and support for soft real-time applications. Proceedings of the IEEE, 91(7):1086-1104, July 2003.
[14]
A. Feldmann, A. Greenberg, C. Lund, N. Reingold, J. Rexford, and F. True. Deriving traffic demands for operational IP networks: Methodology and experience. In ACM SIGCOMM, June 2000.
[15]
M. Grossglauser and D. N. C. Tse. A framework for robust measurement-based admission control. In IEEE/ACM ToN, 1999.
[16]
Y. Hou, H. Tzeng, and S. Panwar. A generalized max-min rate allocation policy and its distributed implementationusing the ABR flow control mechanism. In IEEE INFOCOM, pages 1366-1375, 1998.
[17]
J. Ioannidis and S. M. Bellovin. Implementing pushback: Router-based defense against DDoS attacks. In Network and Distributed System Security Symposium, 1775 Wiehle Ave., Suite 102, Reston, VA 20190, February 2002. The Internet Society.
[18]
S. Jamin, P. B. Danzig, S. Shenker, and L. Zhang. A measurement-based admission control algorithm for integrated services packet networks. IEEE/ACM ToN, February 1996.
[19]
S. Kandula, D. Katabi, M. Jacob, and A. Berger. Botz-4-Sale: Surviving organized DDoS attacks that mimic flash crowds. In ACM/USENIX NSDI, May 2005.
[20]
K. Lakshminarayanan, D. Adkins, A. Perrig, and I. Stoica. Taming IP packet flooding attacks. In ACM HotNets Workshop, 2003.
[21]
X. Li, F. Bian, M. Crovella, C. Diot, R. Govindan, G. Iannaccone, and A. Lakhina. Detection and identification of network anomalies using sketch subspaces. In ACM/USENIX IMC, October 2006.
[22]
R. Mahajan, S. Floyd, and D. Wetherall. Controlling high-bandwidth flows at the congested router. In International Conference on Network Protocols, November 2001.
[23]
B. Radunovic and J.-Y. L. Boudec. A unified framework for max-min and min-max fairness with applications. IEEE/ACM ToN, accepted for publication.
[24]
B. Raghavan and A. C. Snoeren. A system for authenticated policy-compliant routing. In ACM SIGCOMM, October 2004.
[25]
J. Ros and W. Tsai. A theory of convergence order of maxmin rate allocation and an optimal protocol. In IEEE INFOCOM, pages 717-726, 2001.
[26]
D. Rubenstein, J. Kurose, and D. Towsley. The impact of multicast layering on network fairness. IEEE/ACM ToN, April 2002.
[27]
S. Savage, D. Wetherall, A. Karlin, and T. Anderson. Network support for IP traceback. IEEE/ACM ToN, 9(3), June 2001.
[28]
A. C. Snoeren, C. Partridge, L. A. Sanchez, C. E. Jones, F. Tchakountio, B. Schwartz, S. T. Kent, and W. T. Strayer. Single-packet IP traceback. IEEE/ACM ToN, 10(6):721-734, December 2002.
[29]
H. Tzeng and K. Siu. On max-min fair congestion control for multicast ABR service in ATM. IEEE Journal on Selected Areas in Communications, 1997.
[30]
P. Verkaik, O. Spatscheck, J. V. der Merwe, and A. C. Snoeren. Primed: community-of-interest-based ddos mitigation. In ACM LSAD Workshop, pages 147-154, November 2006.
[31]
Y. Xu and R. Guérin. On the robustness of router-based denial-of-service (dos) defense systems. SIGCOMM Comput. Commun. Rev., 35(3):47-60, 2005.
[32]
A. Yaar, A. Perrig, and D. Song. Pi: A path identification mechanism to defend against DDoS attacks. In IEEE Security and Privacy Symposium, pages 93-107, May 2003.
[33]
A. Yaar, A. Perrig, and D. Song. An endhost capability mechanism to mitigate DDoS flooding attacks. In IEEE Security and Privacy Symposium, May 2004.
[34]
D. K. Y. Yau, J. C. S. Lui, F. Liang, and Y. Yam. Defending against distributed denial-of-service attacks with max-min fair server-centric router throttles. IEEE/ACM ToN, 13(1):29-42, 2005.

Footnotes:

1RIO is WRED with two priority classes.
2The y-axis is cut off at 40,000 kb/s because only a few OD pairs exceeded that demand and all of them had less than 10% loss rate.
3Due to space constraints, we only show the results for the US network, while the results are similar in the EU network.


File translated from TEX by TTH, version 3.80.
On 02 May 2008, 14:50.