Theophilus Benson, Aditya Akella
University of Wisconsin, Madison
David Maltz
Microsoft Research
Operator interviews and anecdotal evidence suggest that an operator's ability to manage a network decreases as the network becomes more complex. However, there is currently no way to systematically quantify how complex a network's design is nor how complexity may impact network management activities. In this paper, we develop a suite of complexity models that describe the routing design and configuration of a network in a succinct fashion, abstracting away details of the underlying configuration languages. Our models, and the complexity metrics arising from them, capture the difficulty of configuring control and data plane behaviors on routers. They also measure the inherent complexity of the reachability constraints that a network implements via its routing design. Our models simplify network design and management by facilitating comparison between alternative designs for a network. We tested our models on seven networks, including four university networks and three enterprise networks. We validated the results through interviews with the operators of five of the networks, and we show that the metrics are predictive of the issues operators face when reconfiguring their networks.
Experience has shown that the high complexity underlying the design and configuration of enterprise networks generally leads to significant manual intervention when managing networks. While hard data implicating complexity in network outages is hard to come by, both anecdotal evidence and operator interviews suggest that more complex networks are more prone to failures, and are difficult to upgrade and manage.
Today, there is no way to systematically quantify how complex an enterprise configuration is, and to what extent complexity impacts key management tasks. Our experiments show that simple measures of complexity, such as the number of lines in the configuration files, are not accurate and do not predict the number of steps management tasks require.
In this paper, we develop a family of complexity models and metrics that do describe the complexity of the design and configuration of an enterprise network in a succinct fashion, abstracting away all the details of the underlying configuration language. We designed the models and metrics to have the following characteristics: (1) They align with the complexity of the mental model operators use when reasoning about their network--networks with higher complexity scores are harder for operators to manage, change or reason about correctly. (2) They can be derived automatically from the configuration files that define a network's design. This means that automatic configuration tools can use the metrics to choose between alternative designs when, as frequently is the case, there are several ways of implementing any given policy.
The models we present in this paper are targeted toward the Layer-3 design and configuration of enterprise networks. As past work has shown [19], enterprises employ diverse and intricate routing designs. Routing design is central both to enabling network-wide reachability and to limiting the extent of connectivity between some parts of a network.
We focus on modeling three key aspects of routing design complexity: (1) the complexity behind configuring network routers accurately, (2) the complexity arising from identifying and defining distinct roles for routers in implementing a network's policy, and (3) the inherent complexity of the policies themselves.
Referential Complexity. To model the complexity of configuring routers correctly, we develop the referential dependence graph. This models dependencies in the definitions of routing configuration components, some of which may span multiple devices. We analyze the graph to measure the average number of reference links per router, as well as the number of atomic units of routing policy in a network and the references needed to configure each unit. We argue that the number of steps operators take when modifying configuration increases monotonically with these measures.
Router Roles. We identify the implicit roles played by routers in implementing a network's policies. We argue that networks become more complex to manage, and updating configurations becomes more challenging, as the number of different roles increases or as routers simultaneously play multiple roles in the network. Our algorithms automatically identify roles by finding routers that share similar configurations.
Inherent Complexity. We quantify the impact of the reachability and access control policies on the network's complexity. Networks that attempt to implement sophisticated reachability policies, enabling access between some sets of hosts while denying it between others, are more complex to engineer and manage than networks with more uniform reachability policies. However, a network's policies cannot be directly read from the network's configuration and are rarely available in any other machine-readable form. Our paper explains how the complexity of the policies can be automatically extracted by extending the concept of reachability sets first introduced by Xie et al. [27]. Reachability sets identify the set of packets that a collection of network paths will allow based on the packet filters, access control rules and routing/forwarding configuration in routers on path. We compute a measure of the inherent complexity of the reachability policies by computing differences or variability between reachability sets along different paths in the network. We develop algorithms based on firewall rule-set optimization to compare reachability sets and to efficiently perform set operations on them (such as intersection, union and cardinality).
We validated our metrics through interviews with the operators and designers of six, four universities and two commercial enterprises. The questionnaires used in these interviews can be found online [4]. We also measured one other network where we did not have access to operators. Through this empirical study of the complexity of network designs we found we are able to categorize networks in terms of their complexity using the metrics that we define. We also find that the metrics are predictive of issues the operators face in running their networks. The metrics gave us insights on the structure and function of the networks that the operators corroborated. A surprising result of the study was uncovering the reasons why operator chose the designs they did.
Given the frequency with which configuration errors are responsible for major outages [22], we argue that creating techniques to quantify systematically the complexity of a network's design is an important first step to reducing that complexity. Developing such metrics is difficult, as they must be automatically computable yet still enable a direct comparison between networks that may be very different in terms of their size and routing design. In databases [14], software engineering [21], and other fields, metrics and benchmarks have driven the direction of the field by defining what is desirable and what is to be avoided. In proposing these metrics, we hope to start a similar conversation, and we have verified with operators through both qualitative and quantitative measures that these metrics capture some of the trickiest parts of network configuration.
Beyond aiding in an empirical understanding of network complexity, we believe that our metrics can augment and improve key management tasks. We illustrate a few examples that are motivated by our observations.
Understanding network structure: It is common for external technical support staff to be brought in when a network is experiencing problems or being upgraded. These staff must first learn the structure and function of the network before they can begin their work, a daunting task given the size of many networks and the lack of accurate documentation. As we show in Section 7, our techniques for measuring reachability have the side-effect of identifying routers which play the same role in a network's design. This creates a summary of the network, since understanding each role is sufficient to understand the purpose of all the similar routers.
Identify inconsistencies: Inconsistency in a network generally indicates a bug. When most routers fit into a small number of roles, but one router is different from the others, it probably indicates a configuration or design error (especially as routers are often deployed in pairs for reasons of redundancy). As we show in Section 6.3, when our inherent complexity metric found the reachability set to one router to be very different from the set to other routers, it pointed out a routing design error.
What-if analysis: Since our metrics are computed from configuration files, and not from a running network, proposed changes to the configuration files can be analyzed before deployment. Should any of the metrics change substantially, it is an excellent indication that the proposed changes might have unintended consequences that should be examined before deployment.
Guiding and automating network design: Networks are constantly evolving as they merge, split, or grow. Today, these changes must be designed by humans using their best intuition and design taste. In future work, we intend to examine how our complexity metrics can be used to direct these design tasks towards simpler designs that still meet the objectives of the designer.
Our project began with a review of formal training materials for network engineers (e.g., [25,24]) and interviews with the operators of several networks to understand the tools and processes they use to manage their networks. From these sources, we extracted the ``best common practices'' used to manage the networks. On the hypothesis that the use of these practices should be discernible in the configuration files of networks that use them, we developed models and techniques that tie these practices to patterns that can be automatically detected and measured in the configurations.
The remainder of this section describes the networks we studied, the best common practices we extracted, and a tutorial summary of network configuration in enterprise networks. The next sections precisely define our metrics, the means for computing them, and their validation.
We studied a total of seven networks: four university networks and three enterprise networks, as these were the networks for which we could obtain configuration files. For four of the university networks and two enterprises, we were also able to interview the operators of the network to review some of the results of our analysis and validate our techniques. Table 1 shows the key properties of the networks.
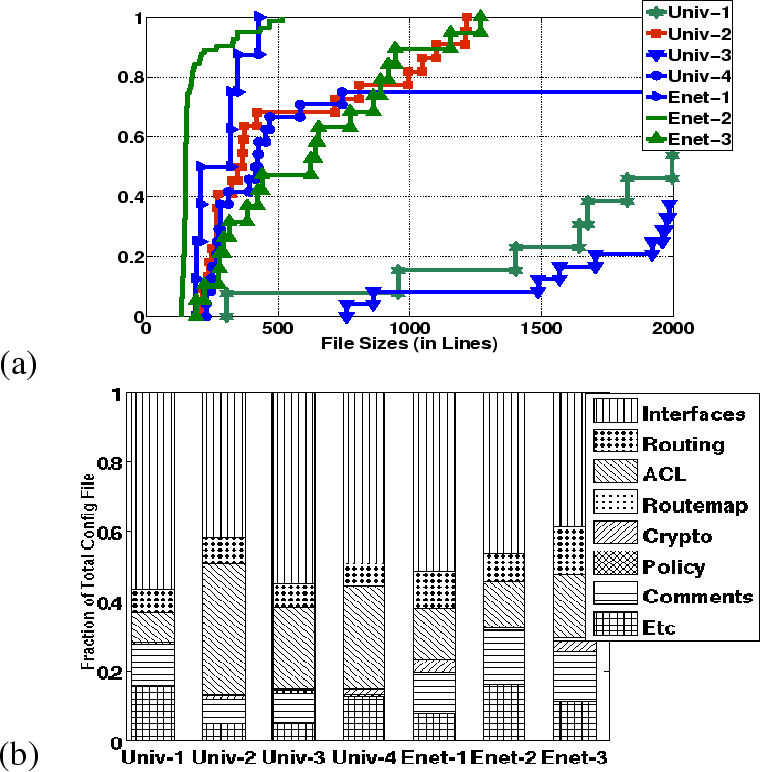 |
Figure 1(a) plots the distribution of configuration file sizes for the networks. The networks cluster into three groups: Univ-2 and the enterprises consist of relatively small files, with 50% of their files being under 500 lines, while 90% of the files in Univ-1 and Univ-3 are over 1,000 lines and Univ-4 has a mix of small and large files. As we will see, configuration file size is not a good predictor of network complexity, as Univ-2 (small files) is among the most complicated networks and Univ-3 (large files) among the simplest.
Figure 1(b) breaks down the lines of configuration by type. The networks differ significantly in the fraction of their configurations devoted to Packet filters, widely known as ACLs, and routing stanzas. Univ-1 and the enterprises spend as many configuration lines on routing stanzas as on ACLs, while Univ-2, -3 and -4 define proportionately more ACLs than routing stanzas. Interface definitions, routing stanzas, and ACL definitions (the key building blocks for defining layer-3 reachability) account for over 60% of the configuration in all networks.
All the networks used some form of tools to maintain their configurations [16,1]. Most tools are home-grown, although some commercial products are in use. Most had at least spreadsheets used to track inventory, such as IP addresses, VLANs, and interfaces. Some used template tools to generate portions of the configuration files by instantiating templates using information from the inventory database. In the sections that follow, we point out where tools helped (and sometimes hurt) operators.
Based on our discussions with operators and training materials, we extract the best common practices that operators follow to make it easier to manage their networks. Our complexity metrics quantify how well a network adheres to these strategies, or equivalently, to what extent a network deviates from them.
Uniformity. To the extent possible, operators attempt to make their networks as homogeneous as possible. Special cases not only require more thought and effort to construct in the first place, but often require special handling during all future network upgrades. To limit the number of special cases operators must cope with, they often define a number of archetypal configurations which they then reuse any time that special case arises. We call these archetypes roles.
Tiered Structure. Operators often organize their network devices into tiers to control the complexity of their design. For example, defining some routers to be border routers that connect with other networks, some routers to be core routers that are densely connected, and the remaining routers as edge routers that connect hosts.
Short Dependency Chains. Routers cannot be configured in isolation, as frequently one part of the configuration will not behave correctly unless other parts of the configuration, sometimes on other routers, are consistent with it. We define this to be a dependency between those configuration lines. Operators attempt to minimize the number of dependencies in their networks. This is because making a change to one configuration file but not updating all the other dependent configurations will introduce a bug. Since the configurations do not explicitly declare all their dependencies, operators' best strategy is to minimize the number of dependencies.
All our complexity metrics are computed on the basis of router configuration files. Before defining the metrics, we describe the layout of the configuration file for a network router and provide an overview of the mechanisms (e.g., routing, ACLs and VLANs) used when designing enterprise networks.
The configuration file for a Cisco device consists of several types of stanzas (devices from other vendors have similar stanza-oriented configurations). A stanza is defined as the largest continguous block of commands that encapsulate a piece of the router's functionality.
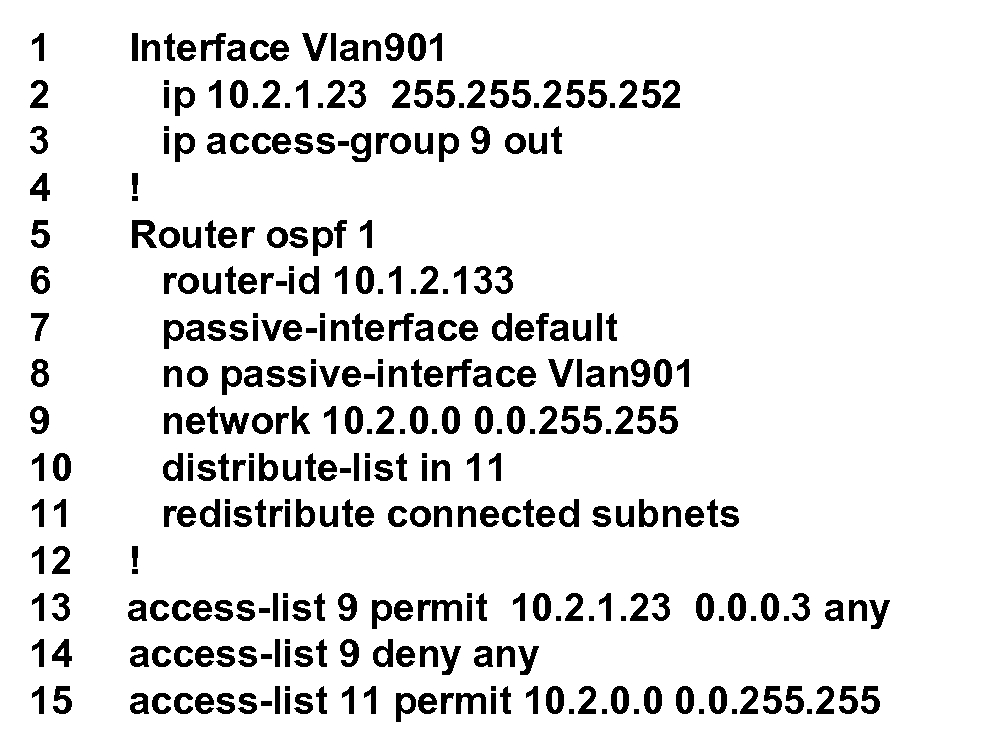
In Figure 2, we show a simple configuration file consisting of the three most relevant classes of stanzas: interface in lines 1-3, routing protocol in lines 5-11, and ACL in lines 13-15. The behavior exhibited by a router can be explained by the interactions between various instances of the identified stanzas.
Egress filtering, i.e., preventing local hosts from sending traffic with IP addresses that does not belong to them, has become a popular way to combat IP-address hijacking. Networks implement egress filtering by defining a packet filter for each interface and creating a reference to the appropriate ACL from the interfaces. For example, line 3 exemplifies the commands an operator would use to setup the appropriate references.
The purpose of most layer-3 devices is to provide network-wide reachability by leveraging layer-3 routing protocols. Network-wide reachability can be implemented by adding a routing stanza and making references between that stanza and the appropriate interfaces. Lines 5-11 declare a simple routing stanza with line 8 making a reference between this routing protocol and the interface defined earlier. Even in this simple case, the peer routing protocol stanza on neighboring devices must be configured consistent with this stanza before routes can propagate between the devices and through the network.
More complex reachability constraints can be imposed by controlling route distribution using ACLs. Line 15 is a filter used to control the announcements received from the peer routing process on neighboring routers.
VLANs are widely used to provide fine grain control of connectivity, but they can complicate configuration by providing an alternate means for packets to travel between hosts that is independent of the layer-3 configuration. In a typical usage scenario, each port on a switch is configured as layer-2 or layer-3. For each layer-3 port there is an interface stanza describing its properties. Each layer-2 port is associated with a VLAN V. The switches use trunking and spanning tree protocols to ensure that packets received on a layer-2 port belonging to VLAN V can be received by every host connected to a port on VLAN V on any switch.
Layer-2 VLANs interact with layer-3 mechanisms via virtual layer-3 interfaces -- an interface stanza not associated with any physical port but bound to a specific VLAN (lines 1-3 in Figure 2). Packets ``sent'' out the virtual interface are sent out the physical ports belonging to the VLAN and packets received by the virtual interface are handled using the layer-3 routing configuration.
As the above description indicates, enabling the intended level of reachability between different parts of a network requires establishing reference links in the configuration files of devices. Reference links can be of two types: those between stanzas in a configuration file (intra-file references) and those across stanzas in different configuration files (inter-file). Intra-file references are explicitly stated in the file, e.g. the links in line 8 (Figure 2) from a routing stanza to an interface, and in line 10 from a routing stanza to an ACL -- these must be internally consistent to ensure router-local policies (e.g. ingress filters and locally attached networks) are correctly implemented. Inter-file references are created when multiple routers refer to the same network object (e.g., a VLAN or subnet); these are central to configuring many network-wide functions, and crucially, routing and reachability. Unlike their intra-file counterparts, not all inter-file references can be explicitly declared. For example, line 2 refers to a subnet which is an example of an entity that cannot be explicitly declared.
As our interviews with operators indicate (§4.3), in some networks the reference links must be manually established. In other networks, some of the reference links within a device are set using automated tools, but many of the inter-file references such as trunking a VLAN on multiple routers and setting routing protocol adjacencies must be managed manually.
To quantify the complexity of reference links, we first construct a referential dependency graph based on device configuration files. We compute a set of first-order complexity metrics which quantify the worst case complexity of configuring reference links in the network. Because reference links often play a role in implementing some network-wide functionality, we also define second order metrics that estimate the overall complexity of configuring such functionality. We focus on routing in this discussion, as operators report it is a significant concern.
We use a two-step approach to parse configuration files and create a dependency graph.
1. Symbol Table Creation. Router vendor documentation typically lists the commands that can appear within each configuration stanza and the syntax for the commands. Based on this, we first create a grammar for configuration lines in router configuration files. We build a simple parser that, using the grammar, identifies ``tokens'' in the configuration file. It records these tokens in a symbol table along with the stanza in which they were found and whether the stanza defined the token or referred to it. For example, the access-list definitions in lines 13-14 of Figure 2 define the token ACL 9 and line 3 adds a reference to ACL 9.
2. Creating Links. In the linking stage, we create reference edges between stanzas within a single file or across files based on the entries in the symbol table. We create unidirectional links from the stanzas referencing the tokens to the stanza declaring the tokens. Because every stanza mentioning a subnet or VLAN is both declaring the existence of the subnet or VLAN and referencing the subnet/VLAN, we create a separate node in the reference graph to represent each subnet/VLAN and create bidirectional links to it from stanzas that mention it.
We also derive maximal sub-graphs relating to Layer-3 control plane functionality, called ``routing instances'' [19]. A routing instance is the collection of routing processes of the same type on different devices in a network (e.g. OSPF processes) that are in the transitive closure of the ``adjacent-to'' relationship. We derive these adjacencies by tracing relationships between routing processes across subnets that are referenced in common by neighboring routers. Taken together, the routing instances implement control plane functionality in a network. In many cases, enterprise networks use multiple routing instances to achieve better control over route distribution, and to achieve other administrative goals [19]. For example, some enterprises will place routes to different departments into different instances -- allowing designers to control reachability by controlling the instances in which a router participates. Thus, it is important to understand the complexity of configuring reference links that create routing instances.
We start by capturing the baseline difficulty of creating and tracking reference links in the entire network. The first metric we propose is the average configuration complexity, defined as the total number of reference links in the dependency graph divided by the number of routers. This provides a holistic view of the network.
We also develop three second-order metrics of the complexity of configuring the Layer-3 control plane of a network. First, we identify the number of interacting routing policy units within the network that the operator must track globally. To do this, we count the number of distinct routing instances in the entire network. Second, we capture the average difficulty of correctly setting each routing instance by calculating the average number of reference links per instance. Finally, we count the number of routing instances each router participates in. In all three cases, it follows from the definition of the metrics that higher numbers imply greater complexity for a network.
We derived referential complexity metrics for all seven networks. Our observations are summarized in Table 2. Interestingly, we note that the referential metrics are different across networks - e.g. very low in the cases of Enet-1 and much higher for Univ-1. For five of the seven networks, we discussed our findings regarding referential dependencies with network operators.
We present the insights we derived focusing on 3 key issues: (1) validation: are the referential dependencies we inferred correct and relevant in practice (meaning that these are links that must be created and maintained for consistency and/or correctness)? (2) complexity: are our complexity metrics indicative of the amount of difficulty operators face in configuring their networks? (3) causes: what caused the high referential complexity in the networks (where applicable)?
| ||||||||||||||||||||||||||||||||||||||||||||||||||||||||||||
Validation. We showed each network's referential dependence graph to the network operators, along with sub-graphs corresponding to the routing protocol configuration in their network. All operators confirmed that the classes of links we derived (e.g. between stanzas of specific kinds, link within stanzas and across routers) were relevant. We also gave operators tasks involving changes to device configurations (specifically, add or remove a specific subnet, apply a new filter to a collection of interfaces). We verified that our reference links tracked the action they took. These two tests, while largely subjective, validated our referential dependency derivation.
As an aside, the dependency graph seems to have significant practical value: Univ-1 and Enet-1 operators felt the graph was useful to visualize their networks' structure and identify anomalous configurations.
Do the metrics reflect complexity? Our second goal was to test if the metrics tracked the difficulty of maintaining referential links in the network. To evaluate this, we gave the operators a baseline task: add a new subnet at a randomly chosen router. We measured the number of steps required and the number of changes made to routing configuration. This is summarized below.
| Network | Num steps | Num changes to routing |
| Univ-1 | 4-5 | 1-2 |
| Univ-3 | 4 | 0 |
| Enet-1 | 1 | 0 |
In Univ-1, the operators used a home-grown automated tool that generates configuration templates for adding a new subnet. Thus, although there are many references to set, automation does help mitigate some aspects of this complexity.
Adding the subnet required Univ-1's operator to modify routing instances in his network. Just as our second order complexity metrics predicted, this took multiple steps of manual effort. The operator's automation tool actually made it harder to maintain references needed for Layer-3 protocols. Note from Table 2 that an average Univ-1 router has two routing instances present on it. These are: a ``global'' OSPF instance present on all core routers and a smaller per-router RIP instance. The RIP instance runs between a router and switches directly attached to the router, and is used to distribute subnets attached to the switches into OSPF. On the other hand, OSPF is used to enable global reachability between subnets and redistribute subnets that are directly attached to the router. When a new subnet is added to Univ-1, the operator's tool automatically generates a network command and incorporates it directly into the OSPF instance. When the subnet needs to be attached to a Layer-2 switch, however, the network statement needs to be incorporated into RIP (and not OSPF). Thus, the operator must manually undo the change to OSPF and update the RIP instance. Unlike the OSPF instance, the network statements in RIP require parameters that are specialized to a switch's location in the network.
Univ-3 presents a contrast to Univ-1. The operator in Univ-3 required 4 steps to add the subnet and this is clearly shown by the first order complexity metric for Univ-3. In contrast to Univ-1, however, almost all of the steps were manual. In another stark difference from Univ-1, the operator had no changes to make to the routing configuration. This is because the network used exactly one routing instance that was setup to redistribute the entire IP space. This simplicity is reflected in the very low second order metrics for Univ-3.
The operator in Enet-1 had the simplest job overall. He had to perform 1 simple step: create an interface stanza (this was done manually). Again, the routing configuration required little perturbation.
In general, we found that the metrics are not directly proportional to the number of steps required to complete a management task like adding a subnet, but the number of steps required is monotonically increasing with referential complexity. For example, Univ-1 with a reference metric of 41.75 required 4-5 steps to add a subnet. Univ-2, with a metric of 4.1 needed 4 steps and Enet-1 with a metric of 1.6 needed just one step.
Causes for high complexity. The most interesting part of our interviews was understanding what caused the high referential complexity in some networks. The reasons varied across networks, but our study highlights some of the key underlying factors.
The first cause we established was the impact of a network's evolution over time on complexity. In Univ-1, approximately 70% of reference links arose due to ``no passive interface'' statements that attempt to create routing adjacencies between neighboring devices. Upon closer inspection, we found that a large number of these links were actually dangling references, with no corresponding statement defined at the neighboring router; hence, they played no role in the network's routing functionality. When questioned, the operator stated that the commands were used at one point in time. As the network evolved and devices were moved, however, the commands became irrelevant but were never cleaned up.
The high second order complexity in Univ-1 results from an interesting cause - optimizing for monetary cost rather than reducing complexity. Univ-1's operator could have used a much smaller number of routing instances (e.g. a single network-wide OSPF) with lower referential counts to achieve the goal of spreading reachability information throughout the network. However, according to the operator, using OSPF on a small number of routers, and RIP between switches and routers, was significantly cheaper as OSPF-licensed switches cost more. Hence this routing design was adopted although it was more complex.
Sometimes, the policies being implemented may require high referential complexity. For instance, Univ-3 imposes global checks for address spoofing, and therefore applies egress filters on all network interfaces. These ACLs accounted for approximately 90% of the links in the dependency graph. Similarly, Univ-4 uses ACLs extensively, resulting in high referential complexity. Despite similar underlying cause, Univ-4 has a higher complexity value than Univ-3 because it employs significantly more interfaces and devices.
When creating a network, operators typically start by defining a base set of behaviors that will be present across all routers and interfaces in the network. They then specialize the role of routers and interfaces as needed to achieve the objectives for that part of the network, for example, adding rate shaping to dorm subnets, and additional filters to protect administrative subnets.
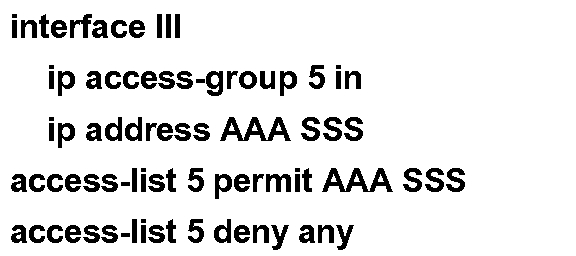
Designers often implement these roles using configuration templates [6]. They create one template for each role, and the template specifies the configuration lines needed to make the router provide the desired role. Since the configuration might need to be varied for each of the routers, template systems typically allow the templates to contain parameters and fill in the parameters with appropriate values each time the template is used. For example, the template for an egress filter might be as shown in Figure 3, where the ACL restricts packets sent by interface III to those originating from the subnet configured to the interface. The designer creates specific configuration stanzas for a router by concatenating together the lines output by the template generator for each behavior the router is supposed to implement.
From a complexity stand-point, the more base behaviors defined within the network, the more work an operator will have to do to ensure that the behaviors are all defined and configured correctly and consistently. Further, the greater the degree of specialization required by routers to implement a template role, the more complex it becomes to configure the role.
We show how to work backwards from configurations to retrieve the original base behaviors that created them. By doing so, we can measure two key aspects of the difficulty of configuring roles on different routers in a network: (1) how many distinct roles are defined in the network? (2) How many routers implement each role?
We identify roles that are ``shared'' by multiple routers using a copy-paste detection technique. This technique looks for similar stanzas on different routers.
We build the copy-paste detection technique using CCFinder [17], a tool that has traditionally been used to identify cheating among students by looking for text or code that has been cut and paste between their assignments. We found that CCFinder by itself does not identify templates of the sort used in router configuration (e.g., Figure 3). To discover templates, we automatically preprocess every file with generalization. Generalization replaces the command arguments that may vary with wild card entries - for example, IP addresses are replaced by the string ``IPADDRESS''. Our implementation uses the grammar of the configuration language (Section 4) to identify what parameters to replace.
Our first metric is the number of base behaviors defined within the network. We define a base behavior as a maximal collection of shared-template stanzas that appear together on a set of two or more routers. As the number of base behaviors increases, the basic complexity of configuring multiple roles across network routers increases.
To compute the number of base behaviors, we first identify the shared-template device set of each template -- this is the set of
devices on which the configuration template is present.
Next, we coalesce identical sets.
To elaborate, we write the device set for a shared-template stanza as
![]() where the Dij
represents a router that contains a configuration stanza generated
from shared template i. We scan the shared-template device sets to
identify identical sets: If two shared-template stanzas are
present on the same set of routers, then the stanzas can be considered
to have arisen from a single, larger template; the stanzas are merged
and one of the sets discarded. The final number of distinct
device sets that remain is the number of base behaviors.
where the Dij
represents a router that contains a configuration stanza generated
from shared template i. We scan the shared-template device sets to
identify identical sets: If two shared-template stanzas are
present on the same set of routers, then the stanzas can be considered
to have arisen from a single, larger template; the stanzas are merged
and one of the sets discarded. The final number of distinct
device sets that remain is the number of base behaviors.
As a second order metric, we quantify the uniformity among devices in terms of the behaviors defined on them. If all devices in the network exhibit the same set of behaviors (i.e., they all have the same shared-template), then once an operator understands how one router behaves, it will be easier for him to understand how the rest of the routers function. Also, updating the roles is simple, as all routers will need the same update.
To measure uniformity, we compute the median and mean numbers of devices in the device sets. We evaluated other information-theoretic metrics such as entropy. However, as our empirical study will show, these simple metrics, together with the number of base behaviors, suffice to characterize the behaviors defined in a network.
Like the referential metrics, we validated our role metrics through interviews with five operators. For this discussion, we focus on the use of ACLs, and Table 3 shows the role metrics for each network. We also evaluated roles across the entire configuration file, and the results are consistent with those for ACLs.
Validation. When shown the shared templates extracted by our system, each of the operators immediately recognized them as general roles used in their networks and stated that no roles were missed by our technique. For example, Univ-1 operators reported seven roles for ACLs in their network: one role for a SNMP-related ACL, one role for an ACL that limits redistribution of routes between OSPF and RIP (these first two roles are present on most routers) and five ACLs that filter any bogus routes that might be advertised by departmental networks connected to the university network, one for each of the five departments (these are found only on the routers where the relevant networks connect).
Enet-3 has separate templates for sub-networks that permit multicast and those that do not, as well as templates encoding special restrictions applied to several labs and project sub-networks. Enet-1, the network with the fewest shared-templates, has a pair of core routers that share the same set of ACLs. The remaining ACLs in the network are specific to the special projects subnets that are configured on other routers. Univ-4, the network with the most shared-templates, has so many roles as it uses multiple different types of egress filters, each of which is applied to subset of the routers. There are also several special case requests from various departments, each represented as an ACL applied to 2-3 routers.
Do the metrics reflect complexity? The relationship between number of roles and the complexity of the network is indicated by type of tools and work process used by the operators.
Operators of the network with the fewest roles, Enet-1, modify all the ACLs in their network manually -- they are able to manage without tools due to the uniformity of their network. Operators at Univ-1 have tools to generate ACLs, but not track relationships between ACLs, so they push all ACLs to all routers (even those that do not use the ACL) in an effort to reduce the complexity of managing their network by increasing the consistency across the configuration files (our shared template system was programmed to ignore ACLs that are not used by the router: this explains why the mean device set size is not larger for Univ-1). The environment at Univ-3 is similar to Univ-1, with roughly the same number of ACL roles and similar tools that can create ACLs from templates, but not track relationships between them. The Univ-3 operators took the opposite approach to Univ-1, pushing each ACL only to the routers that use it, but using manual process steps to enforce a discipline that each ACL contain a comment line listing all the routers where an instance of that ACL is found. Operators then rely on this meta-data to help them find the other files that need to be updated when the ACL is changed.
Causes for high complexity. In general, the number of shared-templates we found in a network directly correlates with the complexity of the policies the operators are trying to realize. For example, for Univ-1's goal of filtering bogus route announcements from departmental networks requires applying a control plane filter at each peering point. Similarly, Univ-4 has policies defining many different classes of subnets that can be attached to the network, each one needing its own type of ACL (e.g., egress filtering with broadcast storm control and filtering that permits DHCP). There is no way around this type of complexity.
Interestingly, the number of roles found in a network appears to be largely independent of the size of the network. For example, Enet-2 and Enet-3 have the same number of roles even though they differ greatly in size. Rather, the number of roles seems to stem directly from the choices the operators made in designing their networks, and how uniform they chose to make them.
A network's configuration files can be viewed as the ``tools'' used by network operators to realize a set of network-wide reachability policies. These policies determine whether a network's users can communicate with different resources in the network (e.g other users or services). The policies that apply to a user could depend on the user's ``group,'' her location, and other attributes.
The reachability policies fundamentally bound an operator's ability to employ simple configurations network-wide. Consider a network with a ``simple'' reachability policy, such as an all-open network that allows any pairs of users to have unfettered communication, or at the opposite end of the spectrum, a network where all communication except those to a specific set of servers is shut off. Such policies can be realized using fairly simple network configurations. On the other hand, for networks where the reachability policies are complex, i.e., where subtle differences exist between the constraints that apply to different sets of users, implementing the policies will require complex configuration.
We develop a framework for quantifying the complexity of a network's reachability policies. We refer to this as the network's inherent complexity. We use feedback from operators to both validate our metrics and understand the factors behind the inherent complexity (where applicable). Ultimately, we wish to tie inherent complexity back to the configuration complexity and examine the relationship between the two. We discuss this in §6.3.
To derive inherent complexity, we first derive the static reachability between network devices, which is the set of packets that can be exchanged between the devices. We also refer to this as the reachability set for the device pair. Our inherent complexity metrics essentially quantify the level of uniformity (or the lack of it) in the reachability sets for various paths in a network.
For simplicity, we assume that network routers have IP subnets
attached to them, and that each IP address in a subnet corresponds to
a single host.
The reachability set for two routers A and C in a network, denoted
by
![]() , is the set of all IP packets that can originate
from hosts attached to A (if any), traverse the
, is the set of all IP packets that can originate
from hosts attached to A (if any), traverse the
![]() path, and be delivered to hosts attached at C (if any).
path, and be delivered to hosts attached at C (if any).
The composition of the reachability sets reflects how a network's
policy limits the hosts at a certain network location from being
reachable from hosts at another network location. At Layer-3, these
policies generally apply to 5 fields in the packet's IP header - the
source/destination addresses, ports and protocol. When first sent, the
source and destination addresses on the packets could take any of the
possible 232 values (the same with ports and the protocol
field). Control and data plane mechanisms on the path might then drop
some of the packets, either because a router on the path lacks a
forwarding entry to that destination or due to packet filters.
![]() identifies the packets that are eventually delivered to hosts attached
to C. Note that the maximum size of
identifies the packets that are eventually delivered to hosts attached
to C. Note that the maximum size of
![]() is
232 x |C| x 216 x 216 x 28, where
|C| is the total number of hosts attached to C.
is
232 x |C| x 216 x 216 x 28, where
|C| is the total number of hosts attached to C.
To compute the reachability sets for a network we consider three separate yet interacting mechanisms: control-plane mechanisms (i.e., routing protocols), data-plane mechanisms (i.e. packet filters), and Layer-2 mechanisms (such as VLANs).
We compute the reachability sets using the following three steps: (1) we first compute valid forwarding paths between network devices by simulating routing protocols (In the interest of space, we omit the details of routing simulation; the details are in [5]); (2) we calculate the ``per-interface'' reachability set on each path - this is the set of all packets that can enter or leave an interface based both on forwarding entries as well as packet filters; and (3) we compute reachability sets for end-to-end paths by intersecting the reachability sets for interfaces along each path. The last two steps are illustrated for a simple toy network in Figure 4, and explained in detail below.
 |
We note that our reachability calculation is similar to Xie et al.'s approach for static reachability analysis of IP networks [27]. However, our approach differs both in the eventual goal and the greater flexibility it provides. Xie et al. derive all possible forwarding states for a network to study the impact of failures, rerouting, etc. on reachability. Because we are interested in examining the inherent complexity of reachability policies, we focus on the computationally simpler problem of computing a single valid forwarding state for the network, assuming there are no failures. Also, our approach takes into account the impact of VLANs on reachability within a network (as described in [5]), which Xie et al. does not. The presence of VLANs means that routing is effectively a two step process: first routing to the VLAN interface, and then routing through the VLAN to the destination. Our calculation tracks which routers trunk which VLANs to enable this second step of the routing computation.
Single interface. The reachability set for interfaces on a path is defined as the set of packets that can enter or leave an on-path interface (see figure 4 for examples). For interfaces that receive packets, this is composed just of the set of packets allowed by inbound data plane filters. For interfaces which forward packets further along a path, this is the union of packets which are permitted by outbound filters and packets whose destination IPs are reachable from the interface (this depends on the router's forwarding state).
Path. To compute
![]() , we first compute the
following supersets: (1) For A, we compute the Entry set which is
the union of the inbound interface sets for interfaces on A -- as
mentioned above, each set is shaped by the inbound filters on the
corresponding interface. (2) For C, we compute the Exit set which
is union of the outbound interface sets for interfaces on C. (3) For
intermediate routers, we compute the intersection of the inbound
interface set for the interface that receives packets from A and the
outbound interface set for the interface that forwards to C. Then,
, we first compute the
following supersets: (1) For A, we compute the Entry set which is
the union of the inbound interface sets for interfaces on A -- as
mentioned above, each set is shaped by the inbound filters on the
corresponding interface. (2) For C, we compute the Exit set which
is union of the outbound interface sets for interfaces on C. (3) For
intermediate routers, we compute the intersection of the inbound
interface set for the interface that receives packets from A and the
outbound interface set for the interface that forwards to C. Then,
![]() is simply the intersection of Entry, Exit and
the intermediate sets.
is simply the intersection of Entry, Exit and
the intermediate sets.
Some optimizations for efficiency. The above computation requires us to perform set operations on the interface and intermediate reachability sets (i.e. set unions and intersections). These operations could be very time-consuming (and potentially intractable) because we are dealing with 5-dimensional reachability sets that could have arbitrary overlap with each other.
To perform these operations efficiently, we convert each set into a ``normalized'' form based on ACL optimization. Specifically, we represent each reachability set as a linear series of rules like those used to define an ACL in a router's configuration, i.e., a sequence of permit and deny rules that specify attributes of a packet and whether packets having those attributes should be allowed or forbidden, where the first matching rule determines the outcome. Next, we optimize this ACL representation of the sets using techniques that have traditionally been employed in firewall rule-set optimization [2,11]. In the final ACL representation of a reachability set, no two rules that make up a set overlap with each other, and we are guaranteed to be using the minimal number of such rules possible to represent the set. Set operations are easy to perform over the normalized ACL representations. For instance, to compute the union of two reachability sets we merge the rules in the corresponding optimized ACLs to create one ACL, and then we optimize the resulting ACL. Intersection can be computed in a similar fashion.
As stated before, our metrics for inherent complexity quantify the similarity, or equivalently, the uniformity, in the reachability sets for various end-to-end paths. If the sets are uniformly restrictive (reflecting a ``default deny'' network) or uniformly permissive (an all open network), then we consider the network to be inherently simple. We consider dissimilarities in the reachability sets to be indicative of greater inherent complexity.
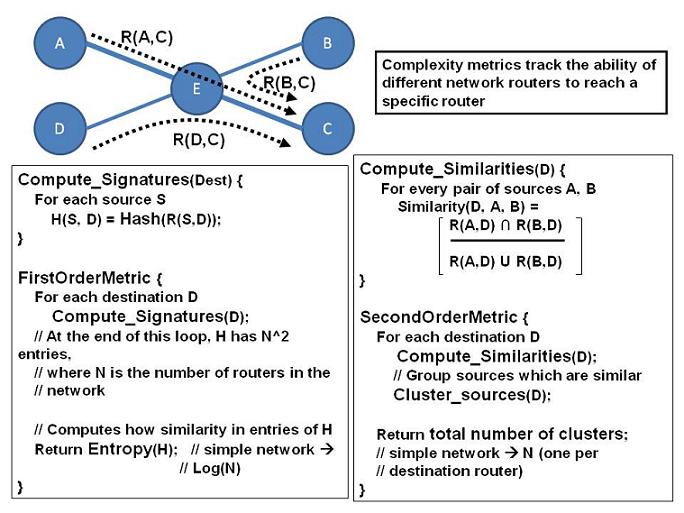
First order metric: variations in reachability. To measure how uniform reachability is across a network, we first compute the reachability set between all pairs of routers. We then compute the entropy of the resulting distribution of reachability sets and use this value, the reachability entropy, as a measure of uniformity.
Figure 5 summarizes the computation of reachability entropy. To compute the distribution of reachability sets over which we will compute the entropy, we must count how many pairs of routers have the same reachability. Intuitively, if there are N routers this involves comparing N2 reachability sets for equality. To simplify this task, we compute the reachability set for a pair of routers, turn it into optimized ACL form, and then compute a hash of the text that represents the optimized set. Identical reachability sets have identical hashes, so computing the distribution is easy.
Using the standard information-theoretic definition of entropy, the reachability entropy for a network with N routers varies from log(N) in a very simple network (where the reachability sets between all pairs of routers are identical) and log(N2) in a network where the reachability set between each pair of routers is different. We interpret larger values of entropy as indicating the network's policies are inherently complex.
Second order metric: Extent of variations. The entropy simply tracks whether the reachability sets for network paths differ, but it does not tell us the extent of the differences. If the reachability sets had even minute differences (not necessarily an indication of great complexity), the entropy could be very high. Thus, entropy alone may over-estimate the network's inherent complexity.
To quantify more precisely the variability between the reachability
sets, we examine the similarity between sets using the approach outlined in
Figure 5. Unlike the entropy calculation, where we
examined the N2 reachability sets between pairs of routers,
we examine differences from the
view point of a single destination router (say C). For each pair of
source routers, say A and B, we compute the
similarity metric,
![]() .
.
We use the set union and intersection algorithms described in Section 6.1.1 to compute the two terms in the above fraction. To compute the sizes of the two sets, we first optimize the corresponding ACLs. In an optimized ACL the rules are non-overlapping, so the number of packets permitted by an ACL is the sum of the number of packets allowed by the ACL's permit rules. Since each rule defines a hypercube in packet space, the number of packets permitted by a rule is found by multiplying out the number of values the rule allows on each dimension (e.g., address, port).
After computing the similarities in this manner, we cluster source routers that have very similar reachability sets (we use an inconsistency cutoff of 0.9) [20, p. 1-61]. Finally, we sum the number of clusters found over all destination routers to compute the number of per-destination clusters as our second order metric for inherent complexity. Ideally, this should be N; large values indicate specialization and imply greater complexity.
Our study of the configuration complexity in Sections 4 and 5 showed that some of the networks we studied had complex configurations. In this section, we examine the inherent complexity of these networks. We validate our observations using operator feedback. We also use the feedback to understand what caused the complexity. (Were the policies truly complex? Was there a bug?)
Our observations regarding the inherent complexity for the networks we
studied are shown in Table 4. Interestingly, we see that a majority of the networks actually had
reasonably uniform reachability policies (i.e. observed entropy
![]() ideal entropy of log(N)). In other words, most
networks seem to apply inherently simple policies at Layer-3 and
below.
ideal entropy of log(N)). In other words, most
networks seem to apply inherently simple policies at Layer-3 and
below.
To validate this observation, we verify with the operators if the networks were special cases that our approach somehow missed. We discussed our observations with the operators of 4 of the 7 networks. The operator for Enet-1 essentially confirmed that the network did not impose any constraints at Layer-3 or below and simply provided universal reachability. All constraints were imposed by higher-layer mechanisms using middleboxes such as firewalls.
We turn our attention next to the networks where the reachability entropy was slightly higher than ideal (Univ-1 and Univ-3). This could arise due to two reasons: either the network's policies make minor distinctions between some groups of users creating a handful of special cases (this would mean that the the policy is actually quite simple), or there is an anomaly that the operator has missed.
In the case of Univ-3, our interaction with the operator pointed to the former reason. A single core router was the cause of the deviation in the entropy values. During discussions with the operator, we found out that the router was home to two unique subnets with restricted access.
Interestingly, in the case of Univ-1 the slight change in entropy was introduced by a configuration bug. Upon discussing with the operator, we found that one of the routers was not redistributing one of its connected subnets because a network statement was missing from a routing stanza on the device. The bug has now been fixed. This exercise shows how our first and second order inherent complexity metrics can detect inconsistencies between an operator's intent and the implementation within a network. In networks where the configuration is complex - Univ-1 is an example with high referential counts and many router roles - such inconsistencies are very hard to detect. However, our complexity metrics were able to unearth this subtle inconsistency.
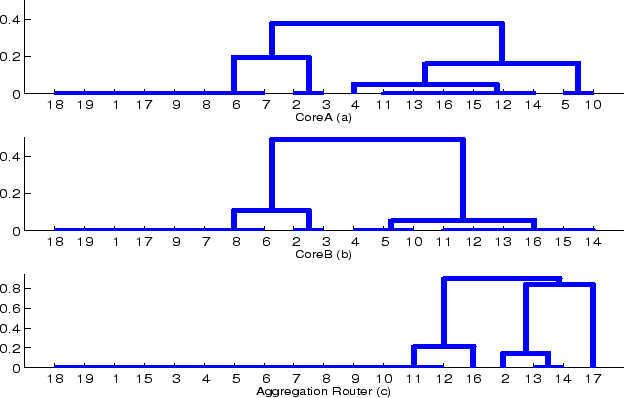 |
Interpreting Figure 6, there are 3-5 clusters of routers that have essentially the same reachability to both coreA and coreB (the only significant difference is that 4, 5, 10 have identical reachability to coreB, while 4 has slightly different reachability to coreA than 5 and 10 do). The presence of multiple clusters implies that traffic is being controlled by fine grain policies. That the clusters of reachability to the Aggregation Router are so different than those to the core implies that not only are policies fine grain, they differ in different places in the network. We argue this means the policies are inherently complex, and that any network implementing them will have a degree of unavoidable complexity. The operator for Univ-2 agreed with our conclusions.
|
However, this metric's value stems from the information it provides about networks like Univ-2, -4 and Enet-3. Enet-3 and Univ-4 both have an entropy value roughly 1.0 higher than ideal. However, Univ-4 has on average four different clusters of reachability for each router (85/24), while Enet-3 has two clusters per router (40/19). This indicates that Enet-3 has reachability sets that are not identical, but are so similar to each other they cluster together, while Univ-4 truly has wide disparity in the reachability between routers. Similarly, Univ-2 has an entropy metric 1.6 above ideal yet less than two different clusters per router, indicating that even when reachability sets are not identical, they are very similar.
Summary of our study. Through interviews with the operators we have verified the correctness of our techniques. We show that our metrics capture the difficulty of adding new functionality such as interfaces, of updating existing functionality such as ACLs, and of achieving high-level policies such as restricting user access. In addition to this, we find that other factors, largely ignored by previous work (e.g. cost and design) play a larger role in affecting a network's complexity than expected.
In addition to creating a framework for reasoning about the complexity of different network designs, complexity metrics have several practical uses including helping operators visualize and understand networks. In this section, we show how our models can discover a network's heirarchy, information that proves invaluable to operators making changes to the network.
Many networks are organized into a hierarchy, with tiers of routers leading from a core out towards the edges. The ability to automatically detect this tiering and classify routers to it would be helpful to outside technical experts that must quickly understand a network before they can render assistance.
We found that computing the sink ratio for each router rapidly
identifies the tiering structure of a network. The sink ratio is
based on the reachability analysis done on each path, and measures the
fraction of packets that a router sinks (delivers locally) versus the
number it forwards on.
Formally, the sink ratio for a path
![]() is
is
![]() .
If the
ratio is 1, then B does not forward traffic from A any further. If
not, then B plays a role in forwarding A's packets to the rest of
the network.
.
If the
ratio is 1, then B does not forward traffic from A any further. If
not, then B plays a role in forwarding A's packets to the rest of
the network.
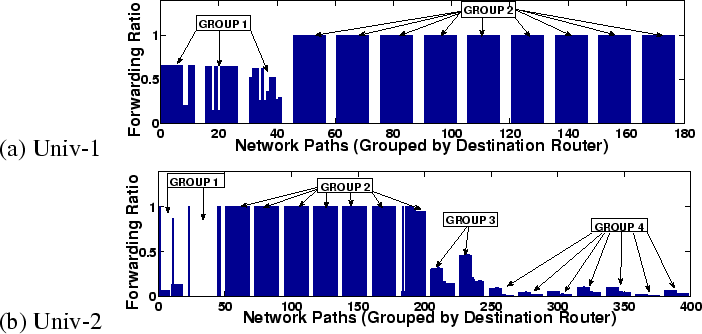 |
Figure 7 shows the sink ratio for each path in networks Univ-1 and Univ-2. Univ-2 contains roughly 4 classes of devices: the edge (Group 2), the core (Group 1), intermediate-core (Group 4), and intermediate-edge(Group 3). Univ-1 consists of a two-layer architecture with three core routers and nine edge routers, respectively labeled Group 1 and Group 2. Enet-2 (not shown) has low forwarding ratios overall: the maximum forwarding ratio itself is just 0.4 and the minimum is 0.15. Thus, we can deduce that all routers in Enet-2 play roughly identical forwarding roles and there is no distinction of core versus edge routers.
Limitations and extensions. Our approach uses the static configuration state of the network. Relying on static configurations means that operators can use our techniques to do ``what-if analysis'' of configuration changes. The downside is that we ignore the effect of dynamic events such as link/router failures and load balancing, the mechanisms in place to deal with these, and the complexity arising from them. It is unclear if our approach can be extended easily to account for these.
Our current work ignores the impact of packet transformations due to NATs and other middleboxes on complexity. Packet transformations could alter reachability sets in interesting ways, and might not be easy to configure. Fortunately, transformations were not employed in any of the networks we studied. We do believe, however, it is possible to extend our techniques to account for on-path changes to IP headers.
Of course, our approaches do not account for techniques employed above Layer-3 or at very low levels. In particular, we currently do not have an easy way to quantify the complexity of mechanisms which use higher-layer handles (e.g. usernames and services) or lower-layer identifiers such as MAC addresses. One potential approach could be to leverage dynamic mappings from the high/low level identifiers to IP addresses (e.g. from DNS bindings and ARP tables) and then apply the techniques we used this in paper.
Absolute vs relative configuration complexity. We note that our metrics for referential complexity and roles capture complexity that is apparent from the current configuration; hence they are absolute in nature. An increase in these metrics indicates growing complexity of implementation, meaning that configuration-related tasks could be harder to conduct. However, the metrics themselves do not reflect how much of the existing configuration is superfluous, or equivalently, what level of configuration complexity is actually necessary. For this, we would need a relative complexity metric that compares the complexity of the existing configuration against the simplest configuration necessary to implement the operators goals (including reachability, cost, and other contraints). However, determining the simplest configuration that satisfies these requirements is a hard problem and a subject for future research.
The work most closely related to ours is [18], which creates a model of route redistribution between routing instances and tries to quantify the complexity involved in configuring the redistribution logic in a network. Glue Logic and our complexity metrics are similar in that both create abstract models of the configuration files and calculate complexity based on that information. However, while [18] limits itself to the configuration complexity of route redistribution (the ``glue logic''), we examine both configuration and inherent complexity, and the relationship between the two. Our approach also accounts for complexity arising from the routing, VLANs and filtering commands in a configuration file.
Our study is motivated by [19,13], which studied operational networks and observed that the configuration of enterprise networks are quite intricate. In [19,13], models were developed to capture the interaction between routing stanzas in devices. However, to make inferences about the complexity of the networks studied, the authors had to manually inspect the models of each network. Our work automates the process of quantifying complexity.
As mentioned in Section 4, we borrow from [19] the idea of a routing instance and use it as a way to group routing protocols. Also, our referential dependence graph is similar to the abstractions used in [6,9]. Unlike [6,9] our abstraction spans beyond the boundaries of a single device, which allows us to define the complexity of network-wide configuration.
Several past studies such as [12,10,28,26,27] have considered how network objectives and operational patterns can be mined from configuration files. Of these, some studies [28,26,27] calculate the reachability sets and argue for their usage in verifying policy compliance. In contrast, the group of complexity metrics we provide allow operators to not only verify policy compliance, but they also quantify the impact of policy decisions on the ability to achieve a simple network-wide configuration. Complementary to [10], which proposes high-level constraints that if met ensure the correctness of routing, we start with the assumption that the network is correct and then derive its properties.
Contrary to the ``bottom-up'' approach we take, several studies [8,15,3] have considered how to make network management simpler by building inherent support for the creation and management of network policies. We presume that our study of configuration and inherent complexity can inform such ideas on clean slate alternatives. Finally, our metrics could be easily integrated into existing configuration management tools such as AANTS [1] and OpenView [16], and can aid operators in making informed changes to their network configurations.
The notion of ``complexity'' has been explored in domains such as System Operations [7]. In [7], complexity is defined as the number of steps taken to perform a task, similar to our metrics. Recently, Ratnasamy has proposed that protocol complexity be used in addition to efficiency to compare network protocols [23]. Just as Ratnasamy's metrics help choose the right protocol, our metrics help pick the right network design.
Configuration errors are responsible for a large fraction of network outages, and we argue that as networks become more complex the risk of configuration error increases. This paper takes the first step towards quantifying the types of complexity that lead operators to make configuration mistakes. Creating such metrics is difficult as they must abstract away all non-essential aspects of network configuration to enable the meaningful comparison of networks with very different sizes and designs.
In this paper, we define three metrics that measure the complexity of a network by automatic analysis of its configuration files. We validate the metrics' accuracy and utility through interviews with the network operators. For example, we show networks with higher complexity scores require more steps to carry out common management tasks and require more tools or more process discipline to maintain. Our study also generated insights on the causes of complexity in enterprise networks, such as the impact of the cost of network devices on routing design choices and the effect of defining multiple classes of subnets and multiple device roles.
We believe our metrics are useful in their own right, and we show how they can aid with finding configuration errors and understanding a network's design. However, our hope is that these metrics start a larger discussion on quantifying the factors that affect network complexity and management errors. The definition of good metrics can drive the field forward toward management systems and routing designs that are less complex and less likely to lead human operators into making errors.