
System administrators are unique computer users. As power users in complex and high-risk work environments, intuition tells us that they may have requirements of the tools they use that differ from those of regular computer users. This paper presents and empirically validates a model of user satisfaction within the context of system administration that accounts for the needs of system administrators. The data were collected through a survey of 125 system administrators and analyzed using structural data modeling techniques. The empirical results of this preliminary investigation demonstrate that user satisfaction models are appropriate in the context of system administration and support the idea that system administrators have unique system and information needs from the tools they use.
System administrators (sysadmins) are becoming increasingly important as organizations continue to embrace technology. With responsibilities that can include the installation, configuration, monitoring, troubleshooting, and maintenance of increasingly complex and mission-critical systems, their work distinguishes them from everyday computer users, and even from other technology professionals. As technology experts and system power users, sysadmins are clearly not novice users; however, most software is designed with novices in mind [Bodker, 1989]. Their broad areas of responsibility often result in a ``juggling act'' of sorts, quickly moving between tasks, and often not completing a given task from beginning to end in one sitting [Barrett, et al., 2004].
Also differentiating system administrators from regular end users of computer systems is the environment in which they work. As more business is conducted over the Internet, simple two-tier architectures have grown into complex n-tier architectures, involving numerous hardware and software components [Bailey, et al., 2003]. Because this infrastructure must be managed nearly flawlessly, the industry has seen system management costs exceed system component costs [IBM, 2006; Kephart and Chess, 2003; Patterson, et al., 2002]. In addition, any system downtime can result in significant monetary losses. Although many vendors are exploring automated system management to cope with these complex and risky environments [HP, 2007; IBM, 2006; SunMicrosystems, 2006], these tools offer little comfort to system administrators, as the sysadmins are often held responsible for any system failures [Patterson, et al., 2002].
Citing the unique problems they face because of the complex systems they manage, their risky work environment, and their power-user access, authorities and skills, Barrett, et al. [Barrett, et al., 2003] call for a focus on system administrators as unique users within HCI research. By examining the work practices of sysadmins, practitioners can design and develop tools suited to their specific needs. With the human cost of system administration now exceeding total system cost [IBM, 2006], the importance of catering to these specialized users is apparent.
To investigate tool features important to system administrators, we utilized a multi-method approach, including semi-structured interviews and a review of previous system administrator research. Our study participants included both junior and senior system administrators whose work responsibilities included the administration of networks, storage, operating systems, web hosting, and computer security. The system administrators we studied worked in enterprise or university settings. Our observations of and conversations with our participants allowed us to gain a better understanding of how the work is accomplished. Semi-structured interviews gave us the opportunity to ask more pointed questions about the sysadmin's motivations and reasons for their particular work routines and allowed us to collect their opinions on why they choose to use or not use a given tool to accomplish their work. With the insights we gained from these investigations, we turned our efforts to a review of the existing system administrator studies to confirm our findings.
The strength of a focused investigation of technology-in-use lies in its ability to identify realistic solutions and guide potential designs [Button and Harper, 1995]. By examining the work of system administrators and reviewing previous studies of system administrators (e.g., [Bailey, et al., 2003; Bailey and Pearson, 1983; Barrett, et al., 2004; Button and Harper, 1995; Fitzpatrick, et al., 1996; Haber and Bailey, 2007; Haber and Kandogan, 2007], we have generated the following list of attributes that appear to be important to system administrators. (The reader should note that many attribute definitions were refined throughout the project, referencing the attribute definitions provided in [Wixom and Todd, 2005].)
Upon further inspection, these characteristics seem to fall into categories of attributes pertaining to attributes of the information supplied by the system and attributes of the system itself. This classification of characteristics can be seen in Table 1.
| Information Attributes | System Attributes |
| Logging | Flexibility |
| Accuracy | Scalability |
| Completeness | Monitoring |
| Format | Situation Awareness |
| Currency | Scriptability |
| Verification | Accessibility |
| Integration | |
| Speed | |
| Reliability | |
| Trust |
Although the above list of characteristics important to system administrators is interesting, it does little more than summarize observations and offer untested guidance to practitioners. Without evidence that these characteristics will influence a system administrator to use a particular tool, practitioners will be reluctant to invest the time and money needed to implement these features. The goal of this study is to understand the link between these characteristics and their impact on system administrator perceptions and ultimately, use of the system.
[Wixom and Todd, 2005] present a modification of DeLone and McLean's original user satisfaction model [DeLone and McLean, 1992] that links system and information satisfaction with the behavioral predictors found in technology acceptance literature [Davis, 1989], perceived ease of use and usefulness. They argue that the object-based attitudes and beliefs expressed in system quality, information quality, system satisfaction, and information satisfaction affect the behavioral beliefs that are captured in ease of use and usefulness. These behavioral beliefs, in turn, influence a user's behavior (i.e., their use or non-use of a system). Essentially, this new model represents a theoretical integration of user satisfaction and technology acceptance theories. The strength of the model lies in its ability to guide IT design and development and predict system usage behaviors. System and information quality antecedents offer concrete attributes important to the user that can be addressed and tested throughout the system development lifecycle (see Figure 1).
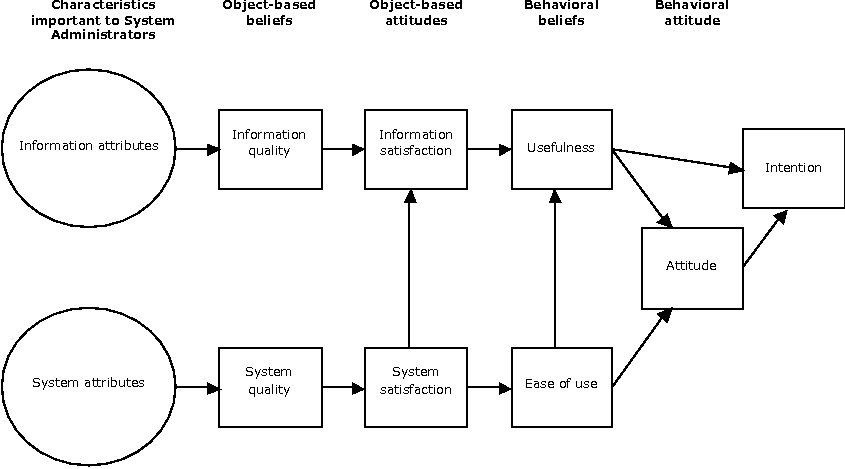
Because system administrators are still computer users in the general sense, we expect the overall theoretical model to hold. Their unique work environment, technical background and job requirements, however, suggest that they may have different needs when using computers or software applications to do their jobs. Previous studies (e.g., [Bailey and Pearson, 1983; Baroudi and Orlikowski, 1987; Davis, 1989]) have focused on a relatively small number of characteristics that, although telling in their underlying structure [Wixom and Todd, 2005], have been criticized for investigating arbitrary system attributes [Galletta and Lederer, 1989]. The analysis of system administrator work practices above identifies system and information quality attributes (i.e., antecedents) that are meaningful and important to system administrators.
To summarize, research suggests that system administrators may be unique users with system and information requirements that are different from the requirements of regular computer users. We have presented a modified user satisfaction model that links system design attributes to end user satisfaction and system use, presenting an opportunity to measure the impact that these identified attributes have on system administrator beliefs and tool usage. We believe that this model provides researchers guidance for adapting existing user information satisfaction models for tools used by system administrators. Next, we present the methodology used to empirically test the model.
System administrators use a self-selected suite of tools to do their work. Our interviews showed that many system administrators within the same organization and even on the same team use different tools and different sets of tools to perform the same tasks. Given this variability of tool choice and use, the difficulty in gathering survey responses from hundreds of system administrators on one particular tool was apparent. As such, we opted to administer the survey to sysadmins of all types (e.g., network administrator, operating system administrator, web administrator, etc.); we asked each participant to identify the tool they used most often in their jobs and complete the survey with that one particular tool in mind. Because the surveys were completed for a tool used most often by the participants, their intention to use the tool is implied; as such, our survey instrument tested all aspects of the model leading up to and including the sysadmin's behavioral attitude towards use of the tool. That is, we did not test the intention to use a tool, because we know the tool is already in use.
A survey methodology was utilized to collect the data for this study. Once the constructs were identified (i.e., the information and system attributes identified above), corresponding measurement items were researched. When possible, previously validated measures were used. Measurement items for the new constructs (i.e., credibility, scalability, scriptability, situation awareness, and monitoring) were developed following Churchill's [Churchill, 1979] methodology. Items were created based on construct definitions and components identified in the literature. Next, a sorting task was used to determine face and discriminant validity. Each measurement item was written on a 3x5 note card and all cards were shuffled. Three professional system administrators were asked to sort the cards into logical groups and name each group. Each sysadmin sorted the items into the five groups and specified similar identifying terms. Based on participant feedback, the wording on some items was slightly modified. These constructs used a seven-point scale anchored on ``Very strongly disagree'' and ``Very strongly agree,'' as described above.
Before implementing the survey, paper-based surveys were created with input from colleagues in academics and IT. Next, the instrument was pre-tested with three system administrators. While some wording was edited for clarity, no major issues were reported with the survey instrument. An online version of the survey instrument was then pre-tested by 24 system administrators. Based on feedback and responses to the pilot survey, minor modifications were made. The final survey included 64 items representing the 23 constructs, as well as demographic information. Table 2 summarizes the constructs, number of items, and references.
| Constructs | Items | Refs | Constructs | Items | Refs |
| Completeness | 2 | W&T | Scalability | 3 | New |
| Accuracy | 3 | W&T | Scriptability | 3 | New |
| Format | 3 | W&T | Situation Awareness | 4 | New |
| Currency | 2 | W&T | Monitoring | 3 | New |
| Logging | 2 | New | Information Quality | 2 | W&T |
| Verification | 2 | New | System Quality | 2 | W&T |
| Reliability | 3 | W&T | Information Satisfaction | 2 | W&T |
| Flexibility | 3 | W&T | System Satisfaction | 2 | W&T |
| Integration | 2 | W&T | Ease of Use | 2 | W&T |
| Accessibility | 2 | W&T | Usefulness | 3 | W&T |
| Speed | 2 | W&T | Attitude | 2 | W&T |
| Credibility | 5 | New |
To obtain survey participants, an announcement was posted on professional system administrator association message boards (e.g., LOPSA and SAGE) and emailed to participants as requested. In order to reach as many system administrators as possible, participants were also invited to refer fellow system administrators to the study. A web-based survey method was selected because of ease of distribution and data collection and the targeted respondents' access to the Internet and familiarity with web-based applications and tools.
Survey respondents were professional system administrators who were solicited through professional association message board postings. After removing incomplete responses, 125 surveys were fully completed. The average time to complete the survey was 23 minutes. Of the survey respondents, 91.2% were male and 8.8% were female. The age of respondents ranged from 21 to 62, with an average age of 37.5. Participants reported working at their current organization for an average of 5.40 years (ranging from three weeks to 26 years) and reported working as a system administrator for an average of 12.39 years (ranging from two years to 29 years). Participant demographics were similar to those found in the 2005-2006 SAGE Salary Survey [SAGE, 2006], considered the most comprehensive survey of system administrator personal, work, and salary demographics. These similarities suggest our survey sample is representative of system administrators. Almost half of our survey participants worked for for-profit organizations and companies (49.6%), including manufacturing, high tech, and finance. The next largest number of respondents (38.4%) worked in academic settings, while others worked for non-profit organizations (5.6%), government agencies (5.6%), or in research (0.8%).
Descriptive statistics for the importance of each attribute, as reported by the participants, can be seen below in Table 3.
| Attribute | Minimum | Maximum | Mean | Std. Deviation |
| Accuracy | 3 | 5 | 4.74 | 0.506 |
| Accessibility | 2 | 5 | 3.98 | 0.762 |
| Completeness | 1 | 5 | 3.74 | 0.870 |
| Credibility | 1 | 5 | 4.57 | 0.700 |
| Currency | 2 | 5 | 4.23 | 0.709 |
| Flexibility | 1 | 5 | 3.92 | 0.947 |
| Format | 1 | 5 | 3.58 | 0.900 |
| Integration | 1 | 5 | 3.50 | 0.947 |
| Logging | 1 | 5 | 3.62 | 0.982 |
| Monitoring | 2 | 5 | 3.78 | 0.906 |
| Reliability | 3 | 5 | 4.68 | 0.576 |
| Situation Awareness | 1 | 5 | 3.72 | 0.876 |
| Scalability | 2 | 5 | 3.79 | 0.927 |
| Scriptability | 1 | 5 | 4.12 | 0.993 |
| Speed | 2 | 5 | 3.66 | 0.782 |
| Usefulness | 2 | 5 | 4.31 | 0.745 |
| Verification | 1 | 5 | 3.38 | 0.904 |
The strength of the measurement model was tested through its reliability, convergent validity, and discriminant validity. Reliability is established with Cronbach's alpha [Nunnally, 1978] and Composite Reliability [Chin, et al., 2003] scores above 0.70; though Composite Reliability is preferred [Chin, et al., 2003] and Cronbach's alpha can be biased against short scales (i.e., 2-3 item scales) [G. Carmines and A. Zeller, 1979]. Following factor analysis, six items that loaded below the 0.70 level were dropped, resulting in constructs with Composite Reliability scores greater than 0.70, as shown in Table 4. Therefore, our measures are reliable. Convergent validity is established when average extracted variance (AVE) is greater than 0.50 and discriminant validity is established when the square root of AVE is greater than the correlations between the construct and other constructs. Table 5 shows the correlation matrix, with correlations among constructs and the square root of AVE on the diagonal. In all cases, the square root of AVE for each construct is larger than the correlation of that construct with all other constructs in the model. Therefore, we have adequate construct validity.
| # | Cronbach's | Composite | ||
| Items | Alpha | Reliability | AVE | |
| Currency | 2 | 0.77 | 0.90 | 0.81 |
| Completeness | 2 | 0.55 | 0.82 | 0.69 |
| Accuracy | 2 | 0.63 | 0.84 | 0.73 |
| Format | 3 | 0.94 | 0.96 | 0.90 |
| Logging | 2 | 0.90 | 0.95 | 0.90 |
| Verification | 2 | 0.85 | 0.93 | 0.87 |
| Reliability | 3 | 0.90 | 0.94 | 0.83 |
| Flexibility | 3 | 0.80 | 0.88 | 0.71 |
| Integration | 2 | 0.80 | 0.91 | 0.83 |
| Accessibility | 2 | 0.69 | 0.87 | 0.76 |
| Speed | 2 | 0.81 | 0.91 | 0.84 |
| Scriptability | 3 | 0.86 | 0.91 | 0.78 |
| Scalability | 3 | 0.78 | 0.87 | 0.70 |
| Credibility | 2 | 0.81 | 0.91 | 0.84 |
| Situation Awareness | 3 | 0.78 | 0.87 | 0.65 |
| Monitoring | 2 | 0.79 | 0.88 | 0.78 |
| Information Quality | 2 | 0.84 | 0.93 | 0.86 |
| System Quality | 2 | 0.88 | 0.94 | 0.89 |
| Information Satisfaction | 2 | 0.86 | 0.94 | 0.88 |
| System Satisfaction | 2 | 0.91 | 0.96 | 0.92 |
| Usefulness | 3 | 0.77 | 0.87 | 0.69 |
| Ease of Use | 2 | 0.72 | 0.87 | 0.78 |
| Attitude | 2 | 0.88 | 0.94 | 0.89 |
Discriminant and convergent validity are further supported when individual items load above 0.50 on their associated construct and when the loadings within the construct are greater than the loadings across constructs. Loadings and cross-loadings are available from the first author. All items loaded more highly on their construct than on other constructs and all loaded well above the recommended 0.50 level.
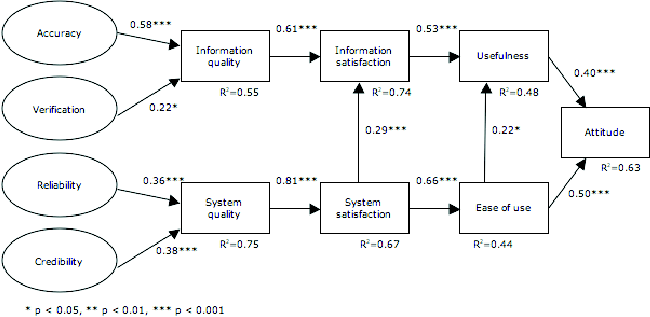
The proposed model was tested with Smart PLS version 2.0 [Ringle, et al., 2005], which is ideal for use with complex predictive models and small sample sizes [Chin, et al., 2003]. R2 values indicate the amount of variance explained by the independent variables and path coefficients indicate the strength and significance of a relationship. Together, R2 values and path coefficients indicate how well the data support the proposed model. User interface type (purely GUI, purely CLI, or a combination of GUI and CLI) was used as a control variable and was linked to both Information Quality and System Quality. A significant relationship was found to System Quality (path = 0.13, p < 0.05), but not to Information Quality.
Figure 2 shows the results of the test of the model. All paths in the high-level user satisfaction model are supported. Only four attributes were significant: accuracy, verification, reliability, and credibility.
The results of the test of the research model can be interpreted as follows: Usefulness (0.40) and Ease of Use (0.50) both had a significant influence on Attitude, accounting for 63% of the variance in the measure. Information Satisfaction (0.53) and Ease of Use (0.22) had a significant influence on Usefulness and accounted for 48% of the variance in Usefulness. System Satisfaction (0.66) had a significant influence on Ease of Use and accounted for 44% of the variance in Ease of Use. Information Quality (0.61) and System Satisfaction (0.29) both had significant influences on Information Satisfaction, accounting for 74% of the variance in Information Satisfaction. System Quality (0.81) significantly determined System Satisfaction and accounted for 67% of the variance in that measure. Accuracy (0.58) and Verification (0.22) were significantly related to Information Quality and accounted for 55% of the variance in the measure. Reliability (0.36) and Credibility (0.38) were significantly related to System Quality and accounted for 75% of the variance in System Quality.
| Accuracy | ||||||||||||
| ACC | 0.85 | Accessibility | ||||||||||
| ACCESS | 0.51 | 0.87 | Attitude | |||||||||
| ATT | 0.55 | 0.58 | 0.94 | Completeness | ||||||||
| COMPL | 0.59 | 0.64 | 0.50 | 0.83 | Credibility | |||||||
| CRED | 0.63 | 0.51 | 0.66 | 0.37 | 0.92 | Currency | ||||||
| CURR | 0.63 | 0.34 | 0.25 | 0.59 | 0.29 | 0.90 | Ease of use | |||||
| EOU | 0.47 | 0.59 | 0.72 | 0.48 | 0.54 | 0.27 | 0.88 | Flexibility | ||||
| FLEX | 0.37 | 0.42 | 0.54 | 0.34 | 0.56 | 0.10 | 0.34 | 0.84 | Format | |||
| FMT | 0.54 | 0.58 | 0.43 | 0.63 | 0.29 | 0.52 | 0.47 | 0.05 | 0.95 | Integration | ||
| INT | 0.21 | 0.46 | 0.37 | 0.33 | 0.27 | 0.13 | 0.35 | 0.54 | 0.22 | 0.91 | Info Quality | |
| IQUAL | 0.70 | 0.63 | 0.72 | 0.52 | 0.75 | 0.45 | 0.59 | 0.46 | 0.48 | 0.38 | 0.93 | Info Satisfaction |
| ISAT | 0.60 | 0.73 | 0.73 | 0.53 | 0.68 | 0.37 | 0.61 | 0.46 | 0.49 | 0.43 | 0.85 | 0.94 |
| LOG | 0.22 | 0.15 | 0.24 | 0.33 | 0.13 | 0.21 | 0.15 | 0.37 | 0.25 | 0.33 | 0.17 | 0.12 |
| MON | 0.27 | 0.34 | 0.23 | 0.27 | 0.26 | 0.29 | 0.19 | 0.28 | 0.15 | 0.32 | 0.30 | 0.27 |
| REL | 0.62 | 0.43 | 0.63 | 0.34 | 0.80 | 0.27 | 0.51 | 0.48 | 0.27 | 0.20 | 0.67 | 0.59 |
| SA | 0.30 | 0.44 | 0.32 | 0.41 | 0.35 | 0.32 | 0.25 | 0.39 | 0.20 | 0.43 | 0.42 | 0.46 |
| SCALE | 0.43 | 0.22 | 0.44 | 0.27 | 0.59 | 0.13 | 0.33 | 0.49 | 0.07 | 0.19 | 0.44 | 0.38 |
| SCRIPT | 0.21 | 0.15 | 0.36 | 0.09 | 0.37 | -0.02 | 0.15 | 0.77 | -0.10 | 0.49 | 0.23 | 0.21 |
| SPEED | 0.46 | 0.38 | 0.54 | 0.34 | 0.54 | 0.20 | 0.43 | 0.43 | 0.12 | 0.22 | 0.52 | 0.43 |
| SQUAL | 0.59 | 0.46 | 0.71 | 0.30 | 0.80 | 0.21 | 0.57 | 0.60 | 0.27 | 0.33 | 0.74 | 0.66 |
| SSAT | 0.65 | 0.60 | 0.85 | 0.47 | 0.77 | 0.31 | 0.66 | 0.57 | 0.41 | 0.35 | 0.81 | 0.78 |
| USEF | 0.45 | 0.58 | 0.67 | 0.40 | 0.63 | 0.19 | 0.55 | 0.60 | 0.30 | 0.40 | 0.60 | 0.67 |
| VERI | 0.15 | 0.18 | 0.28 | 0.27 | 0.16 | 0.13 | 0.17 | 0.33 | 0.23 | 0.33 | 0.22 | 0.16 |
| Logging | ||||||||||||
| LOG | 0.95 | Monitoring | ||||||||||
| MON | 0.14 | 0.88 | Reliability | |||||||||
| REL | 0.18 | 0.23 | 0.91 | Situation Awareness | ||||||||
| SA | 0.16 | 0.56 | 0.28 | 0.81 | Scalability | |||||||
| SCALE | 0.11 | 0.17 | 0.57 | 0.22 | 0.84 | Scriptability | ||||||
| SCRIPT | 0.46 | 0.16 | 0.32 | 0.22 | 0.39 | 0.88 | Speed | |||||
| SPEED | 0.18 | 0.21 | 0.62 | 0.15 | 0.42 | 0.34 | 0.92 | System Quality | ||||
| SQUAL | 0.24 | 0.23 | 0.78 | 0.25 | 0.53 | 0.46 | 0.57 | 0.94 | System Satisfaction | |||
| SSAT | 0.23 | 0.22 | 0.75 | 0.34 | 0.50 | 0.37 | 0.55 | 0.83 | 0.96 | Usefulness | ||
| USEF | 0.16 | 0.31 | 0.49 | 0.47 | 0.42 | 0.42 | 0.42 | 0.57 | 0.64 | 0.83 | Verification | |
| VERI | 0.77 | 0.22 | 0.18 | 0.27 | 0.11 | 0.41 | 0.21 | 0.20 | 0.21 | 0.20 | 0.93 |
These results suggest that at the macro level, system administrators are similar to regular computer users; the user satisfaction model is significant and predictive of their attitude towards computer system use. These results also confirm our intuition that at the micro level, system administrators have specific needs of a computer system that differ from regular users.
When looking at Information Quality, only one attribute found significant in other studies (e.g., [Wixom and Todd, 2005]) was supported, Accuracy. Other attributes previously found significant (Currency, Completeness, and Format) were not. Furthermore, one new attribute was found significant, Verification. Some of these findings may be explained by the work practices of system administrators.
Findings show that accuracy and verification explain 55% of the variance for information quality. Information accuracy is a very real need for system administrators, and was found to be significant in this study. System planning, updating, and debugging is often done with only the information supplied by the system; rarely is a system administrator lucky enough to have a system failure physically apparent, and thus must rely on the accuracy of the information supplied to them. Verification information was found to be a significant influence on information quality. This echoes the findings of the study reported in Chapter 4. While a log of previous actions taken on the system may be relatively simple to access, a list of the outcomes of previous actions may be more difficult to generate.
When looking at System Quality, again only one attribute found significant in other studies (e.g., Wixom and Todd, 2005) was supported, Reliability. Other attributes previously found significant (Flexibility, Integration, Accessibility, Speed) were not. One new attribute, Credibility, was found significant.
Findings show that reliability and credibility explain 75% of the variance for system quality. The reliability of a system is of utmost importance; downtime in a large system can cost $500,000 per hour [Patterson, 2002]. It should come as no surprise, then, that the tools used to manage, configure, and monitor those systems need to be just as reliable. The credibility of a tool was also a significant finding in our study. Another study has found similar results [Takayama and Kandogan, 2006], reporting that trust was an underlying factor in system administrator user interface choice.
The purpose of this study was twofold: One, to empirically test the user satisfaction model in the context of system administration, and two, to identify and empirically test system and information attributes important to system administrators. We found that the theoretical model does hold for system administrators, and that they do, in fact, have unique needs in the systems they use.
This study has implications in both tool evaluation and design. By validating the appropriateness of the user satisfaction model in the context of system administration, researchers can utilize this method to evaluate systems. This research has also identified four tool features that are significant to system administrators - accuracy, verification, reliability, and credibility - and should strive to design tools with these attributes in mind.
Nicole Velasquez is a Post-doctoral Research Associate at the University
of Arizona and an enterprise systems tester with IBM. She has experience as a
sysadmin, programmer, and systems analyst and earned her Ph.D. in Management
Information Systems from the University of Arizona in 2008. Her research
focuses on knowledge management systems, information systems success,
usability, and system administrators. She can be reached at
 .
.
Suzie Weisband is an Eller Fellow and Associate Professor of Management
Information Systems at the University of Arizona. She received her Ph..D from
Carnegie Mellon University in 1989. Her research focuses on collaboration and
coordination in face-to-face and computer mediated contexts, with a current
focus on the dynamics of large-scale collaborations across multiple people,
projects, and resources. She can be reached at
 .
.
Alexandra Durcikova is an Assistant Professor of Management Information
Systems at the University of Arizona. She has experience as an experimental
physics researcher and received her Ph.D. from the University of Pittsburgh in
2004. Her research focuses on knowledge management systems (KMS), the role of
organizational climate in the use of KMS, and IS issues in developing
countries. She can be reached at
 .
.