|
OSDI '04 Paper
[OSDI '04 Technical Program]
ksniffer: Determining the Remote Client Perceived Response Time from Live Packet Streams
David P. Olshefski1,2,
Jason Nieh1
and
Erich Nahum2
1Columbia University and 2IBM T.J Watson Research
olshef@us.ibm.com, nieh@cs.columbia.edu, nahum@us.ibm.com
Abstract
As dependence on the World Wide Web continues to grow, so does the
need for businesses to have quantitative measures of the client
perceived response times of their Web services. We present
ksniffer, a kernel-based traffic monitor capable of determining
pageview response times as perceived by remote clients, in real-time
at gigabit traffic rates. ksniffer is based on novel, online
mechanisms that take a "look once, then drop" approach to packet
analysis to reconstruct TCP connections and learn client pageview activity.
These mechanisms are designed to operate accurately with live network
traffic even in the presence of packet loss and delay, and can be
efficiently implemented in kernel space. This enables ksniffer to
perform analysis that exceeds the functionality of current traffic
analyzers while doing so at high bandwidth rates.
ksniffer requires only to passively monitor network
traffic and can be integrated with systems that perform server management to
achieve specified response time goals. Our experimental results demonstrate that
ksniffer can run on an inexpensive, commodity, Linux-based PC and
provide online pageview response time measurements, across a wide
range of operating conditions, that are within five percent of the response
times measured at the client by detailed instrumentation.
1 Introduction
For many businesses, the World Wide Web is a highly competitive environment.
Customers seeking quality online services have choices, and often the
characteristic that distinguishes a successful site from the rest
is performance. Clients are keenly aware when response time exceeds acceptable
thresholds and are not hesitant to simply take their business elsewhere.
It is therefore extremely important for businesses to know the response time
that their clients are experiencing. This places them in a difficult
position: having to obtain accurate client perceived response time metrics in a
timely, cost effective manner so that problems can be immediately identified and fixed.
For larger Web sites, the requirement of having a scalable solution
is key; in addition, the capability to transmit this information to an online cluster management system
is also a necessity.
Server farm management systems that allocate resources on-demand to meet
specified response time goals are receiving much attention. The
ability of a Web hosting center to move CPU cycles, machines, bandwidth and storage
from a hosted Web site that is meeting its latency goal to one that is not,
is a key requirement for an automated management system. Such allocation
decisions must be based on accurate measurements. Over-allocating resources
to one hosted Web site results in an overcharge to that customer and a reduction in the
available physical resources left to meet the needs of the others. Under-allocation results in
poor response time and unsatisfied Web site users. The ability to base these allocation decisions on
a measure that is relevant to both the Web site owner and the end user of the Web site
is a competitive advantage.
Unfortunately, obtaining an accurate measure of the client perceived response time is
non-trivial. Current approaches include
active probing from geographically distributed monitors, instrumenting
HTML Web pages with JavaScript, offline analysis of packet traces, and
instrumenting Web servers to measure application-level performance or
per connection performance. All of these approaches fall short, in one
area or another, in terms of accuracy, cost, scalability, usefulness
of information collected, and real-time availability of measurements.
We have created ksniffer, an online server-side traffic monitor that
combines passive packet capture with fast online mechanisms to
accurately determine client perceived pageview response times on a
per pageview basis. ksniffer uses a model of TCP
retransmission and exponential backoff that accounts for latency due
to connection setup overhead and network packet loss. It combines
this model with higher level online mechanisms that use access history
and HTTP referer information when available to learn relationships
among Web objects to correlate connections and Web objects to
determine pageview response times.
ksniffer mechanisms take a "look once, then drop" approach to packet
analysis, use simple hashing data structures to match Web objects to
pageviews, and can be efficiently implemented in kernel
space. Furthermore, ksniffer only looks at TCP/IP and HTTP protocol
header information and does not need to parse any HTTP data
payload. This enables ksniffer to perform higher level Web pageview
analysis effectively online in the presence of high data rates; it can
monitor traffic at gigabit line speeds while running on an
inexpensive, commodity PC. These mechanisms enable ksniffer to
provide accurate results across a wide range of operating conditions,
including high load, connection drops, and packet loss. In these cases,
obtaining accurate performance measures is most crucial because Web server and
network resources may be overloaded.
ksniffer has several advantages over other approaches.
First, ksniffer does not require any modifications to Web pages, Web servers, or browsers,
making deployment easier and faster. This is particularly important
for Web hosting companies responsible for maintaining the
infrastructure surrounding a Web site but are often not permitted to
modify the customer's server machines or content. Second, ksniffer
captures network characteristics such as packet loss and delay, aiding
in distinguishing network problems from server problems. Third,
ksniffer measures the behavior of every session for every real client
who visits the Web site. Therefore, it does not fall prey to biases
that arise when sampling from a select, predefined set of client
monitoring machines that have better connectivity, and use different
Web browser software, than the actual users of the Web site. Fourth,
ksniffer can obtain metrics for any Web content, not just HTML. Fifth,
ksniffer performs online analysis of
high bandwidth, live packet traffic instead of offline analysis of
traces stored on disk, bypassing the need to manage large amounts of disk storage
to store packet traces. More importantly, ksniffer can provide
performance measurements to Web servers in real-time, enabling them to respond
immediately to performance problems through diagnosis and resource
management.
This paper presents the design and implementation of ksniffer. Section
2 presents an overview of the ksniffer
architecture. Section 3 describes the
ksniffer algorithms for reconstructing TCP connections and pageview
activities. Section 4 discusses how
ksniffer handles less ideal operating conditions, such as packet loss
and server overload. Section
5 presents experimental results
quantifying the accuracy and scalability of ksniffer
under various operating conditions. We measure the accuracy of ksniffer
against measurements obtained at the client and compare the scalability of ksniffer
against user-space packet analysis systems. Section 6
discusses related work. Finally, we present some concluding remarks and directions for
future work.
2 Overview of ksniffer Architecture
ksniffer is motivated by the desire to have a fast, scalable,
flexible, inexpensive traffic monitor that can be used both
in production environments for observing Web servers, as well as
a platform for research into traffic analysis. Figure
1 depicts the ksniffer architecture.
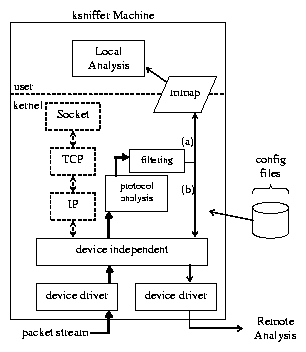 Figure 1: ksniffer architecture.
ksniffer is designed to be implemented as a set of dynamically loadable
kernel modules that reside above the network device independent layer
in the operating system. Its device independence makes it easy to
deploy on any inexpensive, commodity PC without special NIC hardware
or device driver modifications.
ksniffer appears to the kernel simply as another network protocol layer
within the stack and is treated no different than TCP/IP, which is
shown for comparison in Figure 1.
ksniffer monitors bidirectional traffic and looks at
each packet once, extracts any TCP/IP or HTTP header
information that is present, then discards the packet. The in-kernel
implementation exploits several performance advantages such
as zero-copy buffer management, eliminated system calls, and reduced
context switches [16,17].
ksniffer does not produce packet trace log files, but can read
configuration parameters and write debugging information
to disk from kernel space.
This design gives ksniffer a three to four fold improvement in performance over user space
systems that copy every packet to user space. Each packet could potentially impact the
response time measurement, yet ksniffer only examines a small percentage of the
bytes within each packet (TCP/IP fields and the HTTP headers, if present). By executing in
kernel space, ksniffer avoids transferring large amounts of irrelevant bytes to user space,
saving CPU cycles and memory bandwidth.
ksniffer provides a low overhead shared memory interface (similar to MAGNET [13])
to export results (not packets) to user space. This allows more sophisticated analysis
that is less performance critical to be done in user-level programs
without additional system call overhead. ksniffer also provides the ability to transmit
results directly to a remote machine for processing.
Filtering within ksniffer is performed on
the results, not on the incoming packet stream. This differentiates ksniffer from traditional
monitors that exclude certain TCP flows from analysis, which affects aggregate metrics for the
Web site. A detailed discussion of how ksniffer facilitates other user-level and remote analysis is
beyond the scope of this paper. The focus of this paper is on the
protocol analysis portion of ksniffer shown in Figure 1,
which contains the functionality for determining pageview response times.
For simplicity, we assume a single Web
server in our discussion, but the same ksniffer monitoring approach
also applies to a Web site supported by multiple Web servers.
Figure 1: ksniffer architecture.
ksniffer is designed to be implemented as a set of dynamically loadable
kernel modules that reside above the network device independent layer
in the operating system. Its device independence makes it easy to
deploy on any inexpensive, commodity PC without special NIC hardware
or device driver modifications.
ksniffer appears to the kernel simply as another network protocol layer
within the stack and is treated no different than TCP/IP, which is
shown for comparison in Figure 1.
ksniffer monitors bidirectional traffic and looks at
each packet once, extracts any TCP/IP or HTTP header
information that is present, then discards the packet. The in-kernel
implementation exploits several performance advantages such
as zero-copy buffer management, eliminated system calls, and reduced
context switches [16,17].
ksniffer does not produce packet trace log files, but can read
configuration parameters and write debugging information
to disk from kernel space.
This design gives ksniffer a three to four fold improvement in performance over user space
systems that copy every packet to user space. Each packet could potentially impact the
response time measurement, yet ksniffer only examines a small percentage of the
bytes within each packet (TCP/IP fields and the HTTP headers, if present). By executing in
kernel space, ksniffer avoids transferring large amounts of irrelevant bytes to user space,
saving CPU cycles and memory bandwidth.
ksniffer provides a low overhead shared memory interface (similar to MAGNET [13])
to export results (not packets) to user space. This allows more sophisticated analysis
that is less performance critical to be done in user-level programs
without additional system call overhead. ksniffer also provides the ability to transmit
results directly to a remote machine for processing.
Filtering within ksniffer is performed on
the results, not on the incoming packet stream. This differentiates ksniffer from traditional
monitors that exclude certain TCP flows from analysis, which affects aggregate metrics for the
Web site. A detailed discussion of how ksniffer facilitates other user-level and remote analysis is
beyond the scope of this paper. The focus of this paper is on the
protocol analysis portion of ksniffer shown in Figure 1,
which contains the functionality for determining pageview response times.
For simplicity, we assume a single Web
server in our discussion, but the same ksniffer monitoring approach
also applies to a Web site supported by multiple Web servers.
3 ksniffer Pageview Response Time
To determine the client perceived response time for a Web page,
ksniffer measures the time from when the client sends a packet
corresponding to the start of the transaction until the client
receives the packet corresponding to the end of the transaction. How a
packet may indicate the start or end of a transaction depends upon several
factors.
To show how this is done, we first briefly describe some basic
entities tracked by ksniffer, then describe how ksniffer determines
response time based on an anatomical view of the client/server
behavior that occurs when a Web page is downloaded.
ksniffer keeps track of four entities to maintain the information it
needs to measure response time: clients, pageviews, HTTP
objects, and TCP connections. ksniffer tracks each of these entities
using the corresponding data objects shown in Figure 2.
Clients are uniquely identified by their IP address. A pageview
consists of a container page and a set of
embedded HTTP objects. For example, a typical Web page consists
of an HTML file as the container page and a
set of embedded images which are the embedded HTTP objects.
Pageviews are identified by the URL of the associated container page
and Web objects are identified by their URL. A flow represents a TCP connection,
and is uniquely identified by the four tuple consisting of source and
destination IP address and port numbers.
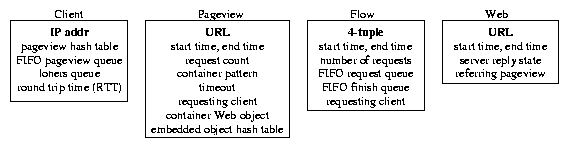 Figure 2: Objects used by ksniffer for tracking.
It is the associations between instances of these objects
which enables ksniffer to reconstruct the activity at the Web site.
To efficiently manage these associations, ksniffer maintains sets of
hash tables to perform fast lookup and correlation between the four types
of objects. Separate hash tables are used for
finding clients and flows, indexed by hash functions on the IP address
and four-tuple, respectively. Each client object contains a pageview
hash table indexed by a hash function over the container page URL.
Flows contain a FIFO request queue of Web objects that have been requested but not
completed, and a FIFO finish queue of Web objects that have been
completed.
Suppose a remote client, Cj, requests a Web page. We decompose
the resulting client/server behavior into four parts: TCP connection
setup, HTTP request, HTTP response, and embedded object processing. We
use the following notation in our discussion. Let Cj be the
jth remote client and Fji be the ith TCP connection
associated with remote client Cj. Let pvji be the
ith pageview associated with remote client Cj, and wkj,i be
the kth Web object requested on Fji. Let ti be the ith
moment in time, d represent an insignificant amount
of processing time, either at the client or the server, p represent
the Web server processing time of an HTTP request, and RTT be the round
trip time between the client and the server.
Figure 2: Objects used by ksniffer for tracking.
It is the associations between instances of these objects
which enables ksniffer to reconstruct the activity at the Web site.
To efficiently manage these associations, ksniffer maintains sets of
hash tables to perform fast lookup and correlation between the four types
of objects. Separate hash tables are used for
finding clients and flows, indexed by hash functions on the IP address
and four-tuple, respectively. Each client object contains a pageview
hash table indexed by a hash function over the container page URL.
Flows contain a FIFO request queue of Web objects that have been requested but not
completed, and a FIFO finish queue of Web objects that have been
completed.
Suppose a remote client, Cj, requests a Web page. We decompose
the resulting client/server behavior into four parts: TCP connection
setup, HTTP request, HTTP response, and embedded object processing. We
use the following notation in our discussion. Let Cj be the
jth remote client and Fji be the ith TCP connection
associated with remote client Cj. Let pvji be the
ith pageview associated with remote client Cj, and wkj,i be
the kth Web object requested on Fji. Let ti be the ith
moment in time, d represent an insignificant amount
of processing time, either at the client or the server, p represent
the Web server processing time of an HTTP request, and RTT be the round
trip time between the client and the server.
3.1 TCP Connection Setup
If the client, Cj, is not currently connected to the Web server, the pageview
transaction begins with making a connection. Connection establishment is
performed using the well known TCP three-way handshake,
as shown in Figure 3. The start of the pageview transaction corresponds to the
SYN J packet transmitted by the client at time t0. However, ksniffer is located on
the server-side of the network, where a dotted line is used in Figure 3 to represent the
point at which ksniffer captures the packet stream. ksniffer does not
capture SYN J until time t0 + .5RTT, after the packet takes 1/2 RTT
to traverse the network. This is assuming ksniffer and the Web
server are located close enough together that they see packets at
essentially the same time.
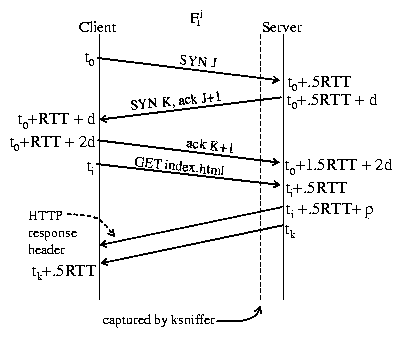 Figure 3: HTTP request/reply.
If this is the first connection from Cj, ksniffer will create a
flow object Fj1 and insert it in the flow hash table. At this
moment, ksniffer does not know the value for RTT since only the SYN J
packet has been captured, so it cannot immediately determine time t0.
Instead, it sets the start time for Fj1 equal to t0 + .5RTT.
ksniffer then waits for further activity on the connection. At t0+ 1.5RTT + 2d, ksniffer and the Web server receive the ACK K+1
packet, establishing the TCP connection between client and server.
ksniffer can now determine the RTT as the difference between the
SYN-ACK from the server (the SYN K, ACK J+1 packet) and the resulting
ACK from the client during connection establishment (the ACK K+1
packet). ksniffer then updates Fj1's start time by subtracting
1/2 RTT from its value to obtain t0.
At time t0 + 1.5RTT + 2d, for the first connection from Cj,
ksniffer creates a client object Cj, saves the
RTT value, and inserts the object into the client hash table.
For each subsequent connection from Cj,
a new flow object Fji will be created and linked to the
existing client object, Cj. The RTT for
each new flow will be computed, and Cj's RTT will be updated
based on an exponentially weighted moving average of the RTTs of its
flows in the same manner as TCP [28].
The updated RTT is then used to determine the actual start time for
each flow, t0.
Figure 3: HTTP request/reply.
If this is the first connection from Cj, ksniffer will create a
flow object Fj1 and insert it in the flow hash table. At this
moment, ksniffer does not know the value for RTT since only the SYN J
packet has been captured, so it cannot immediately determine time t0.
Instead, it sets the start time for Fj1 equal to t0 + .5RTT.
ksniffer then waits for further activity on the connection. At t0+ 1.5RTT + 2d, ksniffer and the Web server receive the ACK K+1
packet, establishing the TCP connection between client and server.
ksniffer can now determine the RTT as the difference between the
SYN-ACK from the server (the SYN K, ACK J+1 packet) and the resulting
ACK from the client during connection establishment (the ACK K+1
packet). ksniffer then updates Fj1's start time by subtracting
1/2 RTT from its value to obtain t0.
At time t0 + 1.5RTT + 2d, for the first connection from Cj,
ksniffer creates a client object Cj, saves the
RTT value, and inserts the object into the client hash table.
For each subsequent connection from Cj,
a new flow object Fji will be created and linked to the
existing client object, Cj. The RTT for
each new flow will be computed, and Cj's RTT will be updated
based on an exponentially weighted moving average of the RTTs of its
flows in the same manner as TCP [28].
The updated RTT is then used to determine the actual start time for
each flow, t0.
3.2 HTTP Request
Once connected to the server, the remote client transmits an HTTP request for the
container page and waits for the response. If this is not the first request over the
connection, then this HTTP request indicates the beginning
of the pageview transaction. Figure 3 depicts
the first request over a connection. At time ti, the client transmits the
HTTP GET request onto the network, and after taking 1/2 RTT to traverse the network,
the server receives the request at ti + .5RTT.
ksniffer captures and parses the packet containing the HTTP GET request,
splitting the request into all its constituent components and
identifying the URL requested.
Since this is the first HTTP request over connection Fj1, it
incurs the connection setup overhead.
In this case, a Web object is created, wj,11, to
represent the request, and the start time for wj,11 is set to
the start time of Fj1.
In this manner, the connection setup time is attributed to the first
HTTP request on each flow. wj,11 is then inserted into
Fj1's request queue and Fj1's number-of-requests field
is set to one.
If this was not the first HTTP request over connection Fj1,
but was instead the kth request on Fj1, a Web object
wj,1k would be created but its start time would be set equal
to ti.
Next, ksniffer creates pvj1, the
pageview object that will track the pageview, and inserts it into
Cj's pageview hash table. We assume for the moment that wj,11 is a
container page; embedded objects are discussed in Section
3.5. ksniffer sets pvj1's start
time equal to wj,11's start time, and sets wj,11 as the
container Web object for pvj1. At this point in time,
ksniffer has properly determined which pageview is being downloaded, and the
correct start time of the transaction.
3.3 HTTP Response
After the Web server receives the HTTP request and takes p amount of time to
process it, the server sends a reply back to the client. ksniffer captures the
value of p, the server response time, which is often mistakenly cited as the client
perceived response time. Server response time
can underestimate the client perceived response time by more than
an order of magnitude [27]. The first response
packet contains the HTTP response header, along with the initial portion of
the Web object being retrieved. ksniffer looks at the response headers but never parses the
actual Web content returned by the server; HTML parsing would entail
too much overhead to be used in an online, high bandwidth environment.
ksniffer obtains Fj1 from
the flow hash table and determines the first Web object in Fj1's
request queue is wj,11, which was placed onto the queue when the request
was captured. An HTTP response header does not specify the URL for which
the response is for. Instead, HTTP protocol semantics dictate that, for a given connection,
HTTP requests be serviced in the order they are received by the Web server.
As a result, Fj1's FIFO request queue enables ksniffer to
identify each response over a flow with the correct request object.
ksniffer updates wj,11's server reply state based on information
contained in the response header. In particular, ksniffer
uses the Content-length: and Transfer_Encoding: fields,
if present, to determine what will be the sequence number of the
last byte of data transmitted by the server for this request.
ksniffer captures each subsequent packet to identify the time of the end of the response.
This is usually done by identifying the packet containing the sequence number for the
last byte of the response. When the response is chunked [10], sequence number matching
cannot be used. Instead, ksniffer follows the chunk chain within
the response body across multiple packets to determine the packet containing
the last byte of the response. For CGI responses over HTTP 1.0 which do not specify the
Content-length: field, the server closes the connection to indicate
the end of the response. In this case, ksniffer simply keeps track of the time for
the last data packet before the connection is closed.
ksniffer sets wj,11's end time to the
arrival time of each response packet, plus 1/2 RTT to
account for the transit time of the packet from server to client.
ksniffer also sets pvj1's end time to wj,11's end
time. The end time will monotonically increase until the server reply has been
completed, at which point the (projected) end time will be equal to tk +.5RTT, as shown in Figure 3. When ksniffer captures
the last byte of the response at time tk, wj,11 is moved
from Fj1's request queue to Fj1's finish queue, where it remains
until either Fj1 is closed or until ksniffer determines that all
segment retransmissions (if any) have been accounted for, which is discussed
in Section 4.
Most Web browsers in use today serialize multiple HTTP requests over a
connection such that the next HTTP request is not sent
until the response for the previous request has been fully received.
For these clients, there is no need for each flow object to maintain a
queue of requests since there will only be one outstanding request at
any given time. The purpose of ksniffer's request queue mechanism is
to support HTTP pipelining, which has been adopted by a small, but
potentially growing number of Web browsers. Under HTTP pipelining, a browser
can send multiple HTTP requests at once, without waiting for the server to
reply to each individual request.
ksniffer's request queues provide support for HTTP pipelining by
conforming to RFC2616 [10], which states that a server
must send its responses to a set of pipelined requests in the same
order that the requests are received. Since TCP is a reliable transport
mechanism, requests that are pipelined from the client, in a certain
order, are always received by the server in the same order. Any
packet reordering that may occur in the network is handled by TCP at
the server. ksniffer provides similar mechanisms to handle packet reordering
so that HTTP requests are placed in
Fj1's request queues in the correct sequence. This entails properly
handling a packet that contains multiple HTTP requests as well as
an HTTP request which spans packet boundaries.
At this point in time, ksniffer has properly determined tk + .5RTT,
the time at which the packet containing the last byte of data for
wj,11 was received by client Cj. If the Web page has no
embedded objects then this marks the end of the pageview transaction. For example, if
wj,11 corresponds to a PDF file instead of an HTML file, ksniffer can
determine that the transaction has completed, since a PDF file cannot have embedded
objects.
If wj,11 can potentially embed one or more Web objects,
ksniffer cannot assume that pvj1 has completed. Instead, it
needs to determine what embedded objects will be downloaded to
calculate the pageview response time. At time tk + .5RTT,
ksniffer cannot determine yet if requests for embedded objects are
forthcoming or not. In particular, ksniffer does not parse the HTML
within the container page to identify which embedded objects may be
requested by the browser. Such processing is too computationally
expensive for an online, high bandwidth system, and often does not
even provide the necessary information. For example, a JavaScript
within the container page could download an arbitrary object that
could only be detected by executing the JavaScript, not just parsing
the HTML. Furthermore, HTML parsing would not indicate which
embedded objects are directly downloaded from the server, since some
may be obtained via caches or proxies. ksniffer instead takes a
simpler approach based on waiting and observing what further HTTP
requests are sent by the client, then using HTTP request header
information to dynamically learn which container pages embed which
objects.
3.4 Online Embedded Pattern Learning
ksniffer learns which container pages embed which objects by tracking
the Referer: field in HTTP request headers. The Referer:
field contained in subsequent requests is used to group embedded
objects with their associated container page. Since the
Referer: field is not always present, ksniffer develops
patterns from those it does collect to infer embedded object
relationships when requests are captured that do not contain a
Referer: field. This technique is faster than
parsing HTML, executing JavaScript, or walking the Web site with a Web
crawler. In addition, it allows ksniffer to react to changes in
container page composition as they are reflected in the actual client
transactions.
ksniffer creates referer patterns on the fly. For each HTTP request that is captured,
ksniffer parses the HTTP header and determines if the Referer:
field is present. If so, this relationship is saved in a pattern
for the container object. For example, when monitoring
ibm.com, if a GET request for obj1.gif is captured, and the
Referer: field is found to contain "www.ibm.com/index.html",
ksniffer adds obj1.gif as an embedded object within the pattern
for index.html. If a Referer: field is captured which
specifies a host not being monitored by ksniffer,
such as "www.xyz.com/buy.html", it is ignored.
ksniffer uses file extensions as a heuristic when building
patterns. Web objects with an extension such as .ps and .pdf cannot
contain embedded objects, nor can they be embedded within a page. As
such, patterns are not created for them, nor are they associated with
a container page. Web objects with an extension such as .gif or .jpg
are usually associated with a container page, but cannot themselves
embed other objects. Web objects with an extension such as .html or
.htm can embed other objects or be embedded themselves. Each
individual .html object has its own unique pattern, but currently an
.html object is never a member of another object's pattern. This
prevents cycles within the pattern structures, but results in ksniffer
treating frames of .html pages as separate pageviews.
Taking this approach means that ksniffer does not need to be
explicitly told which Web pages embed which objects - it learns this
on its own. Patterns are persistently kept in memory using a hash
table indexed by the container page URL. Each pvji and
container wj,ik is linked to the pattern for the Web object it
represents, allowing ksniffer to efficiently query the patterns
associated with the set of active pageview transactions.
Since Web pages can change over time, patterns get dynamically updated,
based on the client activity seen at the Web site. Therefore, a
particular embedded object, obj1.jpg, may not belong to the
pattern for container index.html at time ti, and yet belong
to the pattern at time ti �k. Likewise, a pattern may not exist
for buy.html at time ti, but then be created at a later
time ti+k, when a request is captured. Of course, the same
embedded object, obj1.jpg, may appear in multiple patterns, index.html
and buy.html, at the same time or at different times. Since patterns
are only created from client transactions, the set of patterns managed by
ksniffer may be a subset of all the container pages on the Web site. This
can save memory: ksniffer maintains patterns for container pages that are
being downloaded, but not for those container pages on the Web site which
do not get requested.
Only the Referer: field is used to manipulate patterns,
and the embedded objects within a pattern are unordered. ksniffer
places a configurable upper bound of 100 embedded objects within a
pattern so as to limit storage requirements. When the limit is reached,
an LRU algorithm is used for replacement, removing the embedded object
which has not been linked to the container page in an HTTP request
for the longest amount of time.
Each pattern typically contains a superset of those objects which the
container page actually embeds. As the pattern changes, the new
embedded objects get added to the pattern; but the old embedded
objects only get removed from the pattern if the limit is reached.
This is perfectly acceptable since ksniffer does not use patterns in a
strict sense to determine, absolutely, whether or not a container page
embeds a particular object.
Most Web browsers, including Internet Explorer and Mozilla, provide
referer fields, but some do not and privacy
proxies may remove them. To see what percentage of
embedded objects have referer fields in practice, we analyzed the
access log files of a popular musician resource Web site that has
over 800,000 monthly visitors. The access logs covered a 15 month
period from January 2003 until March 2004. 87% of HTTP requests
had a referer field, indicating that a substantial portion of embedded
objects may have referer fields in practice. ksniffer is specifically
designed for monitoring high speed links that transmit a
large number of transactions per second. In the domain of pattern
generation, this is an advantage. The probability that at least one HTTP
request with the Referer: field set for a particular container page
will arrive within a given time interval is extremely high.
3.5 Embedded Object Processing
If a container page references embedded objects, the
end of the transaction will be indicated by the packet containing the
sequence number of the last byte of data, for the last object to
complete transmission. To identify this packet, ksniffer
determines which embedded object requests are related to each
container page using the Referer: field of HTTP requests, file
extension information, and the referer patterns discussed in Section
3.4.
In our example, suppose index.html contains
references to five embedded images obj1.gif, obj2.gif,
obj3.gif, obj4.gif, and obj8.gif. The embedded
objects will be identified and processed as shown in Figure
4 (ignoring for the moment Fj3).
At time tk + .5RTT, the browser parses the HTML document and
identifies any embedded objects. If embedded objects are referenced within the HTML,
the browser opens an additional connection, Fj2, to the server so that
multiple HTTP requests for the embedded objects can be serviced,
in parallel, to reduce the overall latency of the transaction. The packet containing the sequence
number of the last byte of the last embedded object to be fully
transmitted indicates the end of the pageview transaction, te.
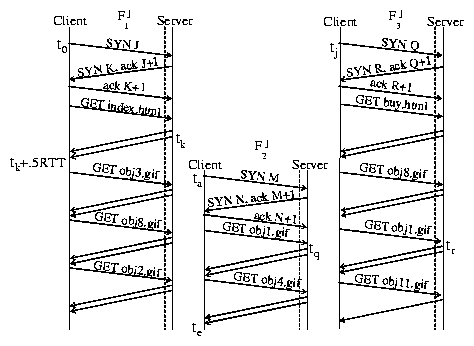 Figure 4: Downloading multiple container pages and embedded objects over multiple connections.
The start and end times for embedded object requests are determined
in the same manner as previously described in Sections
3.2 and 3.3.
Each embedded object that is requested is tracked in the same manner
that the container page, index.html, was tracked. For example,
when the second connection is initiated, ksniffer creates a flow
object Fj2 to track the connection, and associates it with
Cj. When the request for obj1.gif on Fj2 is
captured at time tq, a wj,21 object is created for tracking
the request, and is placed onto Fj2's request queue.
To determine the pageview response time, which is calculated as te - t0,
requires correlating embedded objects to their proper container page, which involves tackling
a set of challenging problems. Clients, especially proxies, may be
downloading multiple pageviews simultaneously. It is possible
for a person to open two or more browsers and connect to the
same Web site, or for a proxy to send multiple pageview requests to a
server, on behalf of several remote clients. In either case, there
can be multiple currently active pageview transactions simultaneously
associated with the remote client Cj (e.g., pvj1,
pvj2 ... pvjk). In addition, some embedded objects being requested may appear
in multiple pageviews, and some Web objects may be retrieved from caches or CDNs.
ksniffer applies a set of heuristics that attempt to determine the true container page
for each embedded object. We present experimental results in Section 5
demonstrating that these heuristics are effective for accurately measuring
client perceived response time.
For example, suppose that Fj3 in Figure 4 depicts client
Cj downloading buy.html at roughly the same time as index.html
(i.e., t0 � tj). Suppose also that ksniffer knows in advance that
index.html embeds {obj1.gif, obj3.gif, obj8.gif, obj4.gif ,obj2.gif}
and that buy.html embeds {obj1.gif, obj8.gif, obj11.gif}. This means that
both container pages are valid candidates for the true container page of obj1.gif.
Whether or not tr < tq is a crucial indication as to the true container page.
At time ta, when connection Fj2 is being
established, there is no information which could distinguish whether this connection belongs to
index.html or buy.html. The only difference between Fj1, Fj2 and Fj3
with respect to the TCP/IP 4-tuple is the remote client port number. Hence only the client, Cj,
can be identified at time ta, and at time tq, it is unknown whether index.html or
buy.html is the true container page for obj1.gif.
To manage pageviews and their associated embedded objects, ksniffer
maintains three lists of active pageviews for each client, each sorted by
request time, as shown in Figure 5. The loners queue contains
pageviews which represent objects that cannot have embedded objects. These pageviews are
kept in their own list, which is never searched when attempting to locate a container page for a new
embedded object request. All other pageviews, which could potentially embed an
object, are placed on both a FIFO pageview queue and the
pageview hash table. This enables ksniffer to quickly locate the
youngest candidate container page.
Each pageview also maintains an embedded object hash table, not shown
in Figure 5, that consists of the embedded
objects associated with that pageview and state indicating whether and
to what extent they have been downloaded.
Figure 4: Downloading multiple container pages and embedded objects over multiple connections.
The start and end times for embedded object requests are determined
in the same manner as previously described in Sections
3.2 and 3.3.
Each embedded object that is requested is tracked in the same manner
that the container page, index.html, was tracked. For example,
when the second connection is initiated, ksniffer creates a flow
object Fj2 to track the connection, and associates it with
Cj. When the request for obj1.gif on Fj2 is
captured at time tq, a wj,21 object is created for tracking
the request, and is placed onto Fj2's request queue.
To determine the pageview response time, which is calculated as te - t0,
requires correlating embedded objects to their proper container page, which involves tackling
a set of challenging problems. Clients, especially proxies, may be
downloading multiple pageviews simultaneously. It is possible
for a person to open two or more browsers and connect to the
same Web site, or for a proxy to send multiple pageview requests to a
server, on behalf of several remote clients. In either case, there
can be multiple currently active pageview transactions simultaneously
associated with the remote client Cj (e.g., pvj1,
pvj2 ... pvjk). In addition, some embedded objects being requested may appear
in multiple pageviews, and some Web objects may be retrieved from caches or CDNs.
ksniffer applies a set of heuristics that attempt to determine the true container page
for each embedded object. We present experimental results in Section 5
demonstrating that these heuristics are effective for accurately measuring
client perceived response time.
For example, suppose that Fj3 in Figure 4 depicts client
Cj downloading buy.html at roughly the same time as index.html
(i.e., t0 � tj). Suppose also that ksniffer knows in advance that
index.html embeds {obj1.gif, obj3.gif, obj8.gif, obj4.gif ,obj2.gif}
and that buy.html embeds {obj1.gif, obj8.gif, obj11.gif}. This means that
both container pages are valid candidates for the true container page of obj1.gif.
Whether or not tr < tq is a crucial indication as to the true container page.
At time ta, when connection Fj2 is being
established, there is no information which could distinguish whether this connection belongs to
index.html or buy.html. The only difference between Fj1, Fj2 and Fj3
with respect to the TCP/IP 4-tuple is the remote client port number. Hence only the client, Cj,
can be identified at time ta, and at time tq, it is unknown whether index.html or
buy.html is the true container page for obj1.gif.
To manage pageviews and their associated embedded objects, ksniffer
maintains three lists of active pageviews for each client, each sorted by
request time, as shown in Figure 5. The loners queue contains
pageviews which represent objects that cannot have embedded objects. These pageviews are
kept in their own list, which is never searched when attempting to locate a container page for a new
embedded object request. All other pageviews, which could potentially embed an
object, are placed on both a FIFO pageview queue and the
pageview hash table. This enables ksniffer to quickly locate the
youngest candidate container page.
Each pageview also maintains an embedded object hash table, not shown
in Figure 5, that consists of the embedded
objects associated with that pageview and state indicating whether and
to what extent they have been downloaded.
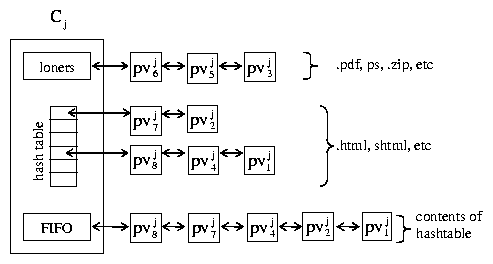 Figure 5: Client active pageviews.
Given a request wj,ki captured on flow Fjk for client Cj,
ksniffer will perform the following actions:
Figure 5: Client active pageviews.
Given a request wj,ki captured on flow Fjk for client Cj,
ksniffer will perform the following actions:
- If wj,ki � {.html, .shtml, ...} ksniffer will treat wj,ki
as a container page by placing it into the pageview hash table (and FIFO queue) for client Cj.
In addition, if a pageview is currently associated with Fjk, ksniffer assumes that pageview is done.
- If wj,ki � {.pdf, .ps, ...} ksniffer will treat wj,ki as a loner object by
placing it on the loner queue for Cj. In addition, if a pageview is currently
associated with Fjk, ksniffer assumes it is done.
- If wj,ki � {.jpg, .gif, ...} then
- If the Referer: field contains the monitored server
name, such as www.ibm.com/buy.html, then Cj's pageview hash table is
searched to locate pvjc, the youngest pageview downloading that container
page (buy.html) that has yet to download wj,ki. If pvjc
exists, wj,ki is associated to pvjc as one of its embedded objects. If no
pageview meets the criterion, pvjc is created and wj,ki is associated to it.
- If the Referer: field contains a foreign host name, such as www.xyz.com/buy.html,
then wj,ki is treated as a loner object.
- If wj,ki has no Referer: field, then the FIFO queue is searched to locate,
pvjc, the youngest pageview which has wj,ki in
its referer pattern
and has yet to download wj,ki. If pvjc exists, then wj,ki is associated to
pvjc as one of its embedded objects. If no pageview meets the criterion, then wj,ki is
treated as a loner object.
The algorithm above is based on several premises. If a request for an
embedded object wj,ki arrives with a referer field containing the monitored server
as the host (e.g., www.ibm.com/buy.html), then the remote browser
almost certainly must have previously downloaded that container page (e.g., buy.html) from
the monitored server (e.g., www.ibm.com), parsed the page, and is now sending the request for the
embedded object wj,ki. If ksniffer failed to capture the request for the container
page (e.g., buy.html) it is highly likely that it is being served from the browser cache for this particular
transaction. If a request for an embedded object arrives with a
referer field containing a foreign host (e.g., www.xyz.com/buy.html), it is highly likely
that the foreign host is simply embedding objects from the monitored Web site into its own pages.
When a request for an embedded object arrives without a referer field, every pageview associated with the
client becomes a potential candidate for the container page of that object. This is depicted in
Figure 4 when the request for obj1.gif arrives without a
Referer: field. If the client is actually a remote proxy, then the number of potential candidates may be
large. ksniffer applies the patterns described in Section 3.4
as a means of reducing the number of potential candidates and focusing on the true container
page of the embedded object. The heuristic is to locate the youngest pageview which contains
the object in its pattern, but has yet to download the object. Patterns are therefore exclusionary. Any
candidate pageview not containing the embedded object in its pattern is excluded from consideration.
This may result in the true container page being passed over, but as
mentioned in Section 3.4, the likelihood that
a container page embeds an object that does not appear in the page's
pattern is very low for an active Web site. If a suitable container pageview is not found, then the
object is treated as a loner object. If a Referer: field
is missing, then most likely it was removed by a proxy and not a browser on the client machine; but
if the proxy had cached the container page during a prior transaction, it is likely
to have cached the embedded object as well. This implies the object is not being requested
as part of a page, but being downloaded as an individual loner object.
If a client downloads an embedded object, such as obj1.gif, it is unlikely that the client will
download the same object again, for the same container page. If an object appears
multiple places within a container page, most browsers will only request it once from the server.
Therefore, ksniffer not only checks if an embedded object is in the pattern for a container page, but also
checks if that instance has already downloaded the object or not.
The youngest candidate is usually a better choice than the oldest candidate.
If browsers could not obtain objects from a cache or
CDN, then the oldest candidate would be a better choice, based on FCFS. Since this is
not the case choosing the oldest candidate will tend to assign an object obj1.jpg to a
container page whose `slot' for obj1.jpg was already filled via an unseen cache hit. This tends
to overestimate response time for older pages. It is more likely that an older page obtained
obj1.jpg from a cache and that the younger page is the true container for obj1.jpg, than vice versa.
ksniffer relies on capturing the last byte of data for the last embedded
object to determine the pageview response time. However, given the
use of browser caches and CDNs, not all embedded objects will be seen by
ksniffer since not all objects will be downloaded directly from the Web server. The
purpose of a cache or CDN is to provide much faster response
time than can be delivered by the original Web server. As a result,
it is likely that objects requested from a cache or CDN will be
received by the client before objects requested from the original
server. If the Web server is still serving the last embedded object
received by the client, other objects served from a cache or CDN will
not impact ksniffer's pageview response time measurement accuracy.
If the last embedded object received by the client is from a cache or
CDN, ksniffer will end up not including that object's download time as
part of its pageview response time. Since caches and CDNs are
designed to be fast, the time unaccounted for by ksniffer
will tend to be small even in this case.
Given that embedded objects may be obtained from someplace other than the server,
and that a pattern for a container page may not be complete, how can ksniffer
determine that the last embedded object has been requested? For example, at time
te, how can ksniffer determine whether the entire download for index.html
is completed, or another embedded object will be downloaded for index.html
on either Fj1 or Fj2? This is essentially the same problem described
at the end of Section 3.3 with respect to whether or not
a embedded objects requests will follow a request for a container page or not.
ksniffer approaches this problem in two ways. First, if
no embedded objects are associated to a pageview after a timeout
interval, the pageview transaction is assumed to be complete.
A six second timeout is used by default, in part based on the
fact that the current ad hoc industry quality goal for complete Web
page download times is six seconds [19]. If a client
does not generate additional requests for embedded objects within
this time frame, it is very likely that the pageview is complete. ksniffer
also cannot report the response time for a pageview
until the timeout expires. A six second timeout is small enough to
impose only a modest delay in reporting.
Second, if a request for a container page, wj,ik, arrives on a
persistent connection Fji, then we consider that all pageview
transactions associated with each prior object, wj,ib, b < k, on
Fji to be complete. In other words, a new container page
request over a persistent connection signals the completion of the
prior transaction and the beginning of a new one. We believe this to
be a reasonable assumption, including under pipelined requests, since in
most cases, only the embedded object requests will be pipelined.
Typical user behavior will end up serializing container page requests
over any given connection. Hence, the arrival of a new container page
request would indicate a user click in the browser associated with
this connection. Taking this approach also allows ksniffer to properly
handle quick clicks, when the user clicks on a visible link before the
entire pageview is downloaded and displayed in the browser.
4 Packet Loss
Studies have shown that the packet loss rate within the Internet is
roughly 1-3% [34].
We classify packet loss into three types:
A) a packet is dropped by the network before being captured by ksniffer,
B) a packet is dropped by the network after being captured and
C) a packet is dropped by the server or client after being captured.
Types A and B are most often due to network congestion or transmission
errors while type C drops occur when the Web server (or, less likely,
the client) becomes temporarily overloaded.
The impact that a packet drop has on measuring response time depends not
only on where or why it was dropped, but also on the contents of the
packet. We first address the impact of SYN drops, then look at how a
lost data packet can affect response time measurements.
Figure 3 depicts the well known TCP connection establishment protocol. Suppose
that the initial SYN which is transmitted at time t0 is either dropped in the network or at the
server. In either case, no SYN/ACK response is forthcoming from the server. The client side
TCP recognizes such SYN drops through use of a timer [27]. If a response is not
received in 3 seconds, TCP will retransmit the SYN packet. If that SYN packet
is also dropped by the network or server, TCP will again resend the same SYN packet, but not until
after waiting an additional 6 seconds. As each SYN is dropped, TCP doubles the wait
period between SYN retransmissions: 3 s, 6 s, 12 s, 24 s, etc.
TCP continues in this manner until either the configured limit of retries is reached, at which
time TCP reports "unable to connect" back to the browser, or the user takes an action to
abort the connection attempt, such as refreshing or closing the browser.
This additional delay has a large impact on the client response time.
Suppose there is a 3% network packet loss rate from client to server. Three percent of the SYN
packets sent from the remote clients will be dropped in the network before reaching
ksniffer or the server. The problem is that since the SYN packets are dropped in the
network before reaching the server farm, both ksniffer and the server are completely
unaware that the SYNs were dropped. This will automatically result in an error for
any traffic monitoring system which measures response time using only those packets
which are actually captured. If each client is using two persistent connections to
access the Web site, this error will be 180% for a 100 ms response time and
a 4.5% error for a 4s response time. Under HTTP 1.0 without Keep-Alive, where a connection is opened to obtain
each object, the probability of a network SYN drop grows with the number of objects
in the pageview. For a page download of 10 objects, there is a 30% chance of incurring the
3 second retransmission delay, a 60% chance for 20 objects and a 90% chance for 30 objects.
ksniffer uses a simple technique for capturing this undetectable connection
delay (type `A' SYN packet loss). Three counters are kept for each subnet. One of the
three counters is incremented whenever a SYN/ACK packet is retransmitted from the server to the client
(which indicates that the SYN/ACK packet was lost in the network). The counter that gets
incremented depends on how many times the SYN/ACK has been transmitted. Every time a SYN/ACK is sent twice,
the first counter is incremented, every time a SYN/ACK packet is sent 3 times, the second counter is
incremented, and every time a SYN/ACK is sent 4 times, the third counter is incremented.
Whenever a SYN packet arrives for a new connection, if one of the three counters
is greater than zero, then ksniffer subtracts the appropriate amount of time
from the start time of the connection and decrements the counter (round robin is used to break ties).
Assuming that a SYN packet will be dropped as often as a SYN/ACK, this gives ksniffer a reasonable
estimate for the number of connections which are experiencing a 3 s, 9 s, or 21 s connection delay.
The same retransmission delays are incurred when SYNs are dropped by the server (type `C'). In this case, ksniffer
is able to capture and detect that the SYNs were dropped by the server, and distinguish these connection
delays, which are due to server overload, from those previously described, which are due to network
congestion. ksniffer also determines when a client is unable to connect to the server. If the
client reattempts access to the Web site in the next six seconds after a connection failure,
ksniffer considers the time associated with the first failed connection attempt as part of the connection
latency for the reattempt; otherwise the failed connection attempt is reported under the category
"frustrated client".
Similar undetected latency occurs when a GET request is dropped in the
network before
reaching ksniffer or the server, then retransmitted by the client. An
undetected GET request drop
differs from an undetected SYN drop in two ways. First, unlike SYN drops,
TCP determines the retransmission timeout
period based on RTT and a number of implementation dependent parameters.
ksniffer implements the standard RTO calculation [28] using Linux TCP parameters, and adjusts for this undetectable time in the same manner as mentioned
above. Second, a dropped GET request will only affect the
measurement of the overall pageview response time if the GET request is for
a container page and is not the first request over the connection.
Otherwise, the start of the transaction will be indicated by the start of
connection establishment, not the time of the container page request.
As mentioned earlier, ksniffer often expects to capture the packet containing the
sequence number of the last byte of data for a particular request. To
capture retransmissions, ksniffer uses a timer along with the finish queue on each flow
to capture retransmitted packets and update the end of response time appropriately.
Suppose the last packet of a response is captured by ksniffer at time tk,
at which point ksniffer identifies it as containing the sequence number for the
last byte of the response, and moves the wj,ik request object from the
flow's request queue to the flow's finish queue. The packet is then dropped in the network before
reaching the client (type `B'). At time tk+h, ksniffer will capture the retransmitted packet
and, using its sequence number, determine
that it is a retransmission for wj,ik, which is located
on the finish queue. The completion time of wj,ik is then set to the timestamp of this packet.
5 Experimental Results
We implemented ksniffer as a set of Linux kernel modules and installed
it on a commodity PC to demonstrate its accuracy and performance under
a wide range of Web workloads. We report an evaluation of ksniffer
in a controlled experimental setting as well as an evaluation
of ksniffer tracking user behavior at a live Internet Web site.
Our experimental testbed is shown in Figure 6.
We used a traffic model based on Surge [3] but made some
minor adjustments to reflect more recent work
[14,31] done on characterizing Web traffic: the
maximum number of embedded objects in a given page was reduced from
150 to 100 and the percentage of base, embedded, and loner objects
were changed from 30%, 38% and 32% to 42%, 48% and 10%,
respectively. The total number of container pages was 1041, with 959
unique embedded objects. 49% of the embedded objects are embedded by
more than one container page. We also fixed a bug in the modeling
code and included CGI scripts in our experiments, something not
present in Surge.
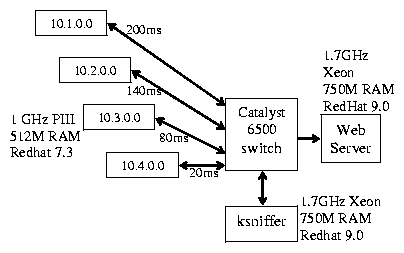 Figure 6: Experimental environment.
For traffic generation, we used an updated version of WaspClient
[25], which is a modified version of the client provided
by Surge. Virtual clients on each machine cycle through a series of
pageview requests, first obtaining the container page then all its
embedded objects. A virtual client can open 2 parallel TCP
connections for fetching pages, mimicking the behavior of Microsoft
IE. Requests on a TCP connection are serialized, so
that the next request is not sent until the current response on that
connection is obtained. In addition, each virtual client binds to a
unique IP address using IP aliasing on the client machine. This lets
each client machine appear to the server as a collection of up to 200
unique clients from the same subnet.
To emulate wide-area conditions, we extended the rshaper
[30] bandwidth shaping tool to include packet loss
and round trip latencies. We installed this software on each client
traffic generator machine, enabling us to impose packet drops as well
as the RTT delays between 20 to 200 ms as specified in Figure
6.
To quantify the accuracy of the client perceived response times
measured by ksniffer, we ran fifteen different experiments with
different traffic loads under non-ideal and high-stress operating
conditions and compared ksniffer's measurements against those obtained
by the traffic generators executing on the client
machines. We measured with two different Web servers,
Apache and TUX, used both HTTP 1.0 without Keep-Alive and persistent
HTTP 1.1, and included a combination of static pages and CGI programs
for Web content. We also measured in the presence of network and
server packet loss, missing referer fields, client caching, and near
gigabit traffic rates.
Table 1 summarizes these experimental results.
In all cases, the difference between the mean response time as
determined by ksniffer, and that measured directly on the
remote client was less than 5%. Furthermore, the absolute time
difference between ksniffer and client-side instrumentation was in
some cases less than 1 ms and in all cases less than 50 ms.
Figure 6: Experimental environment.
For traffic generation, we used an updated version of WaspClient
[25], which is a modified version of the client provided
by Surge. Virtual clients on each machine cycle through a series of
pageview requests, first obtaining the container page then all its
embedded objects. A virtual client can open 2 parallel TCP
connections for fetching pages, mimicking the behavior of Microsoft
IE. Requests on a TCP connection are serialized, so
that the next request is not sent until the current response on that
connection is obtained. In addition, each virtual client binds to a
unique IP address using IP aliasing on the client machine. This lets
each client machine appear to the server as a collection of up to 200
unique clients from the same subnet.
To emulate wide-area conditions, we extended the rshaper
[30] bandwidth shaping tool to include packet loss
and round trip latencies. We installed this software on each client
traffic generator machine, enabling us to impose packet drops as well
as the RTT delays between 20 to 200 ms as specified in Figure
6.
To quantify the accuracy of the client perceived response times
measured by ksniffer, we ran fifteen different experiments with
different traffic loads under non-ideal and high-stress operating
conditions and compared ksniffer's measurements against those obtained
by the traffic generators executing on the client
machines. We measured with two different Web servers,
Apache and TUX, used both HTTP 1.0 without Keep-Alive and persistent
HTTP 1.1, and included a combination of static pages and CGI programs
for Web content. We also measured in the presence of network and
server packet loss, missing referer fields, client caching, and near
gigabit traffic rates.
Table 1 summarizes these experimental results.
In all cases, the difference between the mean response time as
determined by ksniffer, and that measured directly on the
remote client was less than 5%. Furthermore, the absolute time
difference between ksniffer and client-side instrumentation was in
some cases less than 1 ms and in all cases less than 50 ms.
| Virtual Clients | Web Server | HTTP | PV/s | URL/s | Mbps | Client RT | ksniffer RT | diff | % diff | elapsed time |
| A | 120 | Apache | 1.0 | 5-140 | 5-625 | 1-60 | 1.528s | 1.498s | -29ms | -1.9 | 133m |
| B | 120 | Apache | 1.0 | 5-160 | 10-660 | 1-60 | 1.513s | 1.483s | -30ms | -2.0 | 133m |
| C | 120 | Apache | 1.1 | 10-180 | 30-730 | 3-70 | 1.003s | 0.981s | -22ms | -2.2 | 79m |
| D | 120 | Apache | 1.1 | 10-400 | 40-1520 | 3-140 | 0.726s | 0.699s | -27ms | -3.7 | 72m |
| E | 800 | TUX | 1.0 | 65-750 | 260-3000 | 15-270 | 1.556s | 1.506s | -49ms | -3.2 | 20m |
| F | 800 | TUX | 1.1 | 125-1370 | 500-5300 | 35-455 | 0.815s | 0.782s | -33ms | -4.1 | 11m |
| G | 500 | Apache | 1.0 | 35-500 | 140-2000 | 10-200 | 1.537s | 1.489s | -48ms | -3.1 | 32m |
| H | 400 | Apache | 1.1 | 60-690 | 250-2880 | 15-250 | 0.792s | 0.825s | -33ms | -4.0 | 22m |
| I | 500 | Apache | 1.1 | 60-700 | 260-3000 | 20-265 | 0.884s | 0.929s | -45ms | -4.8 | 18m | |
| S1 | 16 | TUX | 1.0 | 1909 | 8,007 | 690 | 7.8ms | 7.7ms | -0.17ms | -2.2 | 210s |
| S2 | 80 | TUX | 1.1 | 2423 | 10,164 | 878 | 30.5ms | 29.7ms | -0.83ms | -2.7 | 165s | |
| V | 800 | TUX | 1.0 | 0-2410 | 0-10,000 | 0-850 | 0.574s | 0.571s | -3ms | -0.5ms | 29m | |
| O1 | 800 | Apache | 1.0 | 419 | 1756 | 152 | 1.849s | 1.806s | -42ms | -2.3ms | 16m |
| O2 | 240 | Apache | 1.1 | 728 | 3054 | 264 | .328s | .318s | -10ms | -3.1ms | 9m | |
| X | 800 | Apache | 1.0 | 2174 | 9120 | 462 | .365s | .363s | -1.7ms | -0.5ms | 184s |
Table 1: Summary of results.
All tests (except Tests S1 and S2) were done under non-ideal conditions
found in the Internet with 2% packet loss and 20% missing referer
fields. Each client requested the same sequence of pageviews, but since
each traffic generator machine was configured with a different RTT to
the Web server as shown in Figure 6, the clients took
different amounts of time to obtain all of their pages, resulting in
a variable load on the Web server over time. For example, Figure
7 shows results from Test F comparing ksniffer
against client-side instrumentation in measuring pageviews/s
over time. There are two lines in the figure, but they are hard to
distinguish because ksniffer's pageview count is so close to direct
client-side instrumentation.
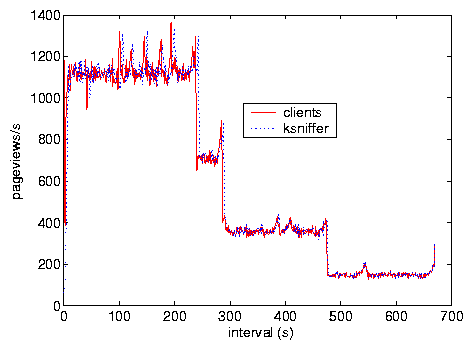 Figure 7: Test F, pageviews.
Figure 8 shows results from Test F comparing
ksniffer against client-side instrumentation in measuring mean client
perceived pageview response time for each 1 second interval. ksniffer
results are very accurate and hard to distinguish from client-side
instrumentation. As indicated by Figure 7, the
variable response time is due to the completion of clients. During
the initial 250 s, clients from each of the four subnets are
actively making requests. At around 250 s, the clients from subnet
10.4.0.0 with RTT 20 ms have completed, while clients from the other
subnets remain active. At around 300 s, the clients from subnet
10.3.0.0 with RTT of 80 ms have completed, leaving clients from subnets
10.2.0.0 and 10.1.0.0 active. At time 475 s, clients from subnet
10.2.0.0 with RTT of 140 ms have completed, leaving only those clients
from subnet 10.1.0.0 with RTT of 200 ms. Note that, although the
pageview request rate decreases, the mean response time increases
because the remaining clients have larger RTTs to the Web server and
thus incur larger response times.
Figure 7: Test F, pageviews.
Figure 8 shows results from Test F comparing
ksniffer against client-side instrumentation in measuring mean client
perceived pageview response time for each 1 second interval. ksniffer
results are very accurate and hard to distinguish from client-side
instrumentation. As indicated by Figure 7, the
variable response time is due to the completion of clients. During
the initial 250 s, clients from each of the four subnets are
actively making requests. At around 250 s, the clients from subnet
10.4.0.0 with RTT 20 ms have completed, while clients from the other
subnets remain active. At around 300 s, the clients from subnet
10.3.0.0 with RTT of 80 ms have completed, leaving clients from subnets
10.2.0.0 and 10.1.0.0 active. At time 475 s, clients from subnet
10.2.0.0 with RTT of 140 ms have completed, leaving only those clients
from subnet 10.1.0.0 with RTT of 200 ms. Note that, although the
pageview request rate decreases, the mean response time increases
because the remaining clients have larger RTTs to the Web server and
thus incur larger response times.
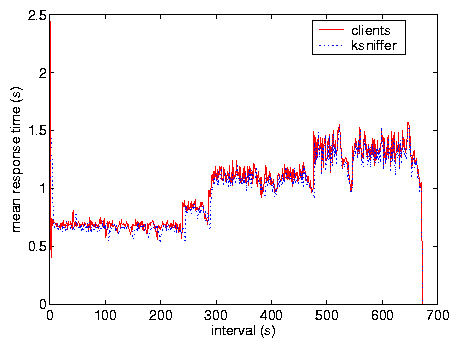 Figure 8: Test F, response time.
Table 2 shows results for Test C obtained by
implementing a longest prefix matching algorithm based on
[5] in ksniffer to categorize RTT and response time
on a per subnet basis. These results show that
ksniffer provides accurate pageview response times as compared to
client-side instrumentation even on a per subnet basis when different
subnets have different RTTs to the Web server. ksniffer RTT
measurements are also very accurate as compared to the actual RTT used
for each subnet. The results show how this mechanism can be very
effective in differentiating performance and identifying problems across
different subnets.
Figure 8: Test F, response time.
Table 2 shows results for Test C obtained by
implementing a longest prefix matching algorithm based on
[5] in ksniffer to categorize RTT and response time
on a per subnet basis. These results show that
ksniffer provides accurate pageview response times as compared to
client-side instrumentation even on a per subnet basis when different
subnets have different RTTs to the Web server. ksniffer RTT
measurements are also very accurate as compared to the actual RTT used
for each subnet. The results show how this mechanism can be very
effective in differentiating performance and identifying problems across
different subnets.
| subnets | RTT | Client RT | ksniffer RT | diff | % diff | ksniffer RTT |
| 10.1.0.0 | 200ms | 1.424s | 1.391s | -33ms | -2.3 | 199.8ms |
| 10.2.0.0 | 140ms | 1.099s | 1.073s | -26ms | -2.4 | 139.8ms |
| 10.3.0.0 | 80ms | 0.824s | 0.806s | -18ms | -2.3 | 79.7ms |
| 10.4.0.0 | 20ms | 0.666s | 0.656s | -10ms | -1.6 | 19.9ms |
Table 2: Mean RT per subnet, Test C.
Tests S1 and S2 were done under high bandwidth conditions to show
results at the maximum bandwidth rate possible in our testbed. This
was done by using the faster TUX Web server and by imposing no
packet loss or network delay. For HTTP 1.1, 80 virtual clients
generated the greatest bandwidth rate, but under HTTP 1.0 only 16
clients generated the highest bandwidth rate. ksniffer is within 3%
of client-side measurements, even under rates of 690 Mbps and 878 Mbps
of HTTP content. The absolute time difference between ksniffer and
client response time measurements was less than 1 ms. We note that
the resolution of the packet timer on ksniffer is only 1 ms, due
to the Linux clock timer granularity.
Under HTTP 1.0 without Keep-Alive, each object retrieved requires its
own TCP connection. The TCP connection rate under Test S1 was
8,000 connections/s. The results demonstrate ksniffer's
ability to track TCP connection establishment and termination at
high connection rates.
Test V was done with severe variations in load alternating between no load and
maximum bandwidth load by switching the clients between on and off modes
every 50 s. Figure 9 compares ksniffer
response time with that measured at the client, and Figure
10 compares the distribution of the response time.
This indicates ksniffer's accuracy under extreme variations in load.
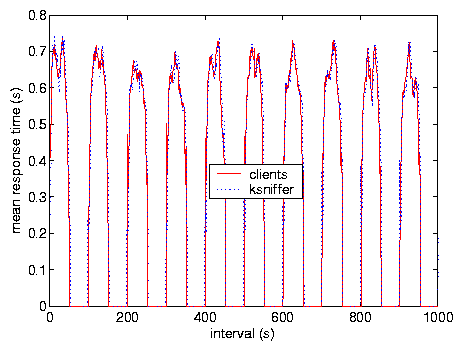 Figure 9: Test V, response time.
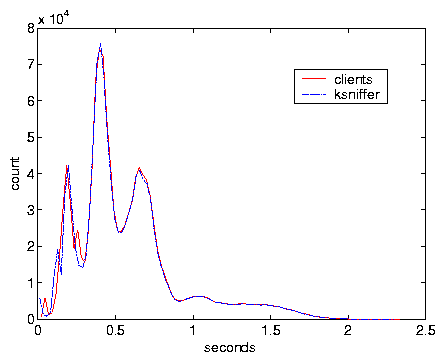 Figure 10: Test V, RT distribution.
Tests O1 and O2 were done with the Web server experiencing overload
and therefore dropping connections. We configured Apache to support
up to 255 simultaneous connections, then started 240 virtual clients.
Since each client opens two connections to the server to obtain a container
page and its embedded objects, this overwhelmed Apache.
During Test O1 and O2, the Web server machine reported a connection failure rate of 27% and 12%,
respectively. Table 1 shows that ksniffer's
pageview response time for these tests were only 3%
less than those from the client-side. These results show
ksniffer's ability to measure response times accurately in the
presence of both server overload and network packet loss
Test X was done to show ksniffer performance with caching clients by
modifying the clients so that 50% of the embedded objects requested
were obtained from a zero latency local cache. Figure
11 compares ksniffer and client-side instrumentation
in measuring pageview response time over the course of the experiment.
The results show that ksniffer can provide very accurate response time
measurements in the presence of client caching as well.
Figure 10: Test V, RT distribution.
Tests O1 and O2 were done with the Web server experiencing overload
and therefore dropping connections. We configured Apache to support
up to 255 simultaneous connections, then started 240 virtual clients.
Since each client opens two connections to the server to obtain a container
page and its embedded objects, this overwhelmed Apache.
During Test O1 and O2, the Web server machine reported a connection failure rate of 27% and 12%,
respectively. Table 1 shows that ksniffer's
pageview response time for these tests were only 3%
less than those from the client-side. These results show
ksniffer's ability to measure response times accurately in the
presence of both server overload and network packet loss
Test X was done to show ksniffer performance with caching clients by
modifying the clients so that 50% of the embedded objects requested
were obtained from a zero latency local cache. Figure
11 compares ksniffer and client-side instrumentation
in measuring pageview response time over the course of the experiment.
The results show that ksniffer can provide very accurate response time
measurements in the presence of client caching as well.
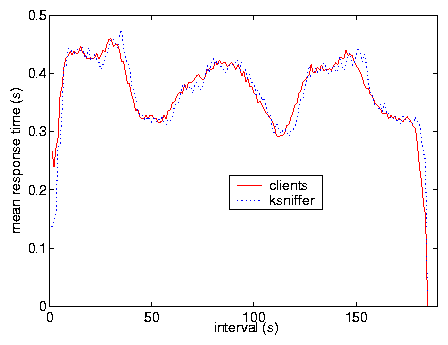 Figure 11: Text X, response time.
We deployed ksniffer in front of a live Internet Web site, GuitarNotes.com, which is hosted in NYC.
Figure 12 depicts results for tracking a single user during a logon
session from Hawthorne, NY. Using MS IE V6, and beginning with an empty browser cache,
the user first accessed the home page and then visited a dozen pages within
the site including the product review section, discussion forum, FAQ, classified ads,
and performed several site searches for information. This covered a range of static and
dynamically generated pageviews. The number of embedded objects for each page varied between 5 and 30,
and is indicated by the dotted line, which is graphed against the secondary Y axis on the right. These
objects included .gif, .css and .js objects.
Figure 11: Text X, response time.
We deployed ksniffer in front of a live Internet Web site, GuitarNotes.com, which is hosted in NYC.
Figure 12 depicts results for tracking a single user during a logon
session from Hawthorne, NY. Using MS IE V6, and beginning with an empty browser cache,
the user first accessed the home page and then visited a dozen pages within
the site including the product review section, discussion forum, FAQ, classified ads,
and performed several site searches for information. This covered a range of static and
dynamically generated pageviews. The number of embedded objects for each page varied between 5 and 30,
and is indicated by the dotted line, which is graphed against the secondary Y axis on the right. These
objects included .gif, .css and .js objects.
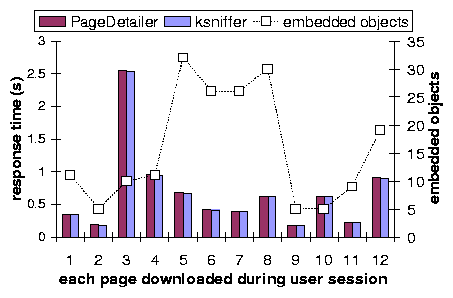 Figure 12: Live Internet Web site.
PageDetailer [15] was executing on the client machine
monitoring all socket level activity of IE. PageDetailer uses a Windows socket probe to
monitor and timestamp each socket call made by the browser: connect(), select(), read() and write().
By parsing the HTTP requests and replies, it is able to determine the response time
for a pageview, as well as for each embedded object within a page. The pageview response time
is calculated as the difference between the connect() system call entry and the
return from the read() system call for the last byte of data of the last embedded object.
As shown in Figure 12, the response time which ksniffer calculates in NYC at the Web server is
nearly identical to that measured by PageDetailer running on the remote client machine.
For each of the twelve pages downloaded by the client, ksniffer is within 5% of the response
time recorded by PageDetailer.
ksniffer provides excellent performance scalability
compared to common user-space passive packet capture systems.
Almost all existing passive packet capture systems in use today are
based on libpcap [33]. Libpcap is a user space library
that opens a raw socket to provide packets to user
space monitor programs. As a scalability test, we wrote a
libpcap based traffic monitor program whose only function
was to count TCP packets. Executing on the same physical machine as
ksniffer, the libpcap packet counter program began
to drop a large percentage of packets when the traffic rate was
roughly 325 Mbps. In contrast,
ksniffer performs complex pageview analysis at near gigabit traffic
rates without such packet loss.
Figure 12: Live Internet Web site.
PageDetailer [15] was executing on the client machine
monitoring all socket level activity of IE. PageDetailer uses a Windows socket probe to
monitor and timestamp each socket call made by the browser: connect(), select(), read() and write().
By parsing the HTTP requests and replies, it is able to determine the response time
for a pageview, as well as for each embedded object within a page. The pageview response time
is calculated as the difference between the connect() system call entry and the
return from the read() system call for the last byte of data of the last embedded object.
As shown in Figure 12, the response time which ksniffer calculates in NYC at the Web server is
nearly identical to that measured by PageDetailer running on the remote client machine.
For each of the twelve pages downloaded by the client, ksniffer is within 5% of the response
time recorded by PageDetailer.
ksniffer provides excellent performance scalability
compared to common user-space passive packet capture systems.
Almost all existing passive packet capture systems in use today are
based on libpcap [33]. Libpcap is a user space library
that opens a raw socket to provide packets to user
space monitor programs. As a scalability test, we wrote a
libpcap based traffic monitor program whose only function
was to count TCP packets. Executing on the same physical machine as
ksniffer, the libpcap packet counter program began
to drop a large percentage of packets when the traffic rate was
roughly 325 Mbps. In contrast,
ksniffer performs complex pageview analysis at near gigabit traffic
rates without such packet loss.
6 Related Work
There are a number of approaches
currently being taken to address the problem of obtaining
response time in the context of Web services. A number of companies
[8,20,24,32]
provide active probing of a Web site by periodically measuring response times
at a geographically distributed set of monitors. There are
several limitations with this approach. First, no real Web traffic
by the actual clients is measured; only the response time for
transactions generated by the monitors are reported. Second, any
approach based on coarsed-grained sampling may suffer from statistical
biases. Third, monitors are limited to performing transactions that
do not affect other users or modify state in backend databases. For
example, it would be unwise to configure a monitor to actually
purchase an airline ticket or trade stock on an open exchange.
Fourth, the information gathered by monitors is generally not
available at the Web server in real-time, limiting the ability of a
Web server to respond to changes in response time to meet delay bound
guarantees. Lastly, CDN providers are known to place servers near
monitors used by these companies to artificially improve their own
performance measurements [7].
A second approach involves instrumenting Web pages with client-side
scripting that gathers client response time statistics
[29]. This approach can be used to track
actual client transactions. However, client-side scripting
is a `post-connection' approach and therefore does not account for delays due to
TCP connection setup or waiting in kernel queues on the Web server,
which can be significant when network and server resources are overloaded. Client-side
scripting cannot be applied to non-HTML files that cannot be
instrumented, such as PDF and Postscript files. It may also not work
for older browsers or browsers with scripting capabilities disabled,
such as mobile devices. Client browser measurements cannot accurately decompose the response
time into server and network components, providing no
insight into whether server or network providers are responsible
for problems.
A third approach requires the Web server to track when requests arrive
and complete service, either at the application-level
[2,18,21,22]
or at the kernel-level [27]. This approach has the
desirable properties that it only requires information available at
the Web server and can be used for non-HTML content. However,
application-level approaches do not account for network interactions or
delays due to TCP connection setup or waiting in kernel queues on the
Web server. Previous results demonstrate that application-level
Web server measurements can under estimate response time by more than
an order of magnitude [27]. Two of the authors of
this paper previously developed Certes [27], a
kernel-level approach that accounts for TCP connection setup time and
time spent waiting in kernel queues in measuring response time at a
per connection level. ksniffer extends this work by measuring
response time per pageview without any modifications to the Web
server.
A fourth approach is to simply log network packets to disk, and then use the
log files to reconstruct the client response time
[1,4,9,11,12].
This kind of analysis is performed offline, using multiple passes and limited to analyzing only
reasonably sized log files [31].
ksniffer's correlation algorithm differs from EtE [11] in
that it does not require multiple passes and offline operation, uses
file extensions and refer host names in addition to the filename in
the refer field, handles multiple requests for the
same Web page from the same client, and accounts for connection setup
time and packet loss in determining response time.
[9] describes many of the issues involved in
TCP/HTTP reconstruction, but does not consider the problem of measuring response time.
Other approaches exist which can provide mechanisms for filtering and
analyzing packet traces online, such as GigaScope
[6], Nprobe [12],
NetQoS [26], libpcap [33], and BPF
[23]. However, these systems do not provide any
higher-level functionality to determine pageview response times from
live Web traffic. Most of this work has focused on improving packet
filtering performance, which is not particularly applicable when all traffic into and
out of a Web server is of interest, rather than a narrow subset.
Note that ksniffer shares certain limitations that are present in all network
traffic monitors. Response time components due to processing on the
remote client machines cannot be directly measured from server-side network
traffic. Examples include times for DNS query resolution and HTML
parsing and rendering on the client. Embedded objects obtained
from locations other than the monitored servers may have an impact on
accuracy as well, but only if their download completion
time exceeds that of the last object obtained from the monitored server.
7 Conclusions and Future Work
We have designed, implemented and evaluated ksniffer, a kernel-based
traffic monitor that can be colocated with Web servers to measure
their performance as perceived by remote clients in real-time.
As a passive network monitor, ksniffer requires no changes to clients
or Web servers, and does not perturb performance in the way that
intrusive instrumentation methods can. ksniffer determines client
perceived pageview response times using novel, online mechanisms that
take a "look once, then drop" approach to packet analysis to
reconstruct TCP connections and learn client pageview activity.
We have implemented ksniffer as a set of loadable Linux kernel modules
and validated its performance using both a controlled experimental
testbed and a live Internet Web site. Our results show that ksniffer's
in-kernel design scales much better than common user-space approaches,
enabling ksniffer to monitor gigabit traffic rates using only commodity
hardware, software, and network interface cards. More importantly,
our results demonstrate ksniffer's unique ability to accurately measure
client perceived response times even in the presence of network and
server packet loss, missing HTTP referer fields, client caching, and
widely varying static and dynamic Web content.
Future work includes integrating ksniffer with a
cluster management system and developing mechanisms that manage
resources to achieve specified response time goals. Such a management system would base
resource allocation decisions on the response time as perceived by the remote client
instead of the response time as reported by other means. This may raise some interesting
scheduling and allocation problems, particularly in the context of resource constrained
Web sites. We expect to combine machine learning techniques with models of TCP/IP
and client behavior to achieve our goals.
8 Acknowledgements
This work was supported in part by NSF grants ANI-0117738 and ANI-0240525 and an IBM SUR Award.
Our thanks to Srini Seshan for his help with the rshaper traffic tool, and to Gong Su
for sharing his system expertise.
References
- [1]
-
M. K. Aguilera et al.
Performance Debugging for Distributed Systems of Black Boxes.
In SOSP '03, p. 74-89, Lake George, NY, October 2003.
- [2]
-
J. Almeida, M. Dabu, A. Manikutty, and P. Cao.
Providing Differentiated Levels of Service in Web Content Hosting.
In Workshop on Internet Server Performance (WISP), Madison, WI, 1997.
- [3]
-
P. Barford and M. Crovella.
Generating Representative Web Workloads for Network and Server
Performance Evaluation.
In ACM SIGMETRICS, p. 151-160, Madison, WI, November 1998.
- [4]
-
R. Caceres et al.
Measurement and Analysis of IP Network Usage and Behavior.
IEEE Communications Magazine, 38(5), May 2000.
- [5]
-
T. Chiueh and P. Pradhan.
High Performance IP Routing Table Lookup using CPU Caching.
In IEEE INFOCOMM, v 3, p. 1421-1428, 1999.
- [6]
-
C. Cranor et al.
Gigascope: A Fast and Flexible Network Monitor.
Technical Report TD-5ABQY6, AT&T Labs-Research, Floram Park, NJ,
May 2002.
- [7]
-
P. Danzig.
Ideas for Next Generation Content Delivery.
In NOSSDAV 2001, http://www.nossdav.org/2001/
keynote\_nossdav2001.ppt,
Port Jefferson, NY,
June 2001. ACM.
- [8]
-
Exodus.
http://www.exodus.com/.
- [9]
-
A. Feldmann.
BLT: Bi-layer Tracing of HTTP and TCP/IP.
In WWW-9, p. 321-335, May 2000.
- [10]
-
R. Fielding et al.
Hypertext Transfer Protocol HTTP 1.1.
In IETF RFC 2616. June 1999.
- [11]
-
Y. Fu, L. Cherkasova, W. Tang, and A. Vahdat.
EtE: Passive End-to-End Internet Service Performance
Monitoring.
In USENIX 2002, p. 115-130, Monterey, CA, June 2002.
- [12]
-
J. Hall, I. Pratt, and I. Leslie.
Non-intrusive Estimation of Web Server Delays.
In Proceedings of the IEEE Conference on Local Computer Networks
(LCN), Tampa, Florida, November 2001.
- [13]
-
J. Hay, W. Feng, , and M. Gardner.
Capturing Network Traffic with a MAGNeT.
In 5th Annual Linux Showcase and Conference (ALS), p. 61-70, Oakland,
California, November 2001.
- [14]
-
F. Hernandez-Campos, K. Jeffay, and F. D. Smith.
Tracking the Evolution of Web Traffic: 1995-2003.
In MASCOTS 2003, p. 16-25, Orlando, FL, October 2003.
- [15]
-
IBM AlphaWorks.
Page Detailer,
http://www.alphaworks.ibm.com/tech/pagedetailer.
- [16]
-
P. Joubert et al.
High-Performance Memory-Based Web Servers: Kernel and User-Space
Performance.
In USENIX 2001, p. 175-188, Boston, MA,
June 2001.
- [17]
-
M. F. Kaashoek et al.
Application Performance and Flexibility on Exokernel Systems.
In SOSP, Saint-Malo, France, Oct. 1997.
- [18]
-
V. Kanodia and E. Knightly.
Multi-Class Latency-Bounded Web Services.
In IEEE/IFIP IWQoS, Pittsburgh, PA, June
2000.
- [19]
-
T. Keeley.
Thin, High Performance Computing over the Internet.
In MASCOTS 2000, p. 407, San Francisco, CA, Aug. 2000.
- [20]
-
KeyNote.
http://www.keynote.com.
- [21]
-
K. Li and S. Jamin.
A Measurement-Based Admission-Controlled Web Server.
In IEEE INFOCOMM, p. 651-659, New
York, NY, June 2002.
- [22]
-
C. Lu, T. Abdelzaher, J. Stankovic, and S. H. Son.
A Feedback Control Approach for Guaranteeing Relative Delays in Web
Server.
In 7th IEEE Real-Time Technology and Applications Symposium,
p. 51-62, Taipei, Taiwan, June 2001.
- [23]
-
S. McCanne and V. Jacobson.
The BSD Packet Filter: A new Architecture for User-Level Packet Capture.
In USENIX 1993,
p. 259-270, 1993.
- [24]
-
Mercury Interactive.
http://www-heva.mercuryinteractive.com.
- [25]
-
E. Nahum, M. Rosu, S. Seshan, and J. Almeida.
The Effects of Wide-Area Conditions on WWW Server Performance.
In ACM SIGMETRICS, p. 257-267, Cambridge, MA, June 2001.
- [26]
-
NetQoS.
http://www.NetQoS.com.
- [27]
-
D. Olshefski, J. Nieh, and D. Agrawal.
Using Certes to Infer Client Response Time at the Web Server.
ACM Transactions on Computing Systems, February 2004.
- [28]
-
V. Paxson and M. Allman.
Computing TCP's Retransmission Time.
In IETF RFC 2988. November 2000.
- [29]
-
R. Rajamony and M. Elnozahy.
Measuring Client-Perceived Response Times on the WWW.
In Proceedings of the 3rd USENIX Symposium on Internet
Technologies and Systems (USITS), San Francisco, CA, March 2001.
- [30]
-
A. Rubini.
rshaper.
http://www.linux.it/~rubini/software/index.html.
- [31]
-
F. D. Smith, F. H. Campos, K. Jeffay, and D. Ott.
What TCP/IP Protocol Headers can tell us about the Web.
In ACM SIGMETRICS, p. 245-256, Cambridge, MA, June 2001.
- [32]
-
StreamCheck.
http://www.streamcheck.com.
- [33]
-
The libpcap project.
http://sourceforge.net/projects/libpcap.
- [34]
-
Y. Zhang, N. Duffield, V. Paxson, and S. Shenker.
On the Constancy of Internet Path Properties.
In In Proceedings of ACM SIGCOMM Internet Measurement Workshop
(IMW), San Francisco, CA, November 2001.
|
