Empirical Analysis on Energy Efficiency of Flash-based SSDs
Euiseong Seo Seon Yeong Park Bhuvan Urgaonkar |
This paper analyzes the power consumption patterns and the energy efficiency of flash-based SSDs using microbenchmarks for raw I/Os as well as macrobenchmarks with two different filesystems for real-world workloads. We believe that this research will help discover more energy-efficient ways of using flash-based SSDs.
Hard disk drives(HDDs) have been used as a primary storage device and have been improving continually in capacity as well as performance. However, their poor random access still remains a significant bottleneck for the overall throughput of many computing systems. Flash memory has come to the forefront in the last few years as a strong candidate for the primary storage medium due to its better energy efficiency and faster random access.
Flash based SSDs(SSDs) use flash memory as their storage medium and emulate the external I/O interfaces of conventional HDDs. Therefore, they can be used in existing computing systems without any modifications and are rapidly broadening their share in the storage market, especially for laptops and mobile devices[9].
The energy consumption of traditional HDDs arises from mechanical as well as electronic parts. However, because SSDs have no mechanical parts and the flash memory in them has low power consumption, most of their energy consumption occurs due to their electronic components.
Understanding the power consumption of SSDs is important to utilize them in an energy-efficient way. With such knowledge, we can transform a workload into a more energy-efficient one (e.g., reordering read and write operations for better energy efficiency).
This paper analyzes the power consumption patterns of SSDs with both micro and macro benchmarks. Micro-benchmarks show the characteristics for read and write operations in device levels and macro-benchmarks show the real-world behavior of the storage devices. We also use two different filesystems for macro-benchmarks and analyze the resulting energy consumption as well as performance.
The remainder of this paper is organized as follows. We provide a background of flash-based SSDs in Section 2. Our measurement and analysis results are presented in Section 3. We conclude our study and suggest future direction in Section 4.
A page is a basic unit of read and write in flash memory. Data written on a page should be erased before being rewritten. However, the unit size of the erase operation is different from that of read and write. Usually a block, the unit of an erase operation, is 128KB while a page is 2KB. Therefore, flash memory needs the Flash Translation Layer(FTL) to provide the illusion of a normal block device to conventional systems.
Many FTL schemes such as page-mapping[3], block-mapping[7], and log-block mapping[5] have been investigated. However, considering the limitations of processor performance and memory capacity, variants of block-mapping are currently popular.
Although mapping algorithms in the SSDs vary depending on the underlying FTL schemes, random writes are much slower than sequential writes in general[1, 4]. Due to the fact that random writes occur on pages scattered over multiple blocks, garbage collection operations involve more blocks than those under sequential writes for the same amount of write. Therefore, a larger number of blocks need to be erased and more valid page copying is necessary.
As shown in Figure 1, flash memory has a few electronic components and some of them are not in the HDDs or are different from their HDD counterparts[9].
Because most of the FTL algorithms imply repetitive search operations over large entries and manipulation of large quantities of data, SSDs usually equip stronger embedded processors or ASICs than HDDs and they are a significant source of working power consumption.
The memory used for FTL management can vary greatly depending on the capacity of the SSD and the FTL algorithm. With currently popular block-mapping FTLs, the size would be a few hundred KB and that will not contribute significantly to overall power consumption significantly. However, page-mapping FTLs generally require a few tens of MB of memory to work with and it would be an important factor for the SSD, especially in idle state.
It is expected that these differences induce different power characteristics in SSDs from those of the HDDs and analyzing the difference is the context of our research.
In our empirical study, we use three different SSDs and two different HDDs with different hardware configurations. Table 1 shows all the devices and their key characteristics1. The throughput values in the table are not the measured values but are from the vendor specifications.
Table 1: Specifications of the storage devices used in our work
SSD1 SSD2 SSD3 HDD1 HDD2 Model MSP-7000 FSD32GB25M SSD2-1C32G WD1600BEKT Raptor X Manufacturer MTron Super Talent OCZ Western Digital Western Digital Form Factor 2.5 in. 2.5 in. 2.5 in. 2.5 in. 3.5 in. Flash Type / RPM 4-Way SLC SLC 4-Way MLC 7,200 10,000 Capacity 16 GB 32 GB 32 GB 160 GB 150 GB Rd. / Wr. Throughput (MB/s) 120 / 90 60 / 45 143 / 93 NA / NA NA / NA
SSD1 is a high-end SSD drive with high sustained throughput. SSD2 is one of the first-generation SSDs for the mass market which are slow but inexpensive. SSD3 is a MLC flash memory-based-SSD. MLC flash memory has poorer lifetime than SLC flash memory. However, because MLC flash memory is less expensive than SLC flash memory and has comparable performance in read operations it is getting popular in mass market SSD products.
HDD1 is one of the fastest laptop drives, which are usually sold as an aftermarket component for performance upgrades. HDD2 is a desktop HDD which has the highest RPM among commodity HDDs using a SATA interface at this time.
Our host system uses an AMD Athlon 64 X2 4800+ processor and an Nvidia nForce Chipset. We test two filesystems, ext2 and Log-structured Filesystem(LFS) to study power consumption differences due to the overlying filesystem. Since the implementation of LFS we use was done in Linux 2.6.17.4, we use the LFS-patched Linux 2.6.17.4 kernel in all our experiments.
Power consumption is measured with a Signametrics SM2040 Digital PCI Multimeter, which is able to acquire power value once every 1 ms.. We measured the power from the +5V and +12V power lines in the SATA power cables connected to the target disks.
The idle power is an important factor along with the working power for affecting the battery life in laptops. We measure the power consumption of each storage device for 10 minutes without sending any requests. Although significantly lower than that of HDD2, the power consumptions of SSD1 and SSD2 are comparable to or higher than that of HDD1, as shown in Table 2.
Assuming that the power consumption of the embedded processor and the system board is comparable for all the SSDs, the size of the equipped memory is an important factor to determine the idle power of an SSD. With a simple experiment, we verify that SSD1 has more than 16MB of write buffer, while SSD3 does not have any write buffer (like many other inexpensive SSDs) and that could be one of the reasons for the low idle power consumption of SSD3. Because of its low idle power, although we could not verify it, we suspect that SSD3, which also does not have the write buffer, uses a block-mapping FTL, which requires a few hundreds times less memory.
To measure the performance and power consumption characteristics for various patterns of I/O operations, we implemented a workload generator called DIO Tool.It measures the completion time of read and write operations to block devices. It uses the direct I/O interface provided by the Linux kernel to measure throughput without any effect from the operating system buffer cache.
We employ four categories of I/O operations ; sequential read, random read, sequential write, and random write. In each category we changed the request size.
The throughput of the HDDs has little difference between read and write. Both the size of the request and the randomness are critical factors that affect throughput. However, SSDs have similar performance for all the operations except random writes.
Each result for write operation in Figure 2 is the sustained throughput. The throughput difference between the random write and the sequential write persists even for the requests of 16MB size. This means that changing the offset in consecutive write requests requires significant temporal overhead. SSD3 has the biggest difference between the random write and the sequential write and the slow erase speed of MLC flash chips seems a reason for that big difference.
With the SSDs, we found big gaps between the random write throughput from the specification and the measurement. Generally, SSDs have larger flash memory than their marketed capacity to spare free blocks or log blocks for improving the write performance by reducing the chance of garbage collection during the burst period. However, after writing over all those free or log blocks, the SSDs can not avoid garbage collections, which are required for making erasable blocks.
Figure 3 shows the time-series of power consumption and throughput of SSD3 for a burst random write period. In this experiment, we issue 4MB random writes continually until the cumulative size of those requests reach 1GB. Until the cumulative size of the processed requests reaches about 330MB, the throughput for each request is similar to that of sequential requests of the same size. Also, even after handling all requests, the power consumption of SSD3 periodically hit the double of its idle power. Based on this observation, we can tell that the SSD prepares free or log blocks larger than 300MB during the idle period and it takes a few minutes.
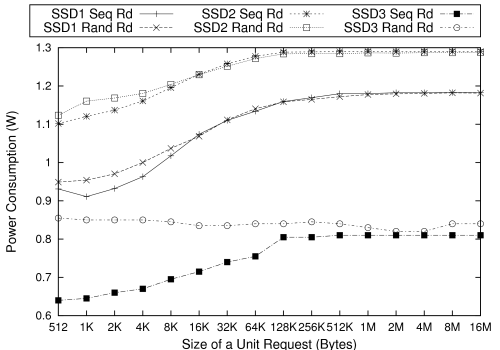
As shown in Figure 4 SSDs consume similar power for random and sequential read operations.The power consumption grows as the throughput grows. On the contrary, the power consumption for write operations shows a dramatic difference between random and sequential operations.
The power demand for sequential write increases as well as the throughput to both read operations. The amount of increased power is due to the increased transferring operation. However, random write requires the power as much as the maximum power consumption of each device all the time, regardless to the request size. Only SSD1 has increased power consumption for the requests of size over 1MB. That is because the increase of the transfer power starts to exceed the decreased power consumption for changing offset in the random writes with size beyond a certain point.
Both the high power consumption and the low throughput of random write induces low energy efficiency. As shown in Figure 5 the required energy to write randomly the same amount of data is higher with SSD2 and SSD3 than HDD1 and the energy efficiency of SSD3 is even worse than HDD2. SSD1 also does not show clear superiority in energy efficiency over HDD1.
Random write is better in energy efficiency than random read with HDDs when the request size is small because the read-ahead for small random reads expends more energy without any performance gain and the head movement2 is dramatically reduced with write buffering and write reordering for random writes. However, random read in the SSDs shows dramatically better energy efficiency than the HDDs and each value for the random read of an SSD was similar to the value for the sequential read of each device.
The energy efficiency of sequential access was similarly good with all the devices and was under 1 Joule/MB in most cases. Also, we could verify that the energy efficiency increases as the size of the request increases.
Considering the results from Figure 4 and Table 2 we can also tell that the increased parallelism of flash memory access is not a dominant factor in determining the power consumption of the SSD. This is a contradictory result to the HDD of which the increased RPM induces the increase of power consumption for the spindle motor as well as the increase of the performance[2].
The operations at the block-device level largely depend on the type of filesystem. By using LFS, we can expect better energy efficiency for the same workload that has many random writes because LFS transforms random writes into sequential writes using its log file.
However, in LFS, sequential reads to a file that has been updated many times is transformed into multiple random reads in the log file. This is one of the weak points that have impeded LFS to be used as a general filesystem because read over a file occurs more frequently than write in typical cases.
We use filebench[8], which is a benchmark framework to emulate various filesystem workloads, on both filesystems of LFS and ext2. The workload models are varmail and modified fileserver.
varmail simulates the filesystem workload of mail servers or news servers. The average size of write requests is 16KB and the average file size is 128KB. The read to write ratio is 1:1 and the total file set size is about 1.5GB. The write requests in this workload are small and random. Therefore, this workload is a representative example for which LFS performs better than ext2.
fileserver simulates a file server. We modify the original fileserver workload shipped in filebench to reveal the defect of LFS. Each file of which the average size is 8MB is written sequentially one by one and updated about 30 times by random writes of 16KB average size. The total fileset size is about 8GB. Subsequently, 50 reader threads simultaneously read them in a sequential manner. The performance and the power consumption is measured only for the reading stage.
Although the sustained performance as well as the energy efficiency of random write with SSD3 is the worst, the throughput and the energy efficiency of varmail on ext2 is better than SSD2 and both HDDs because the performance is boosted by using spare free blocks, as illustrated in Figure 3. With this result, we can tell that preparing large free blocks during the idle period is definitely a better solution to improve the write performance in some cases than using the write buffer when the idle power is important.
Although the power consumption is more than four times lower than HDD2, the energy efficiency of SSD2 in varmail is a little lower than that of HDD2 with ext2 filesystem and even worse with LFS because of its poor throughput.
The throughput as well as the energy efficiency of fileserver with LFS on the HDDs is significantly decreased from the throughput with ext2. However, there is no significant difference between those two filesystems on the SSDs.
This paper analyzed the power consumption patterns of the SSDs having different hardware configurations to the various atomic operations and the combination of filesystems and workloads.
Although our analysis was done with a small set of the SSDs, we found that there are common characteristics shared by the SSDs and significant differences between the SSDs and the HDDs.
Based on our observations we are developing an energy-efficient filesystem for a hybrid storage system, which consists of a traditional hard disk and a flash memory device.
This document was translated from LATEX by HEVEA.