
| ||||||||||||||||||||||||||||||||||||||||||||||||||||
|
LISA 2001 Paper
[LISA '01 Tech Program Index]
Macroscopic Internet Topology and Performance Measurements From the DNS Root Name ServersAbstractWe describe active measurements of topology and end-to-end latency characteristics between several of the DNS root servers and a subset of their clients using the skitter tool developed by CAIDA. We gather a sample of clients for each monitored DNS root server, combine these samples into a common target list and then actively probe these targets and analyze their connectivity. We identify the subsets of destinations that have large latency connections to all instrumented root name servers and discuss their geographical make-up. Our goal is to build an analytical framework for evaluating the optimality of root server placement and its impact on the efficiency of the DNS service. The skitter tool and the methodology we propose can also be used for monitoring the end-to-end performance in large networks and for assessing the optimality of web servers placement in general. IntroductionThe Domain Name System (DNS)The Domain Name System (DNS) provides name resolution, that is mapping between host names and IP addresses [8]. The DNS is an enormously important service used by virtually all internetworking software, including e-mail and web browsers. In essence, DNS is a distributed database that a) allows local control of its segments; b) makes data in each segment available across the entire network using a client-server scheme [9]. Robustness and adequate performance are achieved by replication and caching.
Programs called name servers constitute the server half of the DNS client-server mechanism; each name server is responsible (authoritative) for its own piece of the database. Clients (resolvers) create queries and send them across the network to name servers. A query process starts when an end user application program contacts a local name server to resolve a host name. If the local name server does not have this name cached, it queries a root server and gets a referral to a name server who should know the answer. The local name server recursively follows referrals until it gets an answer. The most popular implementation of the DNS specifications is the Berkeley Internet Name Domain (BIND) software [10]. The DNS protocol handling requests to name servers and their responses is described in RFC-1034 [8]. The process of name resolution is transparent to an end user, but may contribute significantly to an overall delay of establishing connection. Huitema and Weerahandi [11] found that name resolution delays exceeded two seconds in nearly a third of their trial cases. They attributed this poor performance to the flat structure of the domain name space and to name servers overloading. They also found that some of the root servers exhibited unacceptably high loss rates. In this paper we study the relationship between the geographical distribution of DNS clients and latencies of their connections to the root servers. Our goal is to understand whether the overall performance of the DNS can be improved if existing root servers are re-arranged to bring them topologically closer to certain groups of clients. This problem is also closely related to the question of where additional root servers should be deployed in order to provide maximum service improvement to worldwide Internet users. The Root Server SystemRoot name servers (currently, 13 total), are an essential part of the Internet infrastructure. Each name server is responsible for a portion of the naming hierarchy tree that is used to translate host names into IP addresses. The root servers are the first to be queried when a client's name server does not have a requested host name in its cache. A typical load is 5000-8000 queries per second and it appears to scale linearly with traffic [12]. Table 1 below shows the current locations and controlling organizations of the existing root name servers. The Root Server Selection Advisory Committee (RSSAC) is the DNS root server technical advisory committee for the Internet Corporation for Assigned Names and Numbers (ICANN). One of RSSAC's responsibilities is to provide ICANN with recommendations regarding optimal locations for root name servers (both existing and future ones). RSSAC has asked CAIDA for assistance gathering measurement data to help determine such architecturally strategic locations. The problem is two-fold:
We have developed a methodology for identifying and depicting sets of destinations that appear to have consistently large latency connections to all instrumented name root servers. This methodology, if applied at all current and potential future root server locations, can be useful for answering RSSAC's needs. CAIDA's skitter MeasurementsCAIDA uses the skitter tool [1] to actively measure connectivity and performance of the network between root servers and a subset of their clients. skitter sends a small packet to a target host and records the forward IP path traveled and the round trip time (RTT) required to reach that host. CAIDA skitter monitors probe many thousands of destinations several times per day, thus providing data on topology and end-to-end latency characteristics between the skitter host and its target destinations. We deployed the first root server skitter monitor co- located with the F root name server in August 1999. This monitor probed a target list of F's clients gleaned from a tcpdump on the F's network. In June 2000, we began monitoring the E and L root name servers using corresponding lists of their clients. By October 2000 we had deployed three more skitter monitors: one co- located with the A and J roots, one at the K root, and one at the K peer (RIPE, Amsterdam) servers. Monitoring of the M root in Tokyo began in January 2001. We hope to place monitors at roots B, D, G, H and I in the near future. J is currently co-located with A and so does not require its own monitor. As of August 2001, the C root server had not yet responded to RSSAC's request to host a skitter monitor at their site. CAIDA also has carried out passive measurements of the root and top-level-domain (gTLD) servers [13]. Brownlee, et al., used two traffic meters located at UC San Diego and captured the number of requests sent to each of the 13 root name servers and 11 gTLD servers, their response time, and the loss rate. They examined the long-term behavior of the name server system and proposed a model of Internet congestion based on these experimental data. Target ListsThe DNS Clients ListInitially, each skitter monitor used its own probe list made up of its own clients. However, if each skitter monitor uses a different probe list, it is difficult to either compare results or to draw global conclusions. We needed to create a global target list that would in some sense stratify the routable Internet (IPv4) address prefix space. We proposed to achieve such representative coverage by including a destination from each routable IP prefix in a new target list. In September 2000, when we built our current DNS Clients, there were nearly 90,000 globally routable prefixes [2]. We created the September 2000 DNS Client destination list from two sources:
From the data gathered statically at each root server location by tools such as tcpdump or cflowd, we culled 49,374 IP addresses that belonged to different routable prefixes. If many client IP addresses were from the same routable prefix, we chose the host that we observed querying the root server most often. Though an imperfect weighting of the client population, this method allows us to focus on a single client list that reasonably reflects global Internet connectivity to the instrumented root servers. To increase prefix coverage, we added addresses from our other skitter destination lists [3]. These addresses, which now comprise about 15% of the DNS Clients list, are probably not local name servers but rather hosts on a network that either have or may in the future have a name server. Therefore, data quantifying performance of root servers for these future potential DNS-root client networks are also relevant for our project. As we deploy additional skitter boxes at other root servers and obtain their local client destination lists, we will merge these addresses into the global list. In particular, if a particular prefix is represented by an IP address from our other non-DNS-client lists and we find another host in that prefix in a local DNS client list, we will replace the initial placeholder host with this latter IP address. Characteristics of the DNS Clients ListThe current DNS Clients list contains more than 58,000 IP destinations, covering 8406 origin Autonomous Systems (ASes) and 184 countries. Table 2 shows the top ten top level domains, origin ASes, and countries represented in this target list. Note that some of our lists have deliberately tried to include hosts from as many different countries as possible at the expense of proportional representativeness of per-country connectivity. This bias may linger in the DNS Client list to the extent that it draws on those other lists.
We determine the top level domain with a reverse DNS lookup to find the host name associated with the IP address. Note that of the 58,000 IP addresses on the current list, more than 21,000 do not have PTR records and therefore their host names are unresolvable. We determined the origin AS for a given IP address via the BGP routing tables from RouteViews [2] snapshot from 4 April 2001, by finding the longest matching routing prefix and then noting which AS advertised that route. CAIDA's NetGeo tool [4], [14] estimates the geographical location of the IP addresses. This procedure may be imprecise, particularly for hosts at an ISP's site. If a site does not have a 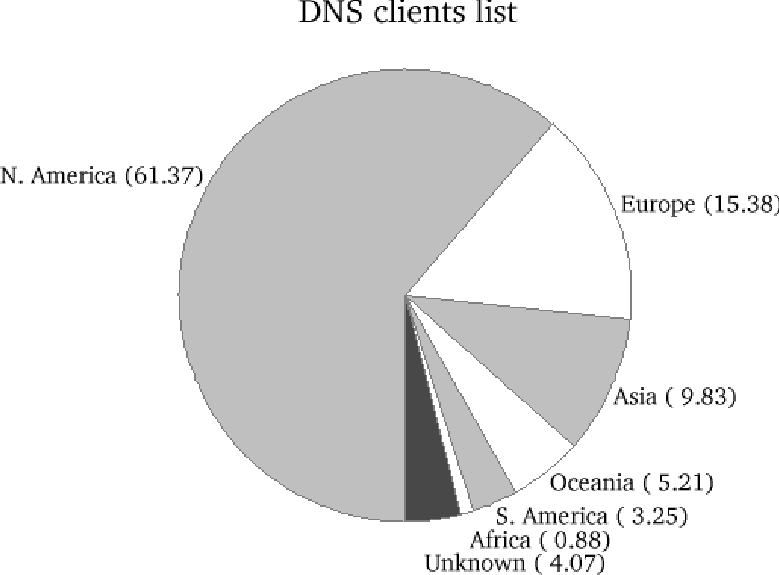
DNS LOC record and does not include geographical hints in a host naming scheme, then NetGeo relies upon whois entry which usually refers to company headquarters. This, in turn, is not necessarily reflective of the actual geographical location of the host. Figure 3 shows the distribution of targets by continent. We have used the combined DNS Clients list since the fall of 2000 on the skitter monitors at the root server locations. Figure 4 shows the exact dates when we began probing this list from each root server skitter host. Issues with the DNS Clients ListThere are important advantages to using the same list on each root server skitter monitor. A common list serves as a yardstick against which we can compare characteristics of the different root server networks. Stratifying the IPv4 space by probing as many routable prefixes as possible yields a representative macroscopic view of Internet topology from root server locations. Note that the list is also geographically diverse and thus allows us to explore the dependence of RTT on the geographical location of a destination. We recognize that the geography is among the primary factors determining the latency of Internet connections and have explored geographic and topological correlations with performance in more detail [5, 6]. By measuring the same destination list simultaneously from each root server, we can identify a group of destinations that show high latency from all monitored root servers. High latency could be due to the bottleneck bandwidth along the path to the target host often at the last hop or due to an unfavorable topological location of the target host relative to the root servers. If a set of such high latency destinations clusters either geographically or topologically and does not have systematic regional bandwidth problems or other political constraints, it might be a candidate region that merits a new root server. An apparent disadvantage of monitoring the merged DNS Clients list is that we cannot use these data to decide how well a particular root server responds to its own specific clients. This problem arises due to an internal BIND load balancing feature [10]. There is a code in all recent versions of BIND that causes name servers to intelligently select among alternative queryable root servers. BIND measures the round trip time for each of multiple answers from candidate servers and sorts these values into groups based on the observed values of RTT. It directs subsequent queries to servers in the closest group, in a round robin fashion. As a result, a name server close in performance terms to a particular root server will query that server most often, only occasionally querying other servers that are further away. However, we know which destinations in our list were frequent clients of which particular root server, and can use local subsets of the DNS client lists to study individual server-specific issues. Results and AnalysisIn this section we analyze two sets of data, 30 days long each. We collected the first set of traces between December 1, 2000 and December 30, 2000, and the second one between March 6 and April 4, 2001. In both sets, we used the same DNS Clients list on all DNS root server skitter monitors. However, there are two important differences between the sets.
MeasurementsEach monitor probes destinations in the DNS Clients list between seven and 13 times per day. The frequency of sampling depends on processing capabilities of skitter hosts and also decreases somewhat when the network is congested. In each cycle through the list, skitter probes usually reach between 31,000 and 33,000 destinations. The number of unique destinations reached during weekdays in our March, 2001 measurements ranges from 36,000 to 33,000 and dips during the weekends (see Figures 5 and 6). 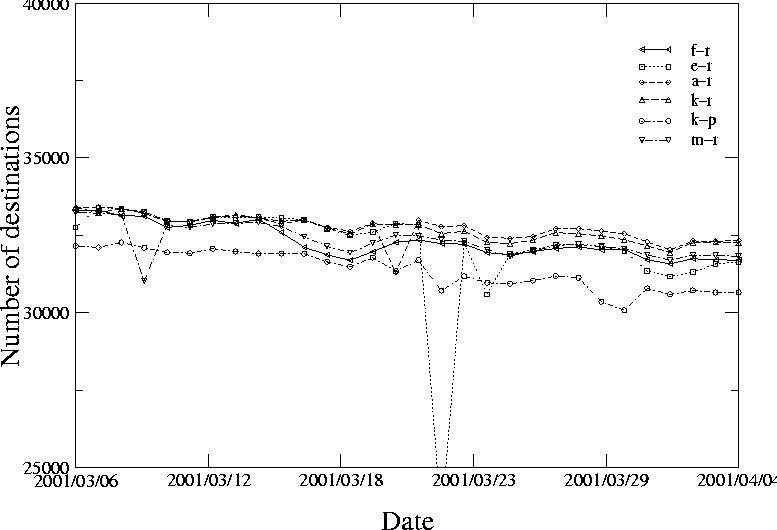 Comparison of the daily number of replying destinations in the December 2000 and March 2001 data confirms an overall declining trend apparent in Figure 6. We found that the loss rate of target hosts from the DNS Clients list is (1.8+-0.2)% per month. Destinations may stop replying to skitter ICMP probes for a variety of reasons (firewalls, internal changes of IP addresses in businesses, etc.). We plan to expurgate non-replying destinations from our target list and to replenish it with new destinations again gathered statically from the root servers. Our goal remains to represent each globally routable IP prefix in the updated DNS Clients list. Note that the number of such prefixes continues to grow and is now greater than 100,000. 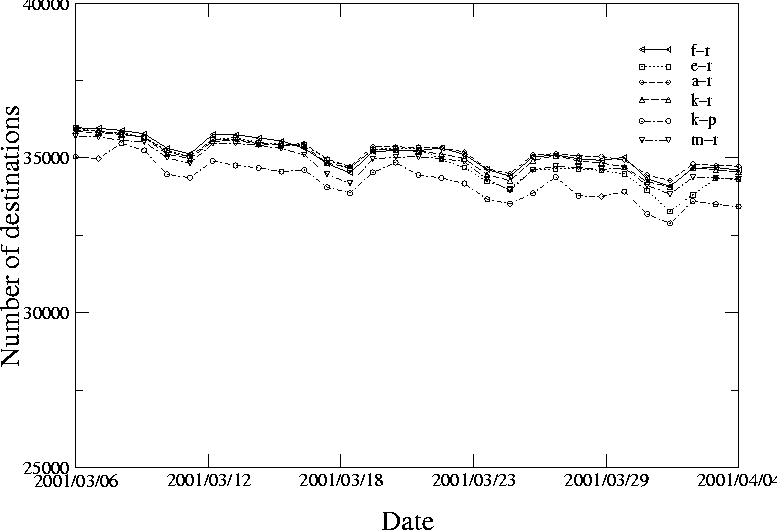 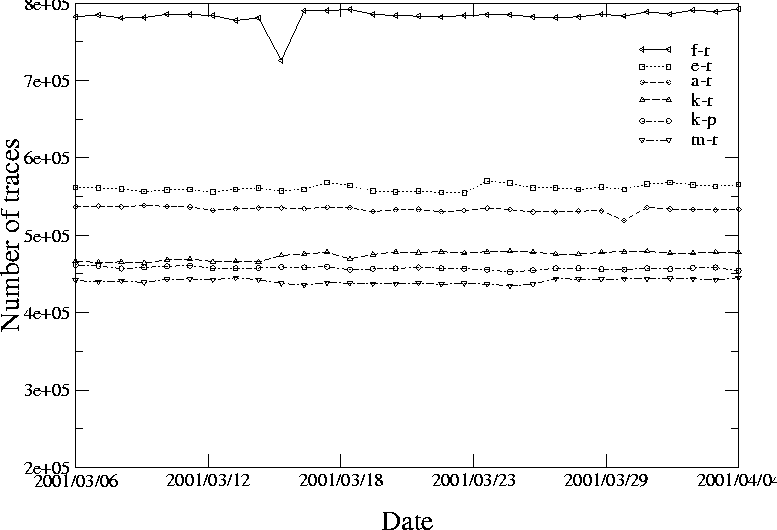 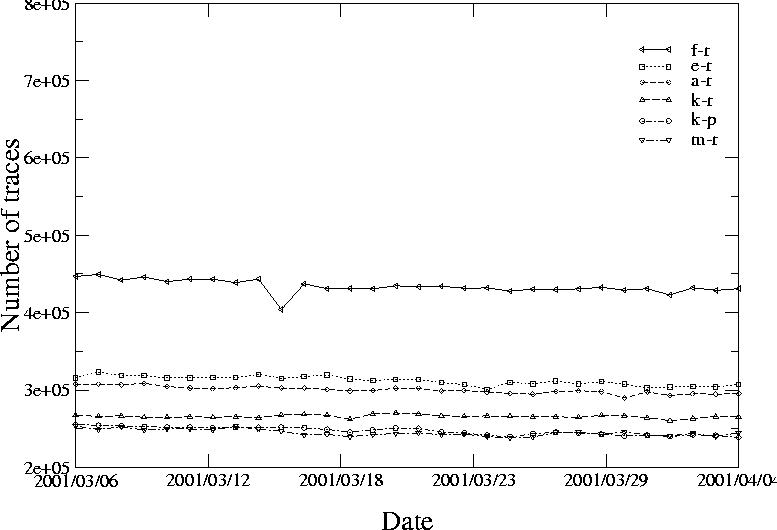 skitter monitor records RTTs to replying destination hosts. If intermediate hops along the path failed to answer skitter probes, but the final destination still responded, we included such a responding but incomplete path in our analysis. Each CAIDA skitter host sends between 450,000 and 800,000 probe packets per day and collected between 250,000 and 450,000 replies during the course of our measurements (see Figures 7 and 8). We analyze two metrics of connectivity: hop count and round trip time from the root name server to the hosts in the target set. IP (layer 3) hop count is a natural connectivity metric that characterizes topological proximity of a skitter source to its target set of destinations. 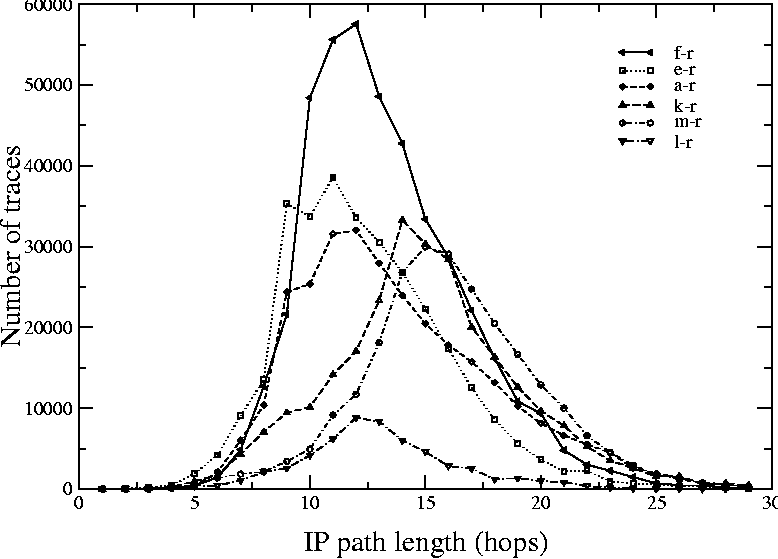 Figure 9 shows IP hop count distributions for the six root server skitter monitors that ran the DNS Clients list on April 4, 2000. E, F and L are in California; A is in the Washington DC area, K is in the United Kingdom, M is in Japan. The curves are not normalized; the y-axis shows the actual number of probes (highest for the F monitor, lowest for the L monitor). The L skitter monitor had consistently fewer complete probes per cycle than others, suggesting problems with its local connectivity. Since February 2001 its connectivity has been intermittent. The x-axis value that corresponds to the peak of the distributions (the mode) depends primarily on two parameters: the geographical distribution of the targets in the list and the connectivity of the skitter source. The peak positions for A, E, F, and L root server monitors (all in the US) indicate that they are near the edge of their local networks and/or near a major exchange point. The IP hop count distributions for the K-root monitor (in the United Kingdom) and for the M-root monitor (in Japan) are shifted to the right, implying that these monitors are further away from most of the DNS Clients list destinations (unsurprising, since the list is heavily dominated by North American destinations). The IP hop count distribution for K-peer is rather similar to the one for K-root and is not shown in the figure. Values of RTT (i.e., latency), observed in skitter data depend on the geographic and topological position of the skitter monitor with respect to the destinations it probes. Latency also depends on the conditions of the Internet along paths to those destinations (congestion, routing instabilities, etc.). We found that RTTs exhibit significant diurnal and weekly variations. Internet paths tend to be less congested on weekends, when RTTs to all destinations drop considerably from their weekday values. 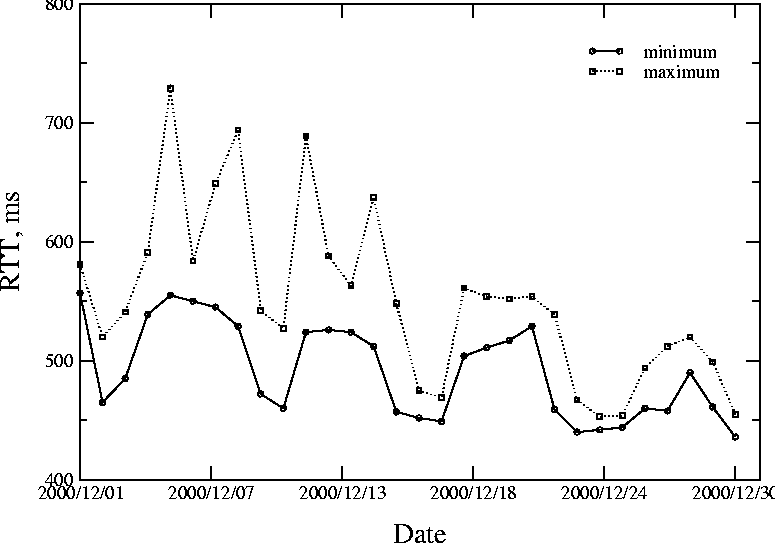 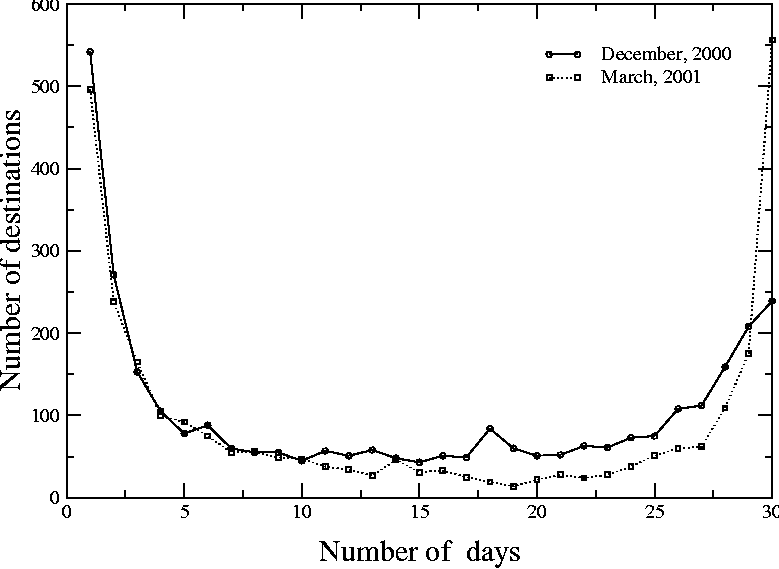 Large LatenciesClusters of hosts that have particularly large latencies as measured from all root name server skitter monitors suggest a potential deficiency in the current Internet infrastructure. A large latency could be due to the location of the roots relative to the client or due to the local connectivity of the client. In order to identify target hosts that have high latency from the set of currently monitored root servers, we analyzed the daily distributions of RTTs seen by root server skitter monitors. In each probe cycle we consider the value of RTT to a destination as large if it is above the 90th percentile of the overall RTT distribution for this cycle. Typically, large RTTs are longer than 500 ms, sometimes as high as 1000 ms. It is necessary to deal with the RTT distributions in each cycle separately because of large diurnal variations in the state of networks (more congested during the business hours, less congested at night). Figure 10 illustrates the daily and monthly variability of the 90th percentile values observed by the skitter monitor co-located with the F-root server. The graph shows that the maximum value of the 90th percentile of RTT distributions observed in a day of the data can be as much as 1.5 times higher then the minimum value. A significant decrease in overall network latency during the weekends and/or holidays is also clearly seen. We then define a destination as having large latency during a given day if on that day it had large RTTs in at least half the cycles on all root server monitors. We increase the statistical robustness of our results by aggregating them on a monthly basis to ignore transient problems that are repaired relatively quickly. Figure 11 shows how many destinations had large latency and for how many days during the thirty day periods starting on December 1, 2000 and on March 6, 2001. The first (left-side) maximum in both curves is due to the random variations in connectivity that caused a number of destinations to have large latencies for a day or two. The second (right-side) maximum reflects destinations that consistently have large latency on every (or almost every) day during the corresponding period. We then selected the destinations that had large latency for at least 24 days during the period of measurements (974 of them in December, 1051 of them in March) and mapped them to their origin ASes and to their countries/continents. Figure 12 shows these data organized by origin AS, that is, the AS advertising routing information to the Internet. Each AS listed represents more than 1% of the large latency subset. Of the 7882 origin ASes represented in the DNS Clients list, 282 ASes were associated with the large latency destinations we found in December 2000. In March 2001, the corresponding numbers were 8406 and 316. Figure 13 displays the same data sorted by country. Of the 184 countries represented in the DNS Clients list, 105 and 114 contained high latency destinations in December 2000 and in March 2001, correspondingly. Each country listed in Figure 13, contributes more than 1% of this large latency subset. We see the following changes between the December and March analysis:
Figure 14 compares the make-up by continent of the DNS clients list and of the two large-latency subsets. Percents shown include all the data, not just the values listed in Table 15. It is clear that the general geographical pattern of large latency destinations remains nearly the same in both samples. As expected, monitoring our target list from the M root location caused the number of large latency destinations in Asia to decrease: from 274 (28.1% of the subset in December) to 247 (23.5% of the subset in March). At the same time, the number of large latency destinations in South America increased: from 166 (17.0%) to 260 (24.7%). There are two possible explanations for this. The connectivity to South America may have deteriorated since the first sample. Alternatively, the apparent degradation we see may result from not having the L root server monitored in the second sample.
To differentiate between these two possibilities, we analyzed the December 2000 data set with paths from the L skitter monitor excluded. The total number of large latency destinations increased from 974 to 1050, with the number for each continent increasing proportionally. If it were the L-root name server site that primarily provided lower RTTs to South American destinations, then exclusion of these data would cause an unproportional increase of this continent share in the large latency subset. We do not observe this. We thus hypothesize that the increase observed in the March 2001 data is not caused by the lack of the L-root data, but rather reflects an actual (although, possibly temporary) change in connectivity. Figure 14 shows that Africa, Asia, and South America IP addresses account for over 60% of the observed large latency destinations, but less than 14% of the total client list. The exact numbers are: 15% versus 0.9% for Africa, 26% versus 9.8% for Asia, and 21% versus 3.3% for South America (averages of the both data sets). The African destinations have the highest relative increase across the two data sets. Does this mean that a new root server should be placed there? Before we can draw any conclusions about the cause of the large latency responses, we must measure the bottleneck bandwidth to these large latency destinations to ensure that the last hop across a slow modem link is not the primary cause of the delay. It is also possible that incompleteness of our monitoring infrastructure somewhat skews the results. For example, we see that the proportion of large latency destinations in Asia decreased when we included the data obtained with a skitter box co-located with the M root server in Tokyo. The deployment of skitter monitors near other root servers and augmenting our target list with their clients is likely to change at least some of the results reported here.
Conclusions and Future WorkCAIDA's skitter measurements can be used with local client lists to analyze topology and performance characteristics of the network between a root name server and its typical clients. Other placement issues, such as distance to the edge of the local network, peering relationships, choice of upstream transit providers, are visible from the graphs provided by the daily summaries generated automatically from each skitter monitor's data [7]. skitter measurements with the combined DNS clients list can identify clients that have large latency to each of the current root server locations being monitored. To minimize bias with respect to large latency 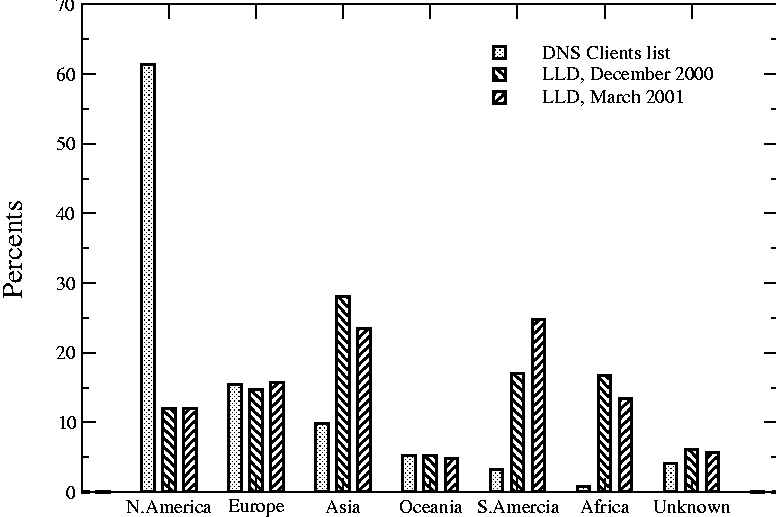 destinations, measurements need to include monitoring from all 13 root servers. We hope that the remaining root operators will soon be hosting skitter monitors, which do not interfere with name server operation at all. We would like to thank those root operators who have hosted our monitors. Further examination with other tools are needed to determine the primary cause of the large latency. If we can eliminate sites that have low client bandwidth at the end of the path, we will have a subset of destinations that can guide the selection of new sites for root servers. We suggest that any site under consideration for a root server could run a skitter monitor for at least six months using the augmented DNS clients list as well as the large latency clients list to determine performance characteristics of the network between the proposed name server site and its potential clients. Issues such as distance to the edge of the local network, rich peering relationships, and adequate upstream transit from multiple providers are good prerequisites to choosing potential sites. Note that placement of new root servers should also take into consideration prospects of advancing Internet growth. Therefore more than just current large latency destinations should be considered in selecting potential new root server sites. Empirical data gathered from macroscopic performance measurements across large segments of the IPv4 topology provide valuable input into the decision process. In addition, a model that simulates geographic patterns of the Internet use should be developed, tested and applied to predict future DNS needs and trends in root server usage. We believe that our methodology and results are also applicable to many common problems such as optimizing web server placement or monitoring the performance of a particular network. In the latter case, if the bandwidths are known, then monitoring the RTTs to hosts of the network with the skitter tool (or similar) will immediately identify a poorly connected subset of the network. AcknowledgmentWe are grateful to the root server operators who have cooperated in installation, configuration, and data collection at their sites. The authors thank Evi Nemeth and Daniel Plummer for their help with finishing this manuscript. We highly appreciate the insightful comments and constructive suggestions made by anonymous reviewers and by our shepherds Mark Burgess and Frode Sandness. This work was supported by DARPA NGI Cooperative Agreement N66001-98-2-8922 and by the NSF ANIR grant NCR-9711092. Author InformationMarina Fomenkov is an Internet traffic researcher for the distributed Cooperative Association for Internet Data Analysis (CAIDA), and a research scientist at the University of California's San Diego Center for Astrophysics and Space Sciences. She is developing algorithms for analyzing skitter active analysis traffic data. Marina received her M.S. in Experimental Nuclear Physics from Moscow Institute of Physics and Technology, and her Ph.D. in Engineering and Data Processing Systems from Moscow Space Research Institute. Reach her electronically at marina@ipn.caida.org. kc claffy is a principal investigator for CAIDA, and a resident research scientist based at the University of California's San Diego Supercomputer Center. kc's research interests include Internet workload/performance data collection, analysis and visualization, particularly with respect to commercial ISP collaboration/cooperation and sharing of analysis resources. kc received the Ph. D. in Computer Science from UCSD in 1995. Brad Huffaker serves as a technical manager of several tool development and traffic analysis efforts at CAIDA. He has developed several Java based tools for the visualization of Internet topologies. Brad's current focus is as technical lead on skitter project. Brad graduated from UCSD with the M.S in Computer Science. David Moore is the Co-Director and a PI of CAIDA. His research interests are high speed network monitoring, denial-of-service attacks and infrastructure security, and Internet traffic characterization. He also led the development of NetGeo, an automated tool that maps IP addresses, domain names, and Autonomous Systems numbers to geographic locations. References[1] ``Caida Network Measurement Tool skitter,'' https://www.caida.org/tools/measurement/skitter/.[2] D. Meyer, ``University of Oregon Route Views Project,'' https://www.antc.uoregon.edu/route-views/. [3] ``Caida skitter Destination Lists,'' https://www.caida.org/tools/measurement/skitter/lists/. [4] ``Caida Network Measurement Tool netgeo,'' https://www.caida.org/tools/utilities/netgeo/. [5] Huffaker, B., M. Fomenkov, D. Moore, E. Nemeth, and k. claffy, ``Measurements of the Internet Topology in the Asia-Pacific Region,'' Proceedings of INET00, Yokohama, Japan, The Internet Society, 2000. [6] Huffaker, B., M. Fomenkov, k claffy, and D. Moore, ``Macroscopic Analyses of the Infrastructure: Measurement and Visualization of Internet Connectivity and Performance,'' Proceedings of PAM2001, A workshop on Passive and Active Measurements, Amsterdam, Netherlands, RIPE NCC, April, 2001. [7] ``Caida skitter Daily Summary,'' https://www.caida.org/skitter_summary/main.pl. [8] Mockapetris, P., ``RFC 1034: Domain Names - Concepts and Facilities,'' Oct. 1987. [9] Albitz, P., and C. Liu, DNS and BIND, O'Reilly and Associates, 1998. [10] ``Bind website.'' https://www.isc.org/products/BIND/. [11] Huitema, C., and S. Weerahandi, ``Internet Measurements: The Rising Tide and the DNS Snag,'' Proceedings of 13th ITC Specialist Seminar, Monterey, California, 2000. [12] Rood, H., ``What is in a Name, What is in a Number: Some Characteristics of Identifiers on Electronic Networks,'' Telecommunications Policy, Vol. 24, pp. 533-552, 2000. [13] Brownlee, N., kc Claffy, and E. Nemeth, ``DNS root/gtld Performance Measurements,'' Usenix LISA XV paper, December, 2001. [14] Moore, D., R. Periakaruppan, J. Donohoe, and k. Claffy, ``Where in the World is netgeo.caida. org?,'' Proceedings of INET00, Yokohama, Japan, The Internet Society, 2000. |
|
This paper was originally published in the
Proceedings of the LISA 2001 15th System Administration Conference, December 2-7, 2001, San Diego, California, USA.
Last changed: 2 Jan. 2002 ml |
|
